
Mass spectrometer

a mass spectrometer and mass spectrum technology, applied in the field of mass spectrometers, can solve the problems of adversely affecting mass measurement accuracy, many mass spectrometric techniques have detection limits which are restricted or otherwise compromised, and can be particularly problematic background chemical noise in a mass spectrum, so as to remove or reduce the effect of estimated background intensity

Active Publication Date: 2005-10-20
MICROMASS UK LTD
View PDF4 Cites 49 Cited by
  • Summary
  • Abstract
  • Description
  • Claims
  • Application Information

AI Technical Summary

Benefits of technology

[0021] adjusting the intensity of one or more regions or portions of the mass spectral data or the mass spectrum in order to remove or reduce the effects of the estimated background intensity.
[0040] means which adjusts, in use, the intensity of one or more regions or portions of the mass spectral data set or mass spectrum in order to remove or reduce the effects of the estimated background intensity.
[0044] The preferred embodiment relates to an adaptive background subtraction method which reduces the effects of periodic chemical background noise in mass spectra.
[0045] The preferred method examines the intensity distribution in a local area of a mass spectrum and estimates that part of the signal due to background noise by statistical analysis. Further areas of the mass spectrum are then preferably analysed and the process is preferably repeated. According to the preferred embodiment, the estimated background noise in a particular portion or region of a mass spectrum is subtracted from the raw or experimentally obtained mass spectral data to produce a processed mass spectrum which exhibits significantly reduced background noise. The preferred embodiment is particularly effective in suppressing background noise having a periodic nature and also background noise which varies with mass to charge ratio.
[0047] The preferred method is particularly suitable for reducing the effect of background signals which have periodic intensity variations. The preferred embodiment is also effective in reducing the effect of unwanted background noise when the background noise exhibits a slow continuous variation in intensity relative to the intensity variation associated with an analyte signal. The preferred method also enables automated background subtraction to be performed and enables mass spectra to be produced which have a significantly improved signal to noise ratio.
[0052] The preferred method has the particular advantage over the known frequency domain filtering method in that the preferred method avoids creating artefacts or extra noise spikes in the processed mass spectral data. Such artefacts or extra noise spikes can be a particular problem when the known frequency domain filtering approach is used.

Problems solved by technology

Background chemical noise in a mass spectrum can be particularly problematic.
However, in practice, saturated hydrocarbons and saturated bromocarbons are rarely encountered when mass analysing biochemical samples such as proteins and peptides.
Many mass spectrometric techniques have detection limits which are restricted or otherwise compromised by the presence of chemical background noise.
The precise chemical nature of the background noise is often unknown and the presence of unwanted chemical background noise can adversely affect mass measurement accuracy especially if an analyte signal is not fully resolved due to chemical background noise.
Impurities in drying or nebulizing gases can also cause chemical background noise.
Contamination of the solvent or analyte delivery system or contamination within or on the surfaces of an ionisation chamber can be a further source of chemical background noise.
In general the chemical background noise observed in mass spectra tends to be complex in nature and may only be partially mass resolved.
However, one problem with frequency domain filtering is that the unprocessed time of flight mass spectra data will comprise intensity data which is equally spaced in time due to the acquisition electronics.
However, disadvantageously, the use of an interpolation algorithm significantly increases the overall processing time.
In addition to increasing the overall processing time, the known approach of reducing periodic noise in a mass spectrum by filtering the data in the frequency domain suffers from the problem that the application of a filter to the frequency domain data to remove noise components can actually result in additional noise and discontinuities being present into the mass spectrum after data in the frequency domain has been transformed back into the mass to charge ratio domain.
Another problem with the known frequency domain filtering approach is that a proportion of the desired analyte signal will have frequency components which are similar or identical to the frequency components corresponding to unwanted background noise.
Accordingly, the removal of such components in the frequency domain can lead to distortion both of the analyte ion peak shape and also of the intensity of the analyte signal in the final processed mass spectrum.
A yet further problem with the known frequency domain filtering approach is in responding to changes in the characteristic of the background noise as a function of mass to charge ratio.
However, discontinuities can then arise when a composite mass spectrum is subsequently reconstructed from the separate sections of data.
It is apparent therefore that the known frequency domain filtering approach suffers from a number of problems.

Method used


Image

  • Mass spectrometer
  • Mass spectrometer
  • Mass spectrometer

Examples


Embodiment Construction

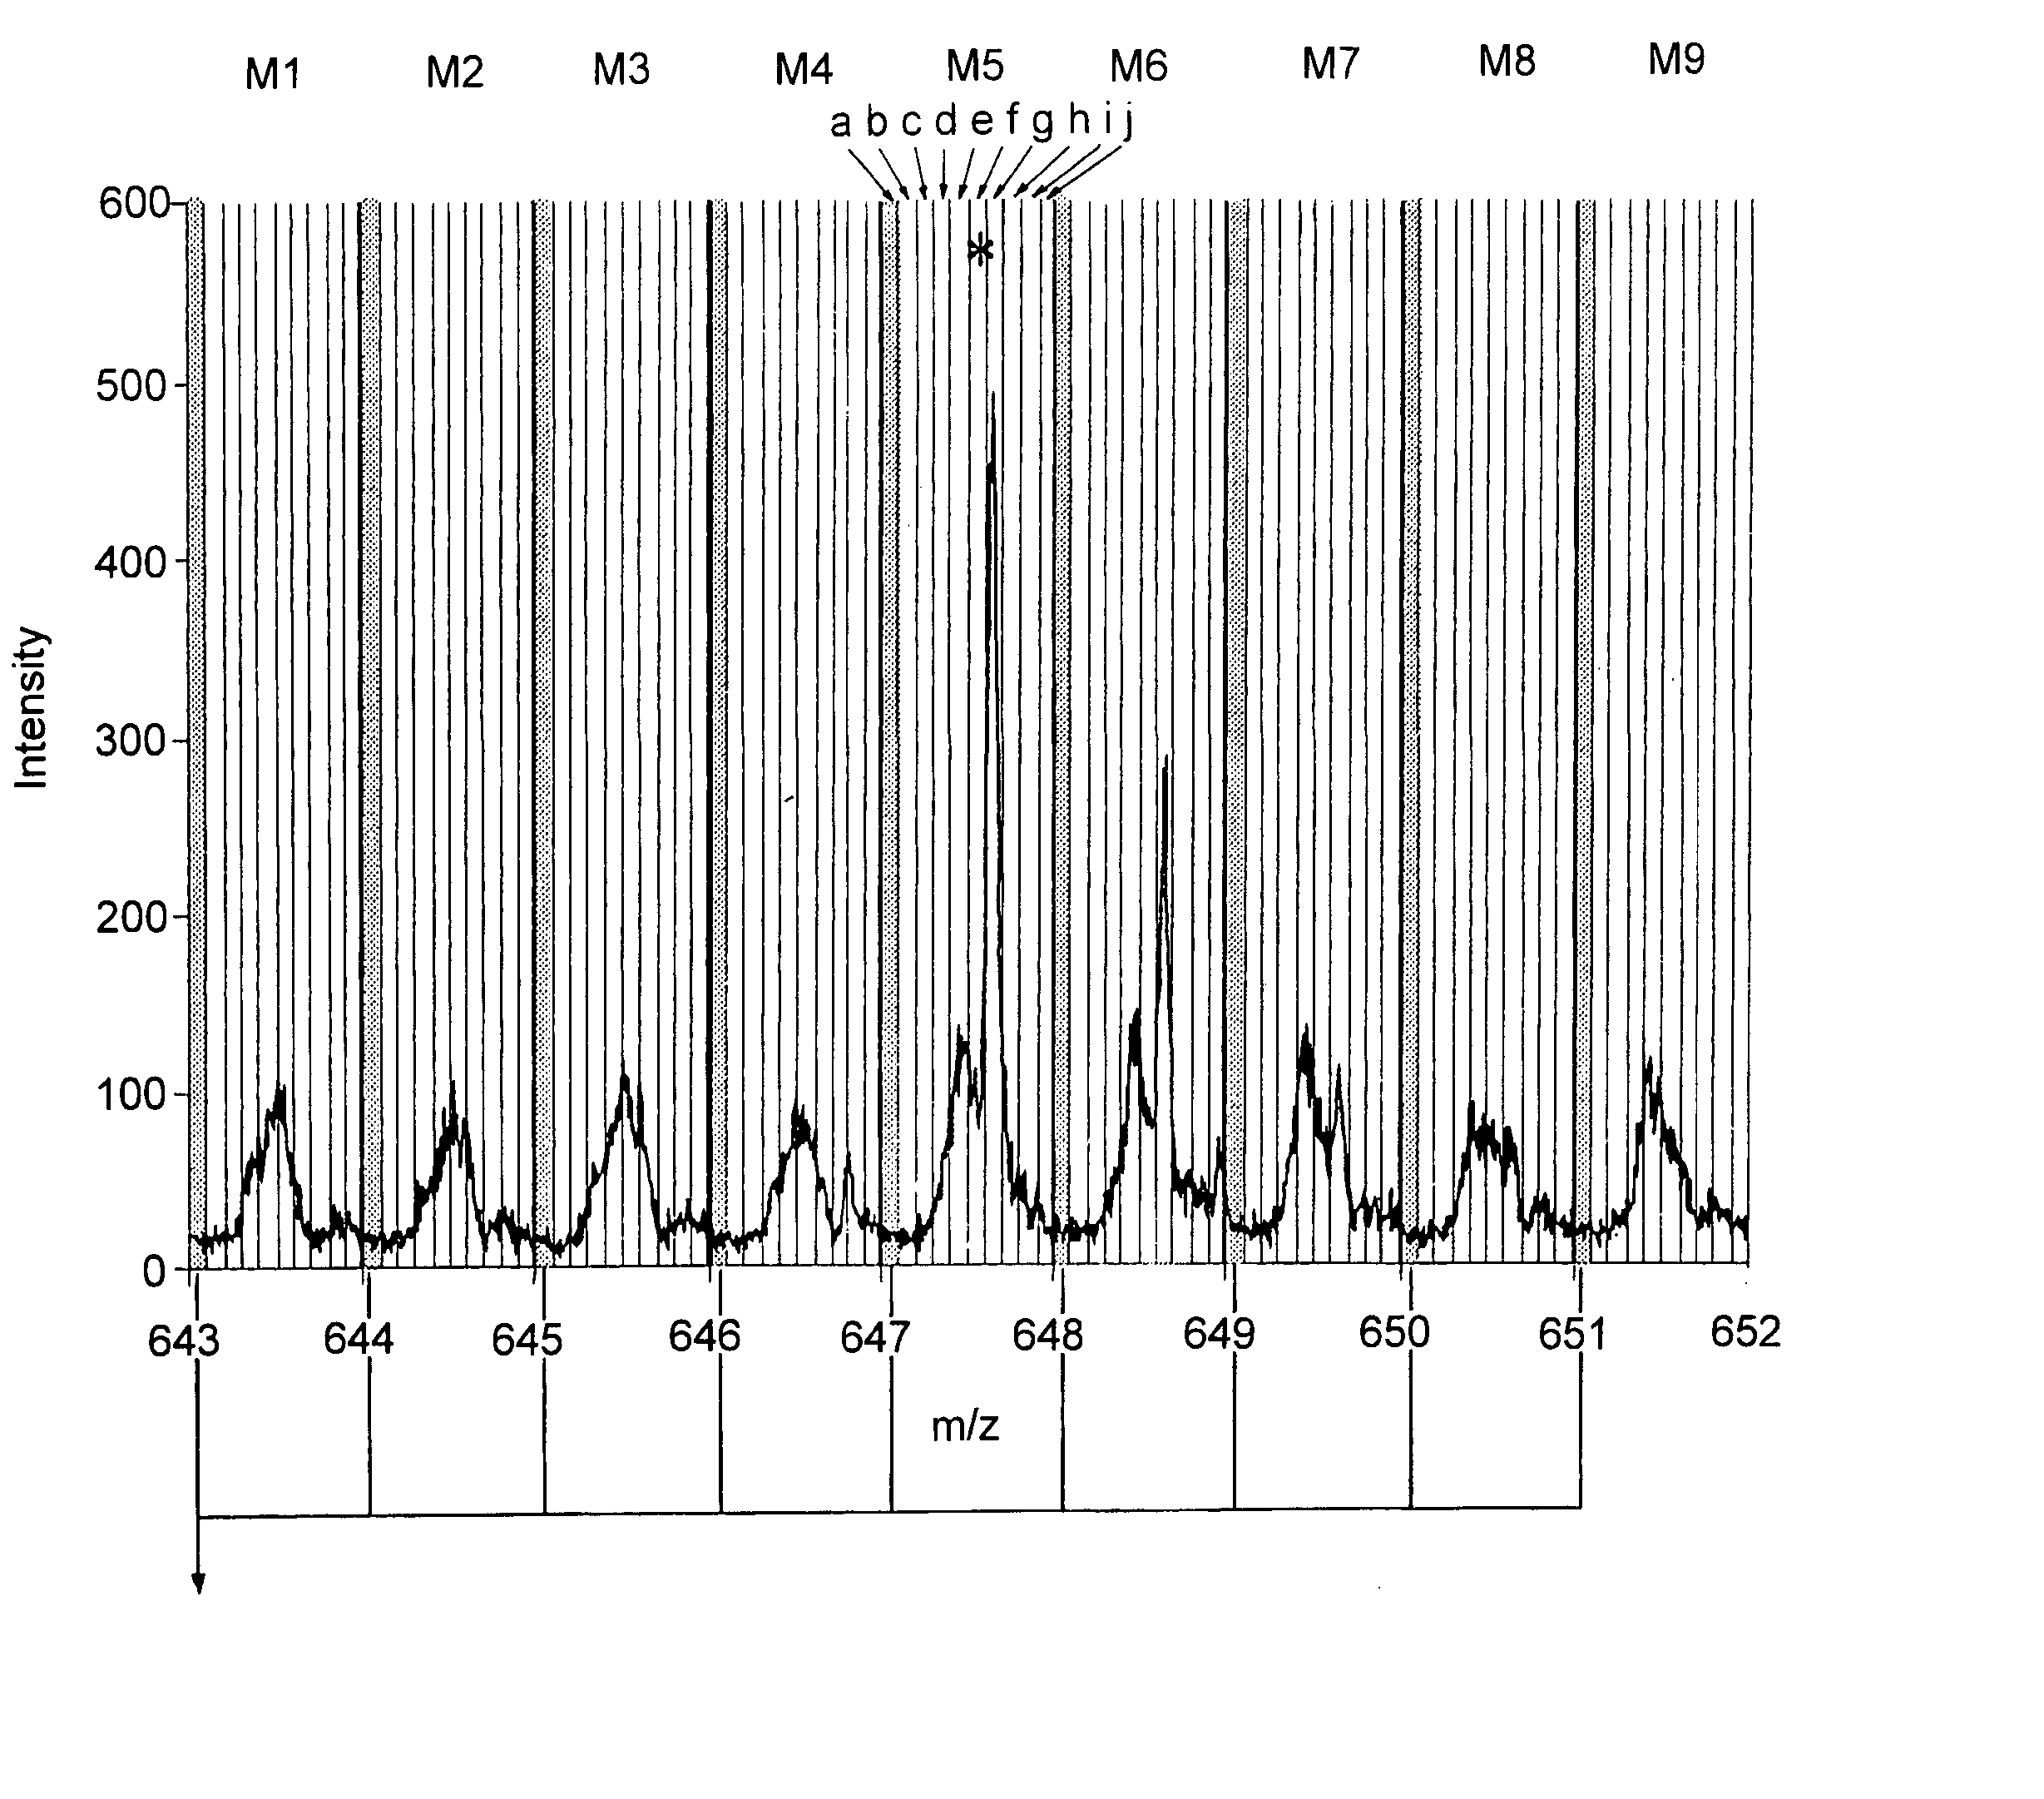
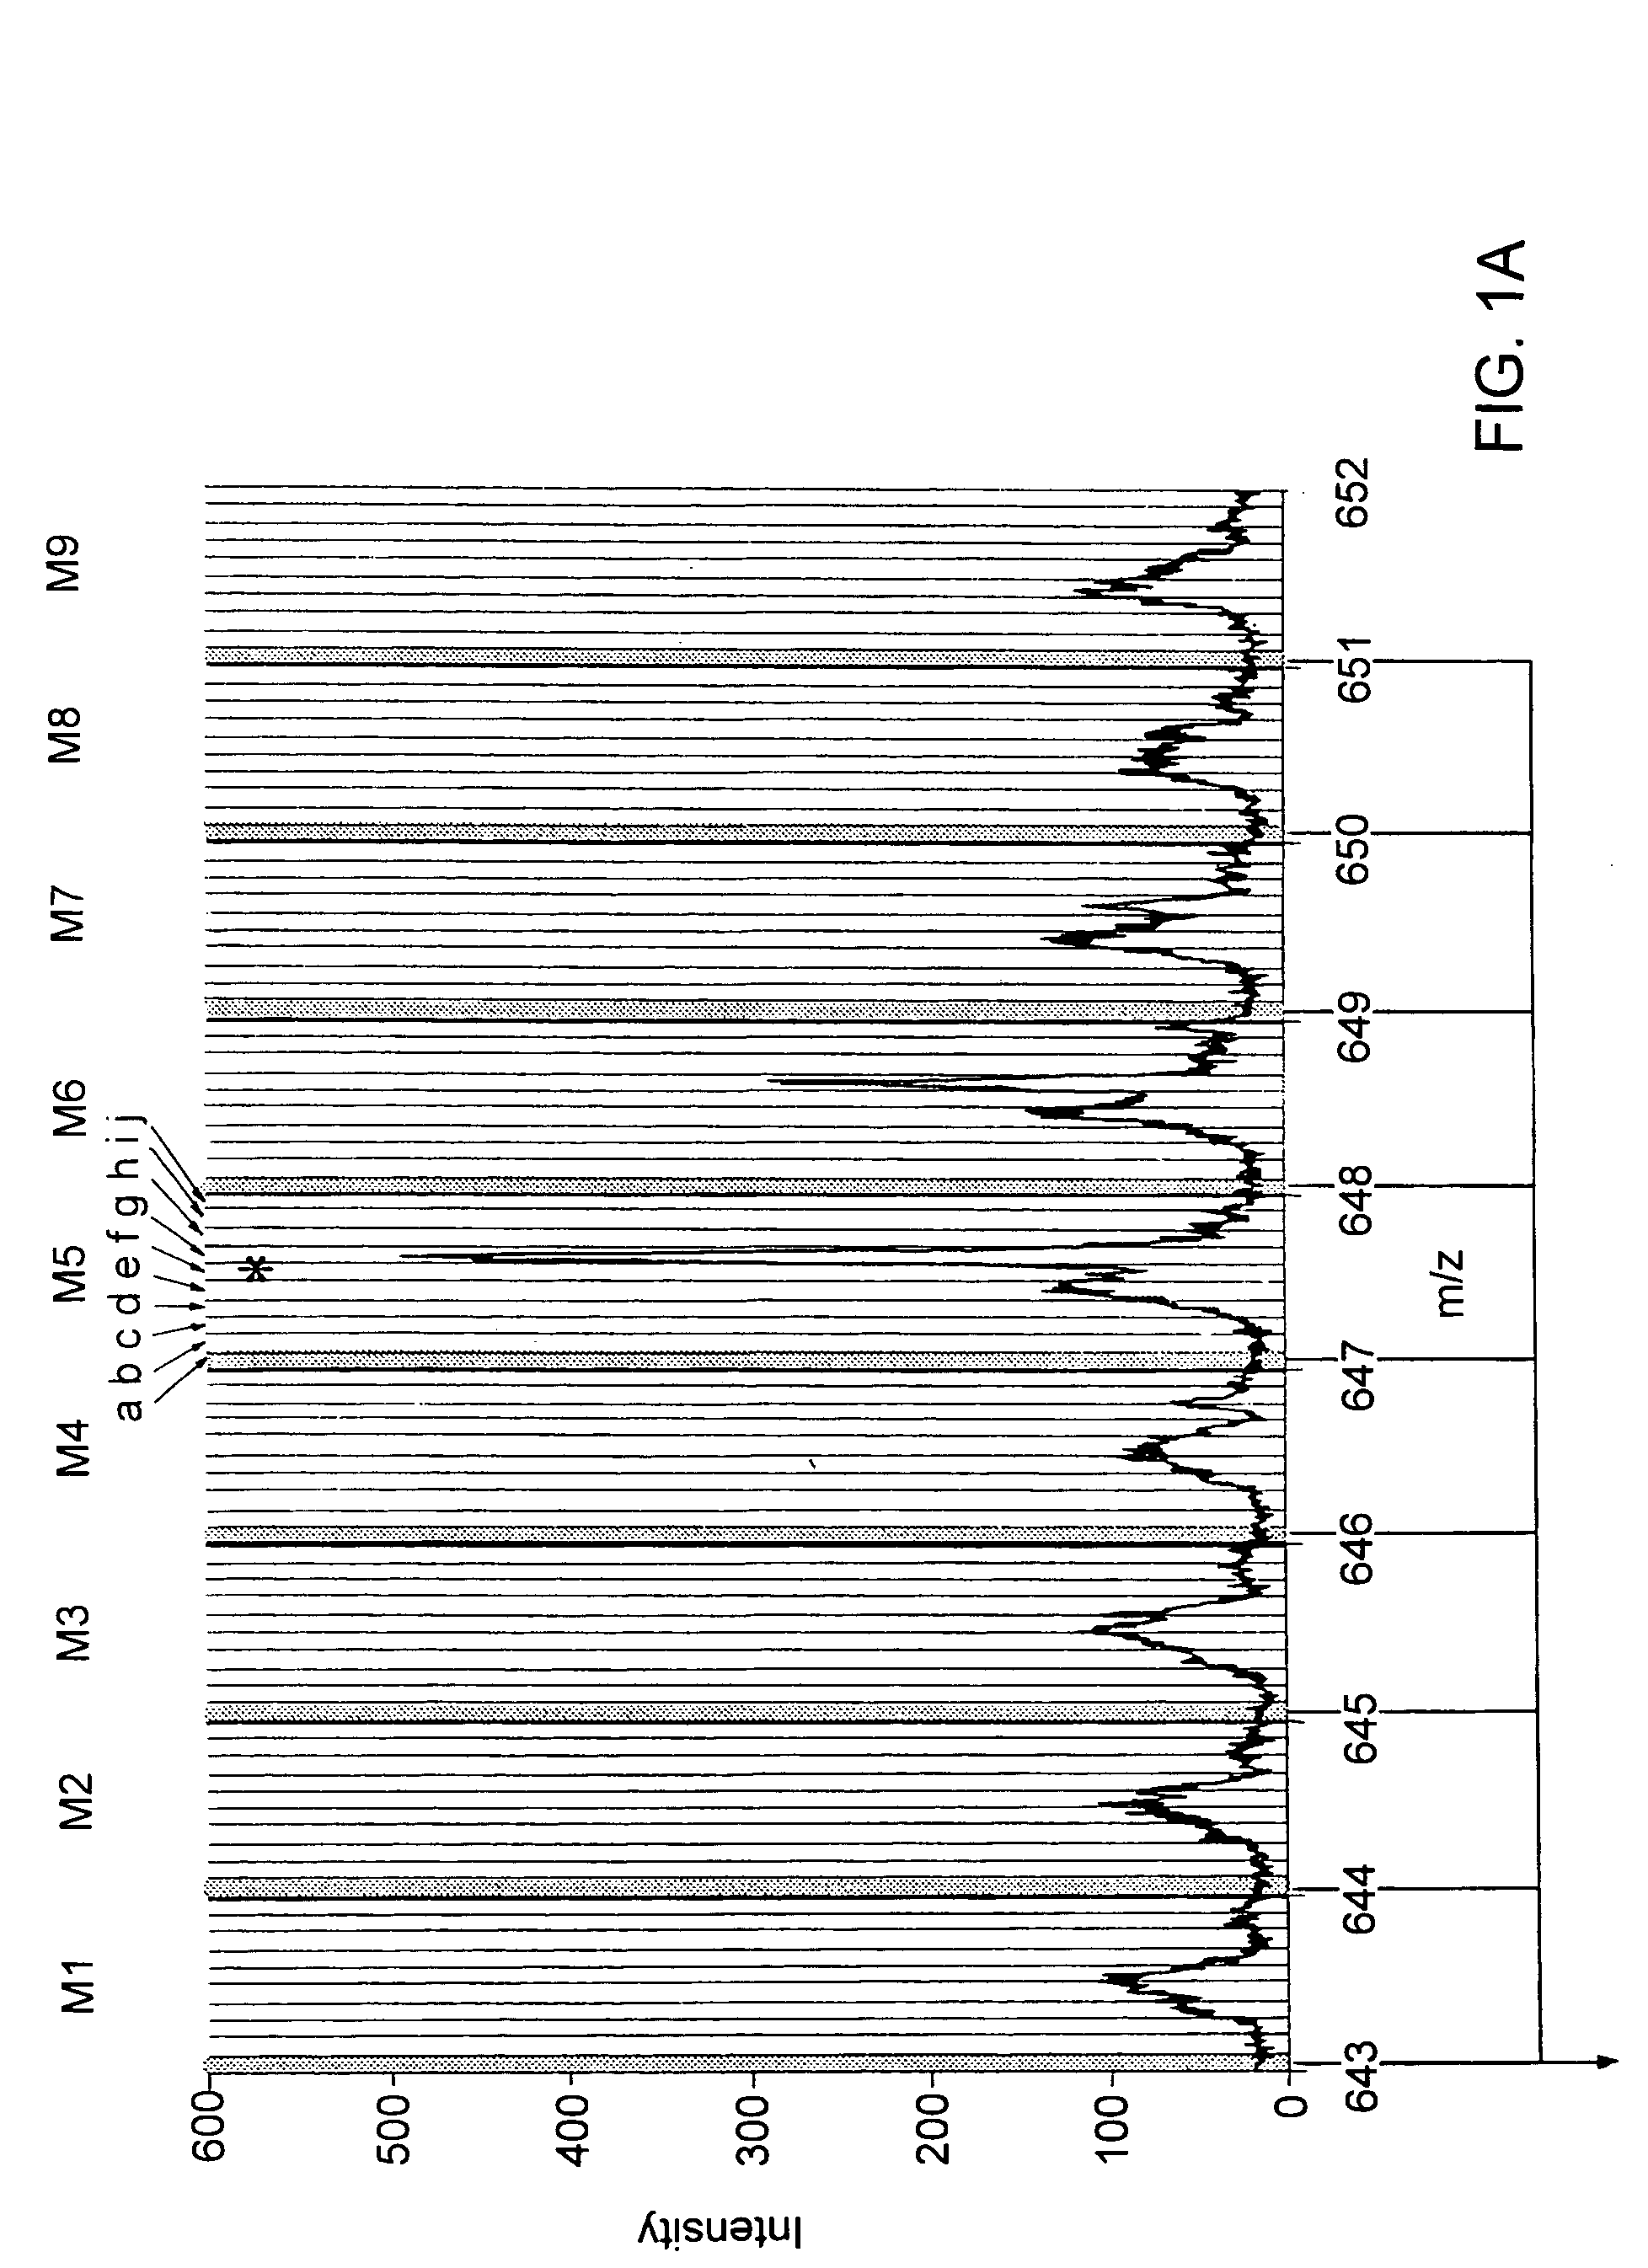
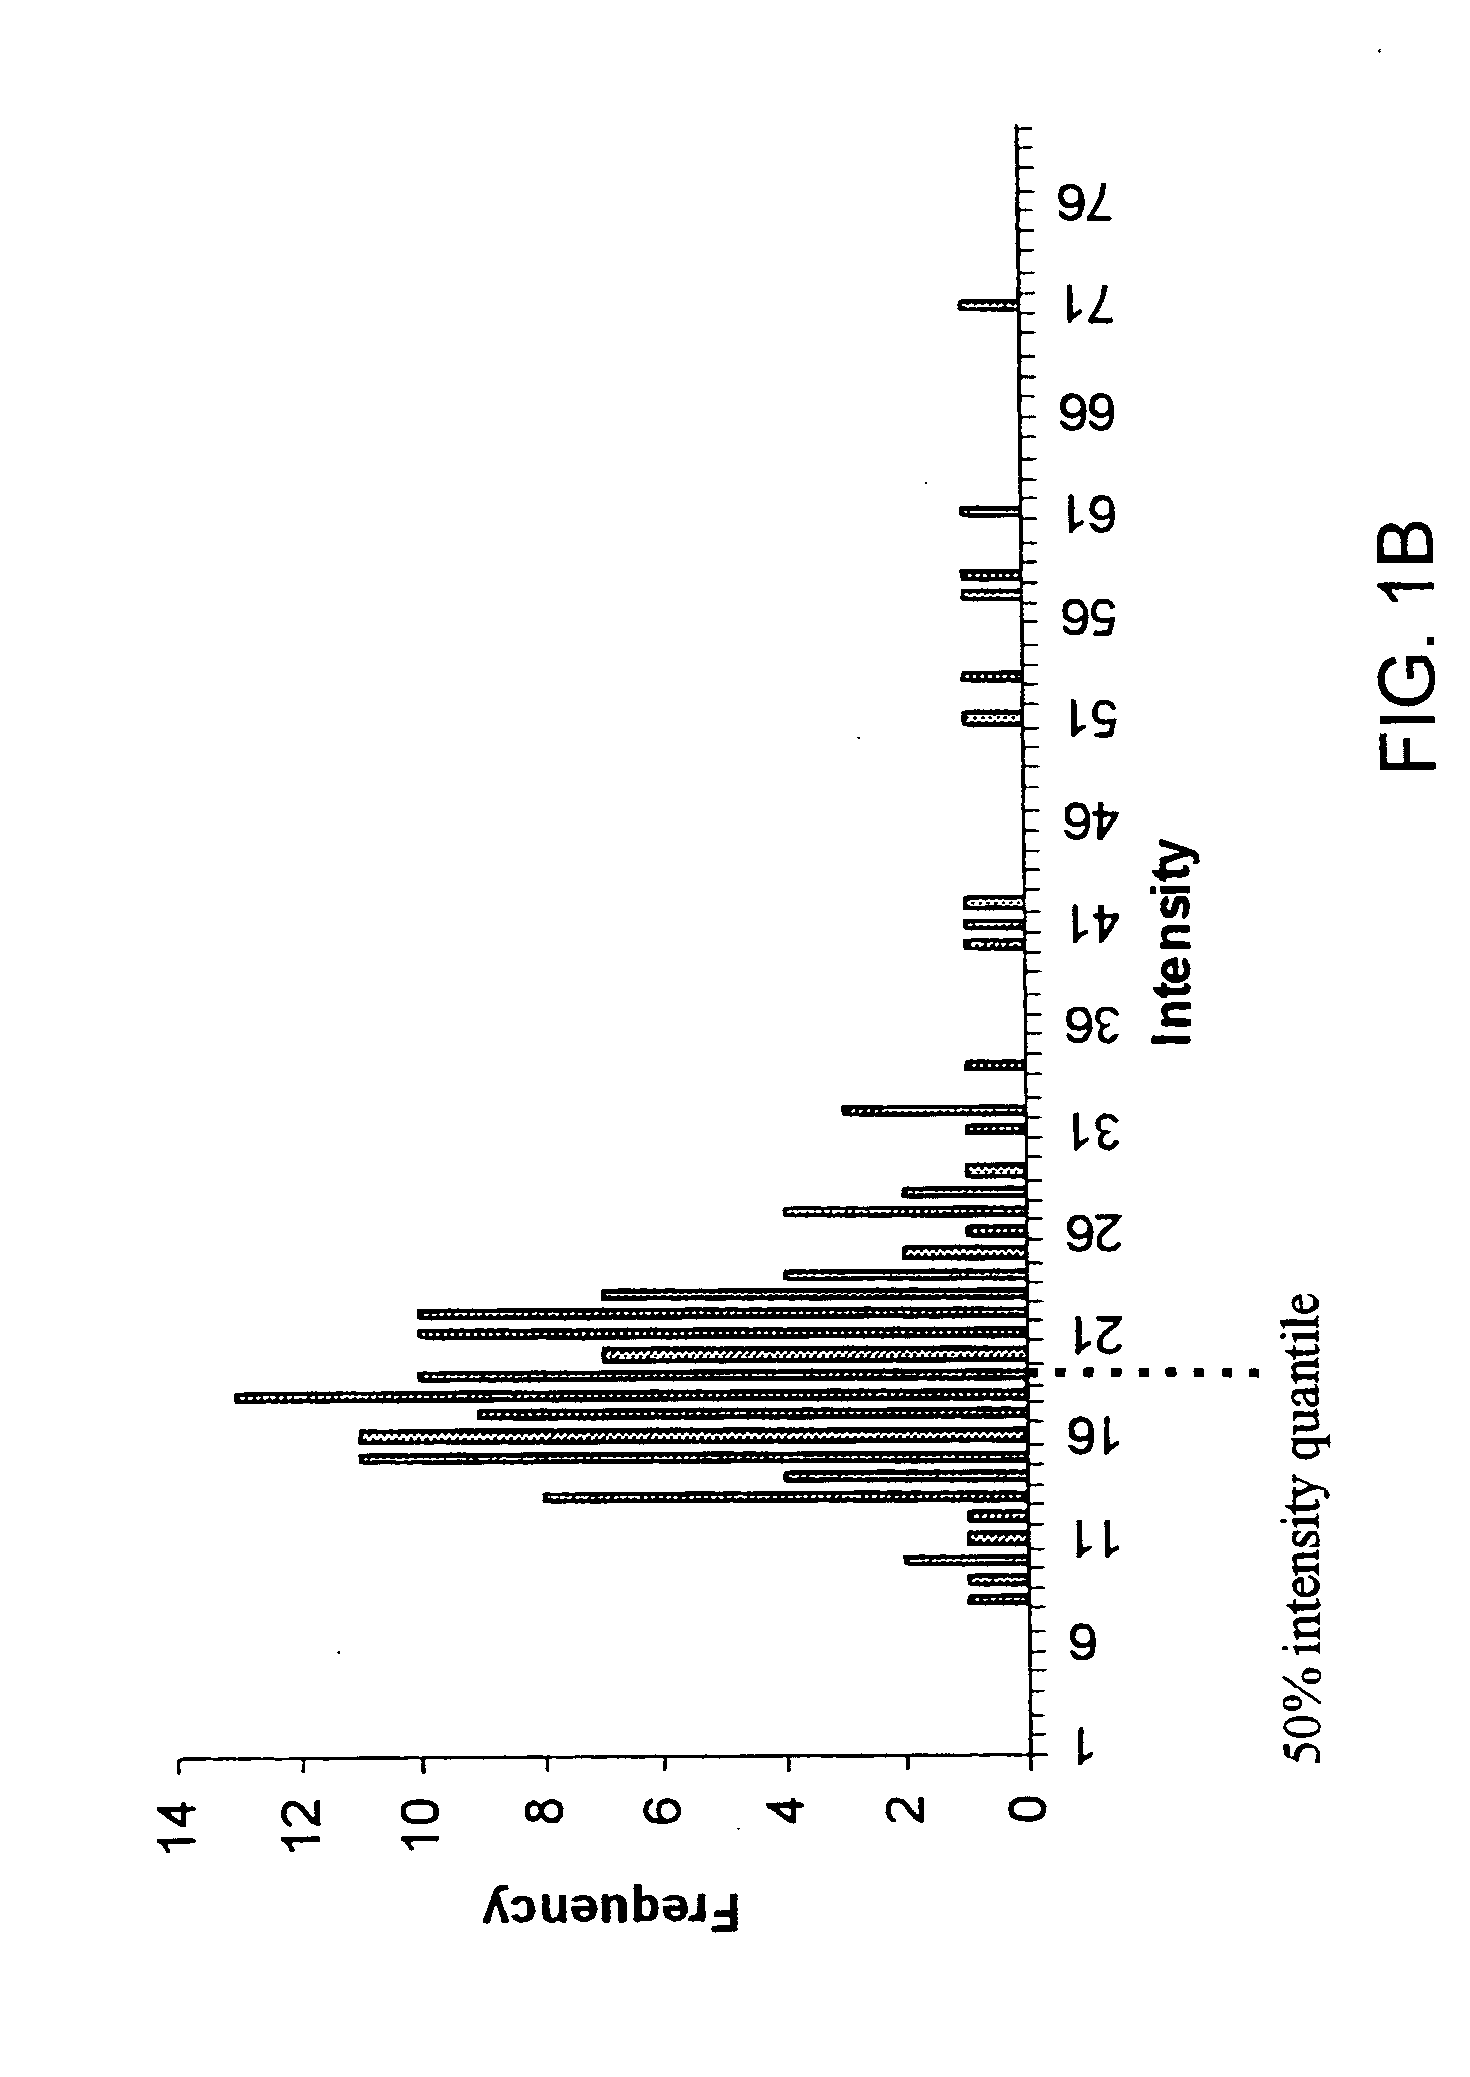
[0061] An embodiment of the present invention will now be described with reference to FIGS. 1A, 1B and 2. However, the embodiment shown and described with reference to FIGS. 1A, 1B and 2 has been simplified for ease of illustration. According to a particularly preferred embodiment, an overall mass window having a width of 21.0105 atomic mass units (Daltons) and comprising 21 nominal mass windows each 1.0005 atomic mass units (Daltons) wide is applied to a mass spectrum. Each nominal mass window is preferably divided into 20 discrete channels. However, for ease of illustration, the embodiment shown and described with reference to FIGS. 1A, 1B and 2 relates to using a smaller overall mass window which is only 9 atomic mass units wide and which comprises only 9 nominal mass windows each having a width of precisely 1 atomic mass unit (Dalton). Each nominal mass window is shown divided into 10 discrete channels, again for ease of illustration.

[0062]FIG. 1A shows a portion of a mass spec...


PUM


Abstract

A mass spectrometer and a method of mass spectrometry are disclosed wherein periodic background noise is effectively filtered out from the mass spectral data. An overall mass window is superimposed upon the mass spectral data. The overall mass window preferably comprises 21 nominal mass windows each preferably having a width of 1.0005 amu. Each nominal mass window preferably comprises 20 channels. An intensity distribution relating to all the first channels of the 21 nominal mass windows is determined. An intensity quantile is determined from the intensity distribution. The intensity quantile is taken to represent the background intensity in the first channel of the central nominal mass window. This process is repeated for the other channels so that the background intensity across the whole of the central nominal mass window is estimated and then subtracted from the raw mass spectral data comprising the central nominal mass window. The overall mass window is then preferably advanced approximately 1 amu and the process is repeated multiple times.

Description

CROSS REFERENCE TO RELATED APPLICATIONS [0001] This application claims priority from UK patent application no. GB 0329544.0 filed 22 Dec. 2003 and U.S. patent application Ser. No. 60 / 585,772 filed 7 Jul. 2004. The contents of these applications are incorporated herein by reference.FIELD OF THE INVENTION [0002] The present invention relates to a mass spectrometer and a method of mass spectrometry. BACKGROUND OF THE INVENTION [0003] Background chemical noise in a mass spectrum can be particularly problematic. The background chemical noise observed in mass spectra often has a periodic nature especially at mass to charge ratios less than 1000. As will be understood by those skilled in the art, all elements have near integral masses. Carbon-only graphite has, by definition, an exact integer mass of 12 and all other molecules of the same nominal mass will have an exact mass which is not quite an exact integer value but yet which is only slightly higher or lower than the corresponding mass...

Claims


Application Information

Patent Timeline
Patent Type & Authority Applications(United States)
IPC IPC(8): H01J49/00
CPCH01J49/0036
Inventor DENNY, RICHARDRICHARDSON, KEITHSKILLING, JOHN
Owner MICROMASS UK LTD
Learn More