System and Method for Spectral Analysis

a spectral analysis and system technology, applied in the field of blind source separation and multi-dimensional spectroscopic data classification, can solve the problems of “overlapping” pure component spectra, poor convergence properties, and currently only poorly utilized, and achieve the effect of increasing chemical shift dispersion and greater detection sensitivity

Inactive Publication Date: 2009-01-01
SIGMED
View PDF21 Cites 91 Cited by
  • Summary
  • Abstract
  • Description
  • Claims
  • Application Information

AI Technical Summary

Benefits of technology

[0020]In MRS applications, ICA decomposition of a two dimensional MRS data matrix with resonance spectra recorded over a spatial range for example may yield information about the spatial distribution of individual molecular entities in the analyzed sample. This is achieved with both high frequency and spatial resolution without introducing ringing or distortion artifacts commonly observed with conventional Fourier b

Problems solved by technology

However these techniques suffer from the assumption of orthogonal, spectrally “non-overlapping” pure component spectra and poor convergence properties in the absence of a priori information about the absorbing species involved.
There is considerable information in the in vivo 1H NMR spectrum that is currently only poorly utilized, or requires specialized measurements to obtain.
Several metabolites are present at relatively high concentrations, though the MR sensitivity for their detection is poor due to their signal energy being spread over a large number of closely spaced multiplet resonances; strong overlapping resonances due to phase differences in spin echo sequences such as glutamate, glutamine a

Method used


Image

  • System and Method for Spectral Analysis
  • System and Method for Spectral Analysis
  • System and Method for Spectral Analysis

Examples


Embodiment Construction

General Description

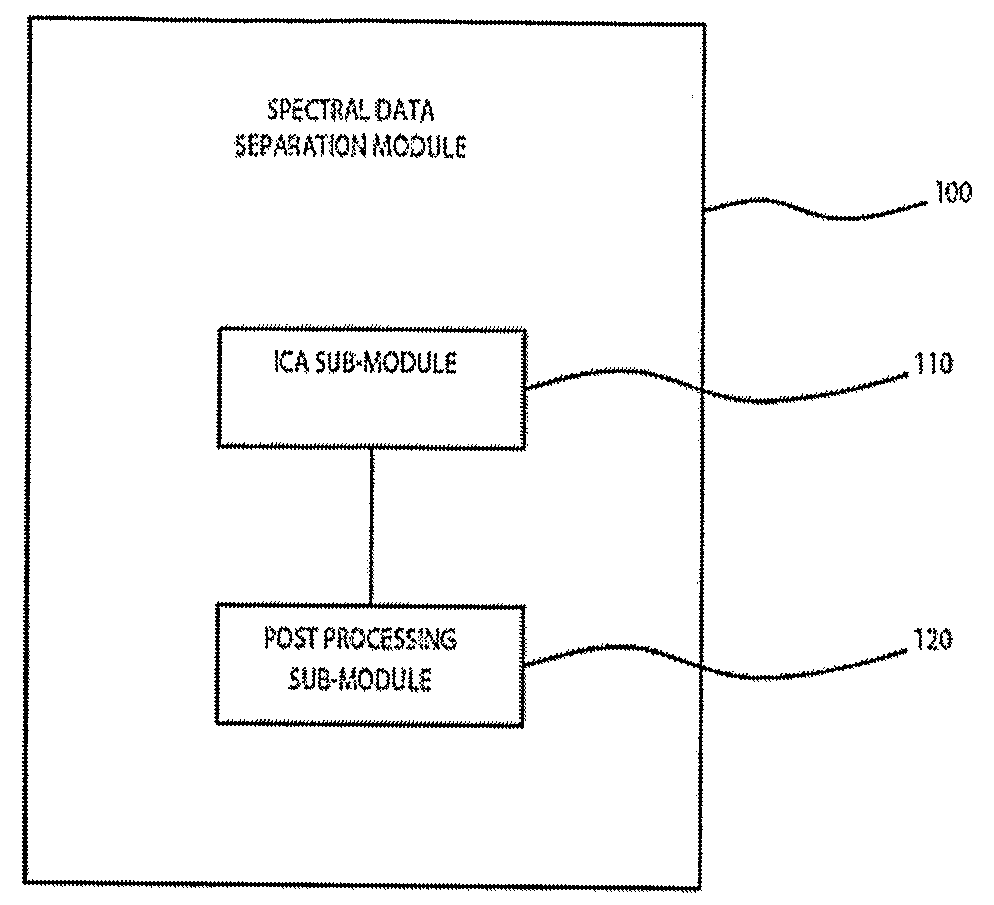
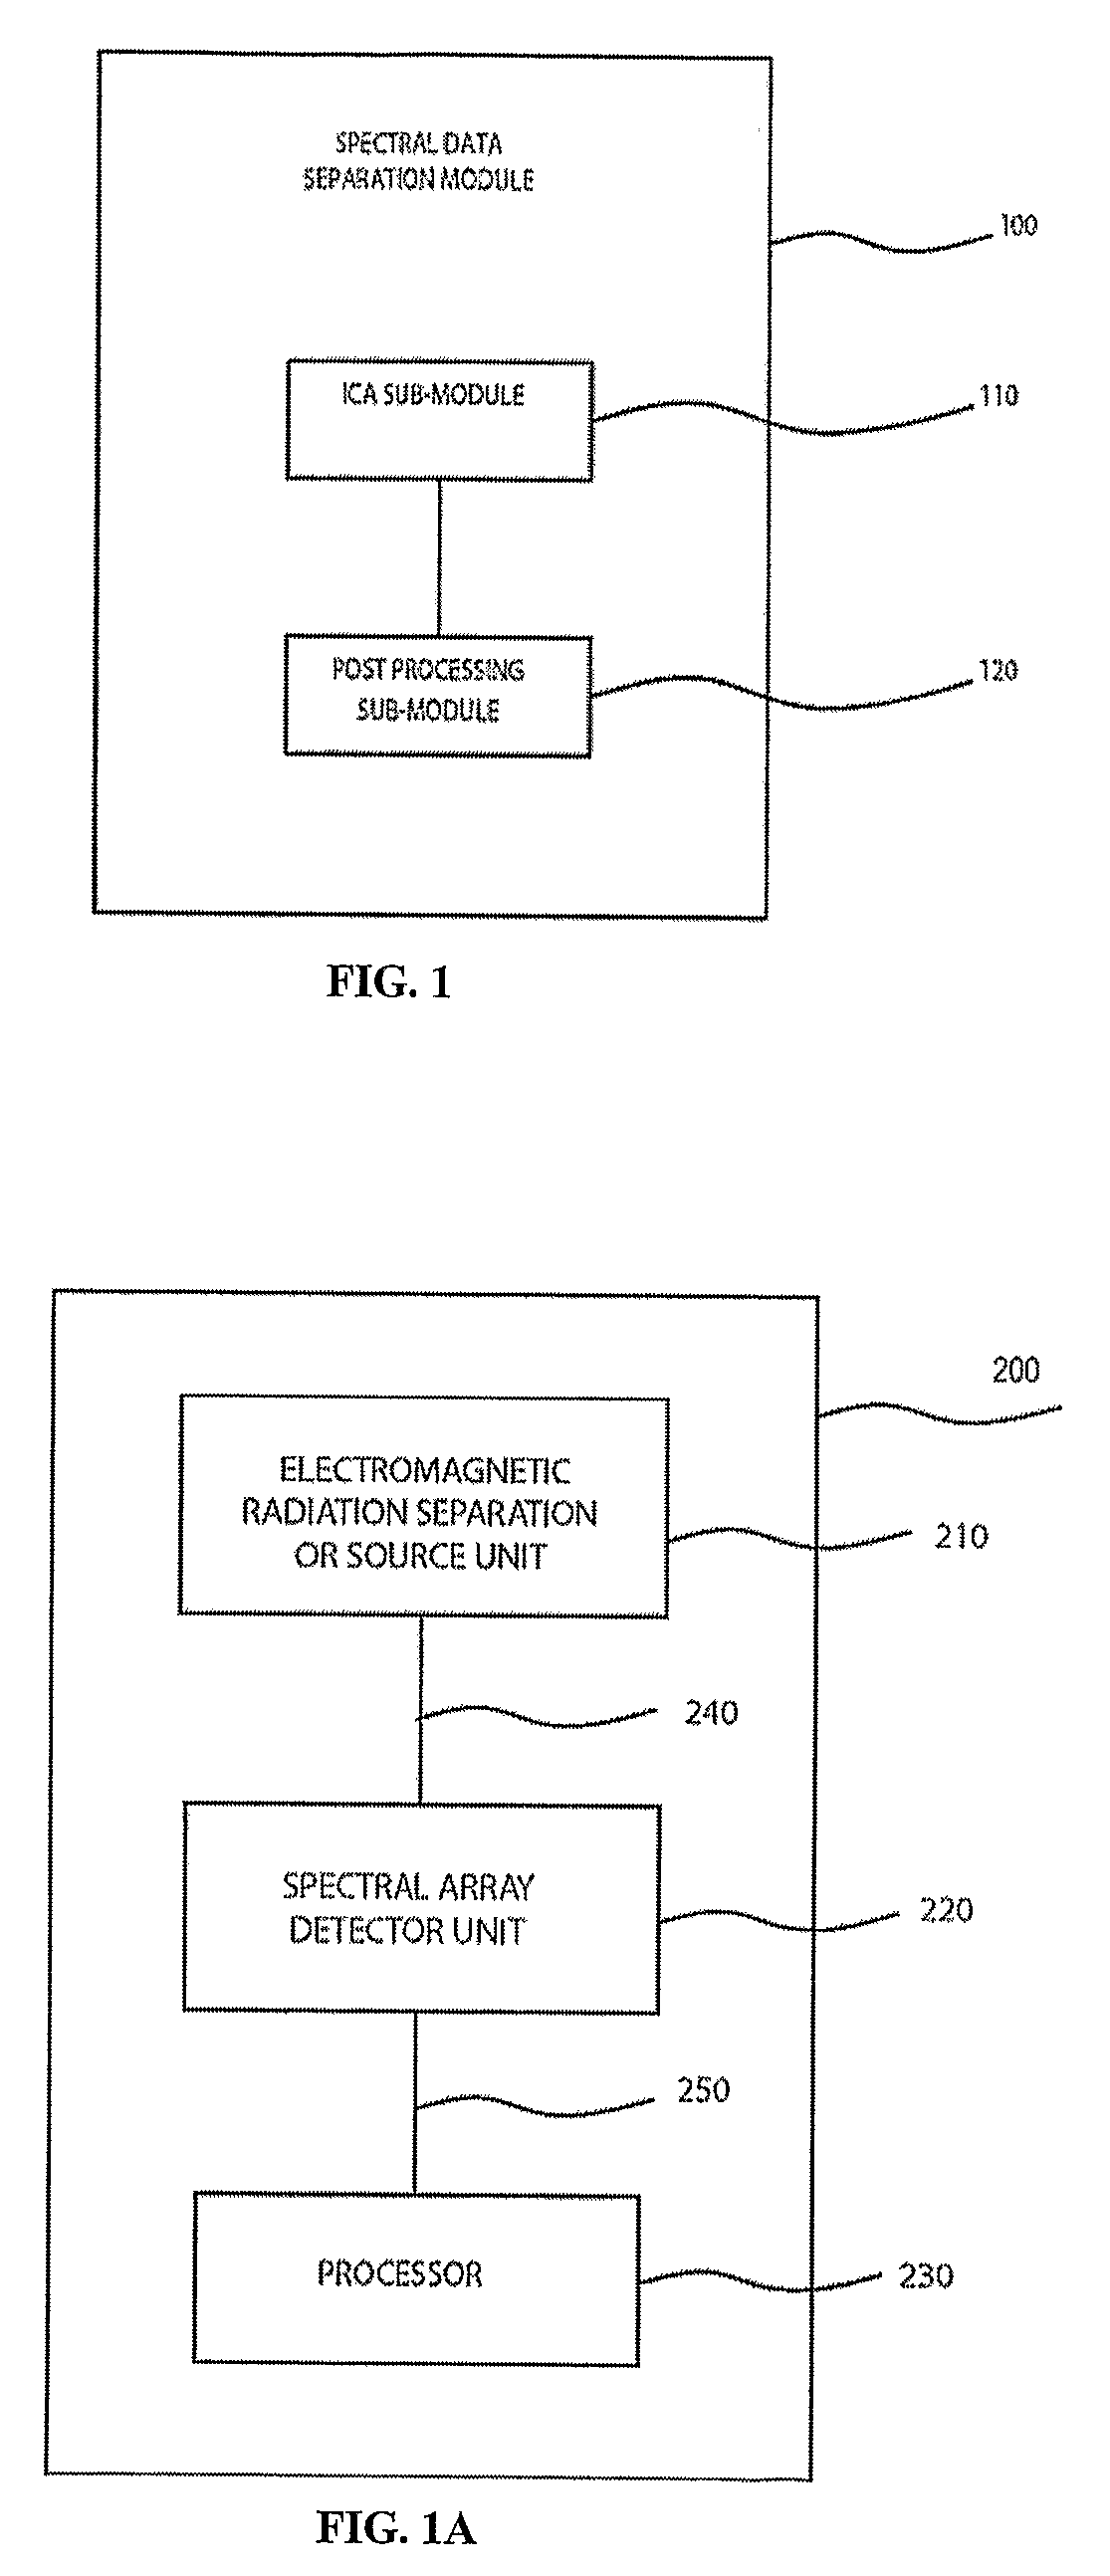
[0033]FIG. 1 illustrates one embodiment of the present invention as spectral analysis module 100. The spectral analysis module includes an ICA processing sub-module 110 and optionally a post-processing sub-module 120. This spectral analysis module 100 can be used alone (e.g., a toolbox) or in a system, as described further herein.

[0034]As used herein, a “module” or “sub-module” can refer to any apparatus, device, unit or computer-readable data storage medium that includes computer instructions in software, hardware or firmware form, or a combination thereof and utilized in systems, subsystems, components or sub-components thereof. It is to be understood that multiple modules or systems can be combined into one module or system and one module or system can be separated into multiple modules or systems to perform the same function(s). Preferably, the invention can be implemented in a variety of computing systems, environments, and / or configurations, including person...


PUM


Abstract

The system and method for spectral analysis uses a set of spectral data. The spectral data is arranged according to a second dimension, such as time, temperature, position, or other condition. The arranged spectral data is used in a signal separation process, such as an independent component analysis (ICA), which generates independent signals. The independent signals are then used for identifying or quantifying a target component.

Description

FIELD OF THE INVENTION[0001]The present invention relates to blind source separation and classification of spectroscopic data. More specifically it relates to the blind source separation of multi-dimensional spectroscopic data.BACKGROUND OF THE INVENTION[0002]Spectroscopic data are usually acquired in the form of a spectrum. A spectrum can be used to obtain information about physical, biological or chemical elements, such as atomic and molecular energy levels, molecular geometries, chemical bonds / compositions / structure, interactions of molecules, density, pressure, temperature, magnetic fields, velocity, and related characteristics and processes. Often, spectra are used to identify the components of a sample (qualitative analysis). Spectra may also be used to measure the amount of material in a sample (quantitative analysis). Although the spectrum is often scaled to the intensity of energy detected, frequency or wavelength, other scales or measures may be used such as the mass or mo...

Claims


Application Information

Patent Timeline
IPC IPC(8): H01J49/26G01J
CPCH01J49/0036G06K9/6242G06F18/21342
Inventor VISSER, ERIKJUNG, TZYY-PINGCHAN, KWOKLEUNG
Owner SIGMED
Why Eureka
Try Eureka