
Apparatus and method for measuring concentrations of fuel mixtures using depth-resolved laser-induced fluorescence

a technology of laser-induced fluorescence and fuel mixture, which is applied in the field of fluorescent spectroscopy devices, can solve the problems of quenching compounds, insufficient use of fluorescent spectroscopy in the industry, and high cost of methods,

Inactive Publication Date: 2009-11-26
KING FAHD UNIVERSITY OF PETROLEUM AND MINERALS
View PDF9 Cites 11 Cited by
  • Summary
  • Abstract
  • Description
  • Claims
  • Application Information

AI Technical Summary

Benefits of technology

This approach allows for accurate and sensitive measurement of fuel mixture concentrations, even at low levels of contamination, by scanning emission spectra at fixed depths or varying the sample depth while maintaining a fixed emission wavelength, providing high-resolution data for calibration curves.

Problems solved by technology

For example, in some areas the more expensive petroleum fuels may be diluted with less expensive petroleum fuels, either intentionally to deceive the purchaser, or unintentionally as the result of contamination in the refining or storage and transport process.
While some methods are available for particular analyses, e.g., the separation and quantification of mixtures of fuels having different octane numbers by gas chromatography, such methods are expensive, time consuming, and complicated.
Petroleum products are dense, contain mixtures of hydrocarbons having overlapping excitation-emission spectra so that fluorescent emissions may be reabsorbed, and also may be contaminated with quenching compounds.
For these reasons, fluorescent spectroscopy is not widely used in the industry.

Method used


Image

  • Apparatus and method for measuring concentrations of fuel mixtures using depth-resolved laser-induced fluorescence
  • Apparatus and method for measuring concentrations of fuel mixtures using depth-resolved laser-induced fluorescence
  • Apparatus and method for measuring concentrations of fuel mixtures using depth-resolved laser-induced fluorescence

Examples


example 1

Kerosene Contaminated with Minute Concentrations of Diesel Fuel (Sample Data and Analysis)

[0068]This example first shows the types of spectroscopic data acquired by the method. This is done in both modes of operation for the (K:D=95:5) mixture. Then, the complete mixtures of Set 1 are considered in the same manner, followed by demonstrations of possible ways for constructing calibrations curves to predict the concentrations.

[0069]Referring to FIG. 3, there are shown depth-resolved emission spectra for the (K:D=95:5) mixture at depths of point numbers 9 through 13. They were collected by scanning the monochromator at these fixed depths (first mode of operation). It can be seen that the spectra vary dramatically with depth. This variation is mainly due to the emission reabsorption effect as described above. The deeper the location from which the emitted fluorescence is monitored, the more the emission spectra shift toward longer wavelengths, indicating that there is a gradual transfer...

example 2

Kerosene and Diesel Mixtures in the Range from 10% to 90%

[0077]The second example considers the kerosene / diesel fuel mixtures of Set 2, which has concentrations of (K %:D %)=(90:10), (80:20), (70:30), (50:50), (30:75), and (10:90), and focuses on the second mode of operation only. The effect of varying the laser intensity and the size of the slit of moving sample holder on the observed diagrams are also investigated. The laser energy per pulse used in this example is 4 mJ, as opposed to 5 mJ that was used in the previous example.

[0078]Referring to FIGS. 7A, 7B, and 7C, there are shown plots of fluorescence intensities emitted at wavelengths 370 nm, 420 nm, and 450 nm, respectively, versus depth for these mixtures. The plots are all normalized at the maximum intensity observed at point no. 9, and they are all shown in sections between point nos. 9 and 50 (corresponding to depths between 1.44 mm and 8.00 mm). It can be seen that the situation here is different from that of Example 1. ...

example 3

Diesel Fuel Contaminated with Minute Concentrations of Kerosene

[0083]Both diesel fuel and kerosene are considered middle distillates of the crude oil. The composition of kerosene includes blends of C9 to C16 hydrocarbons with a boiling range of about 300-550° F., while that of diesel fuel includes blends of C9 to C20 hydrocarbons with boiling range of about 325-675° F. The lighter hydrocarbon blends in the kerosene bring about a narrower fluorescence emission spectrum than that of diesel fuel. Example 1 dealt with a situation in which kerosene, having a narrower spectrum, was contaminated with small amounts of diesel fuel, a blend that has a broader spectrum. In the present example we deal with the reverse case.

[0084]In this example, we consider the kerosene / diesel fuel mixtures of Set 3, which has concentrations of (K %:D %)=(5:95), (3:97), (2:98), (1:99), and (0:100), and we focus only on the second mode of operation. Referring to FIGS. 10A, 10B, and 10C, there are shown plots of ...


PUM


Abstract

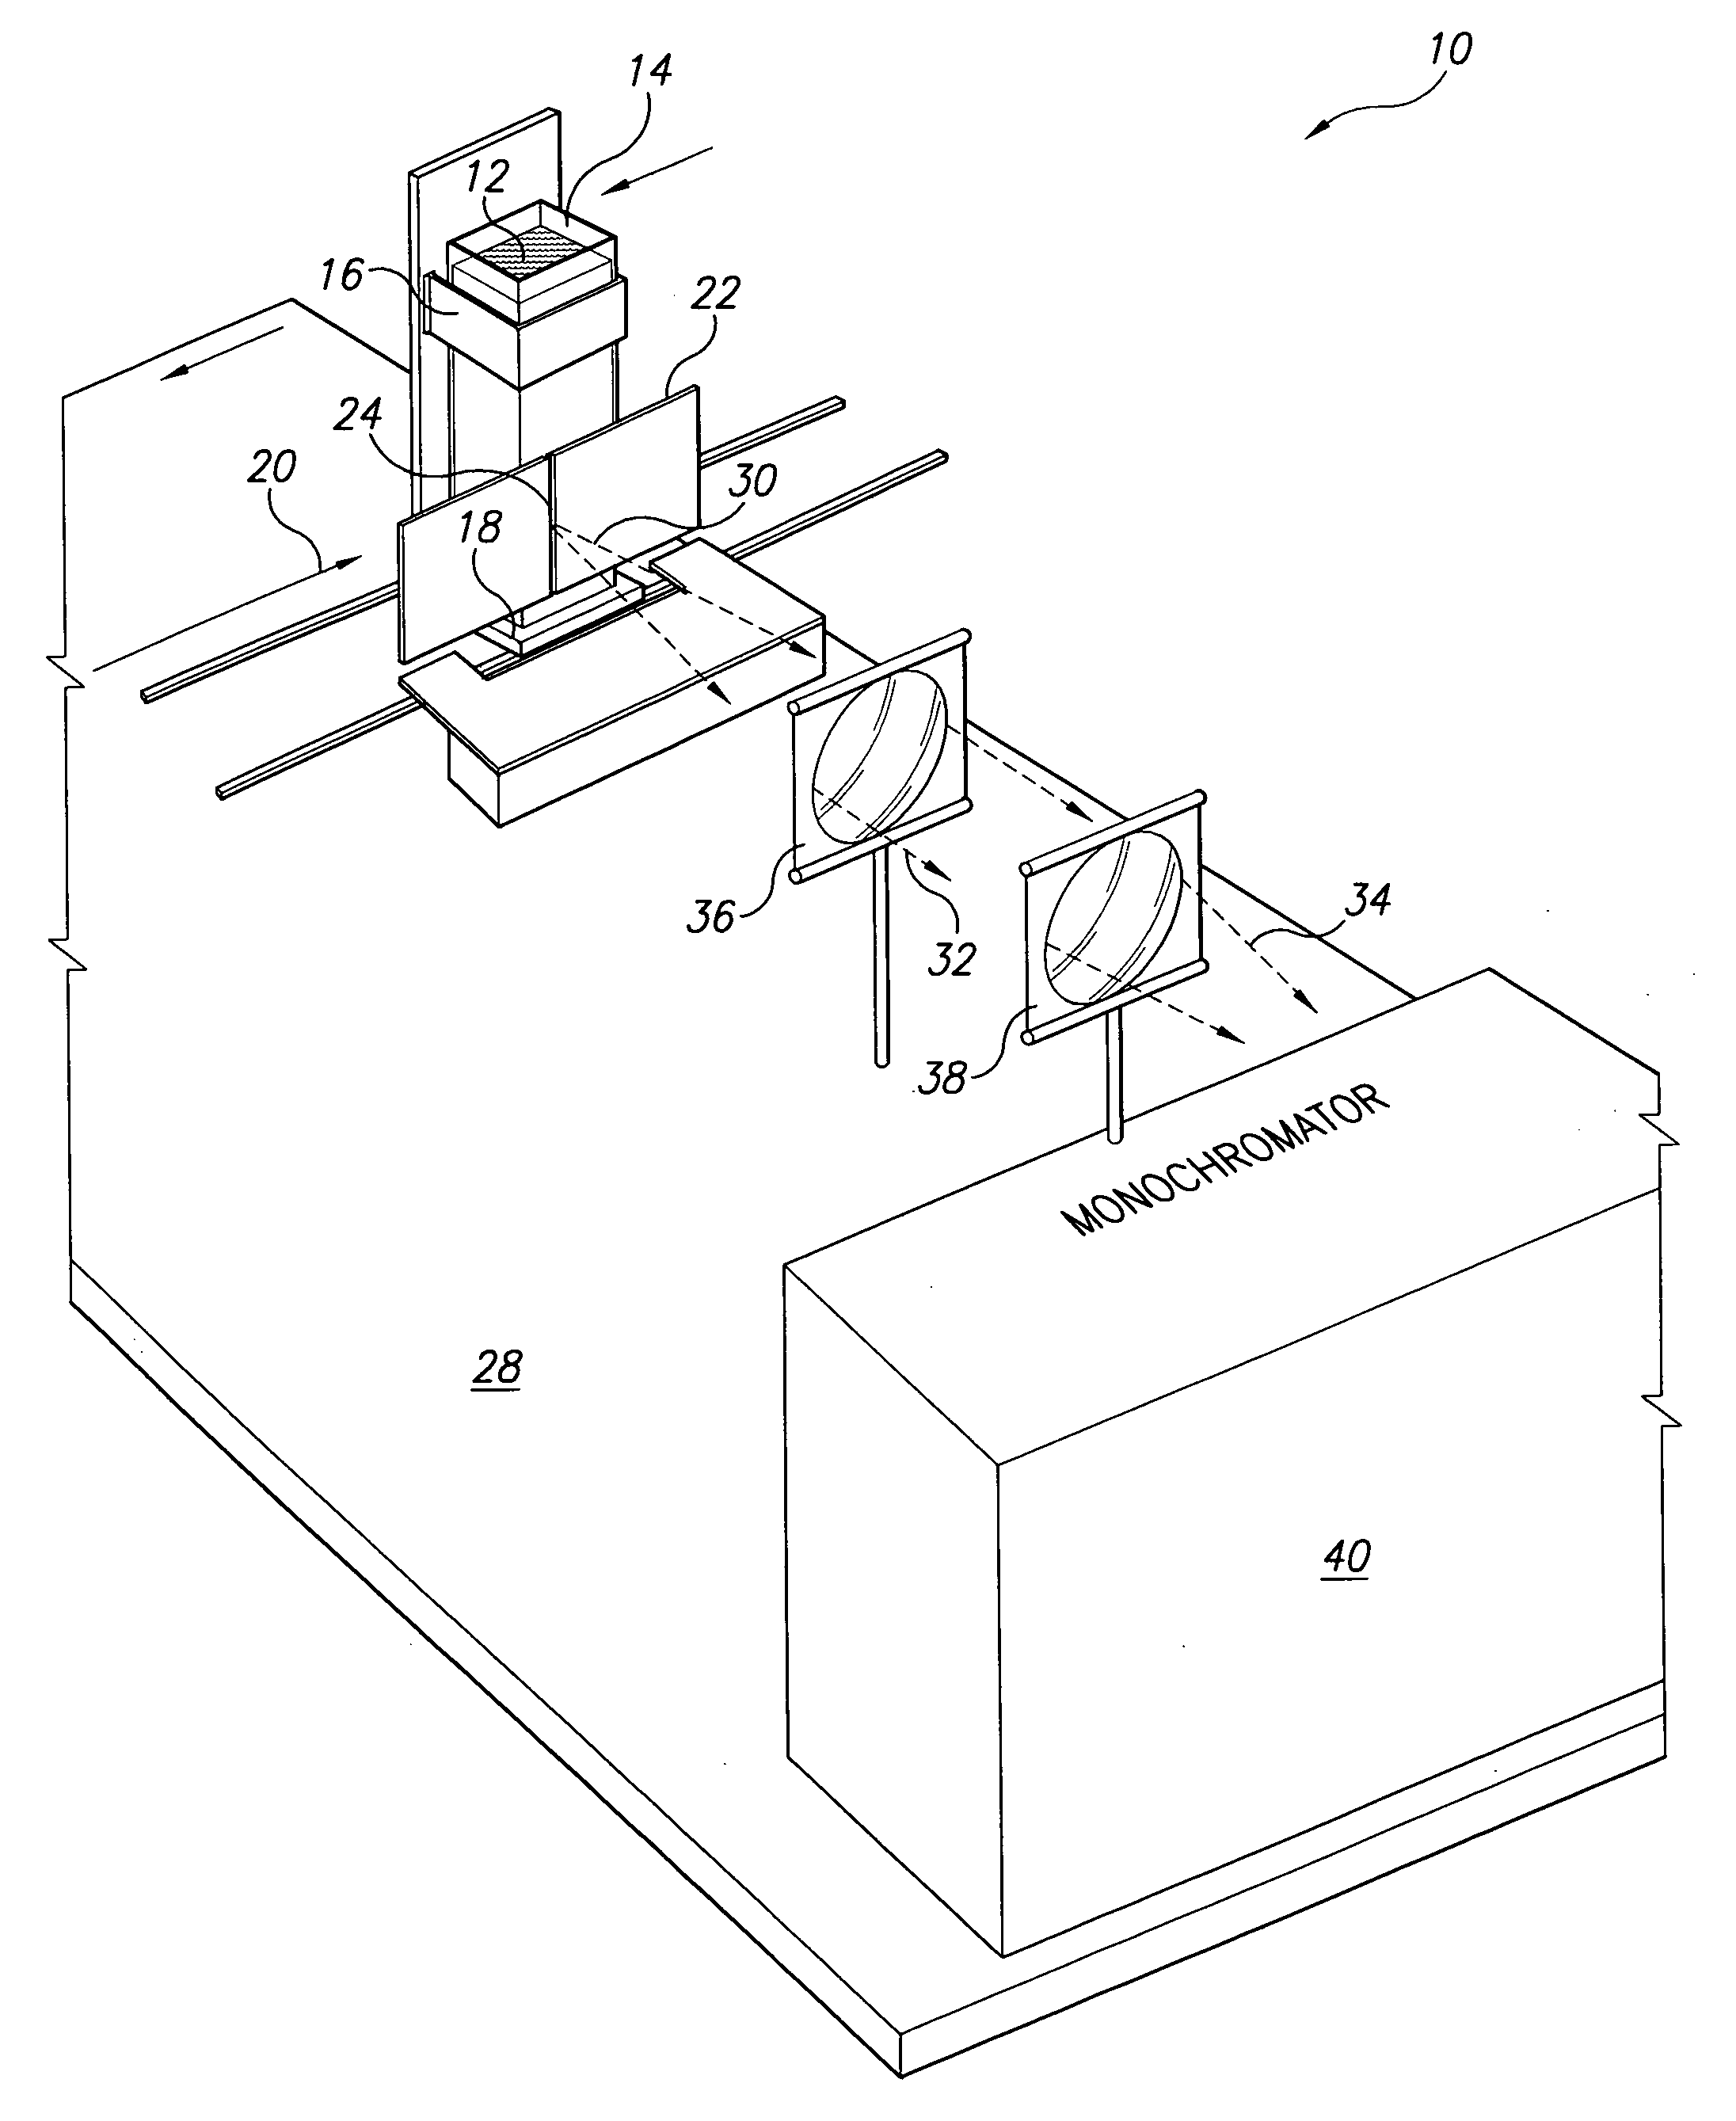
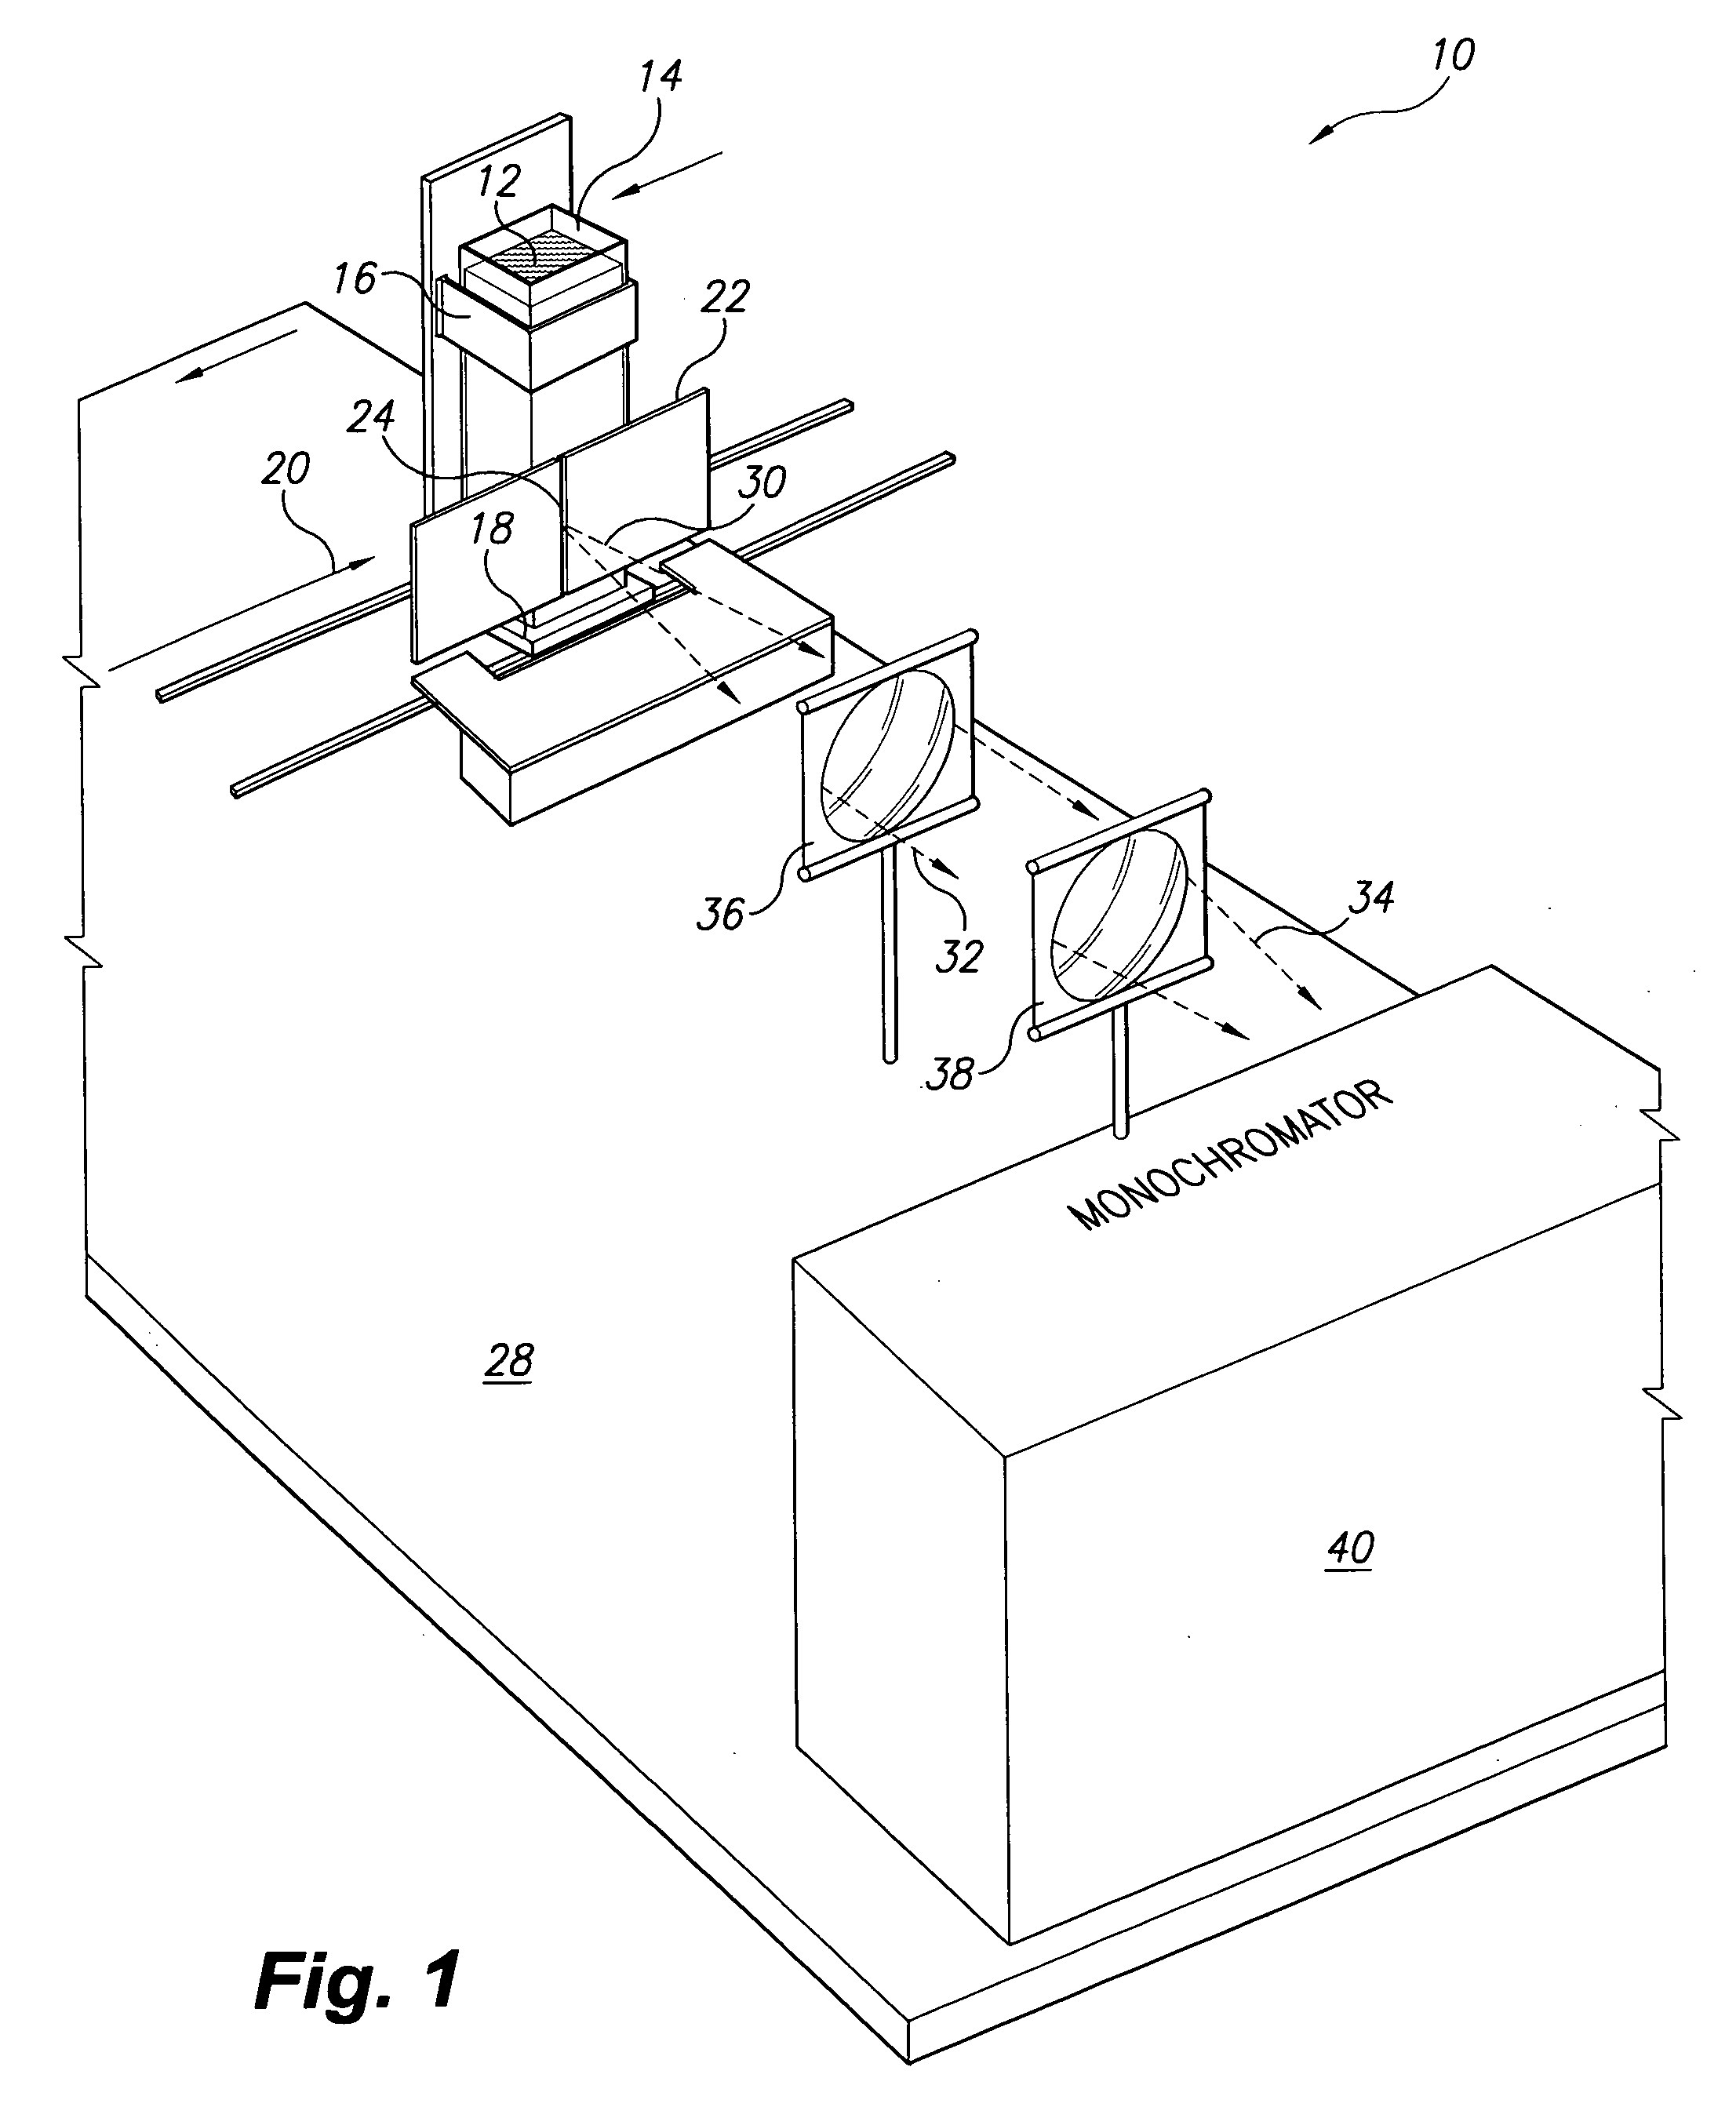
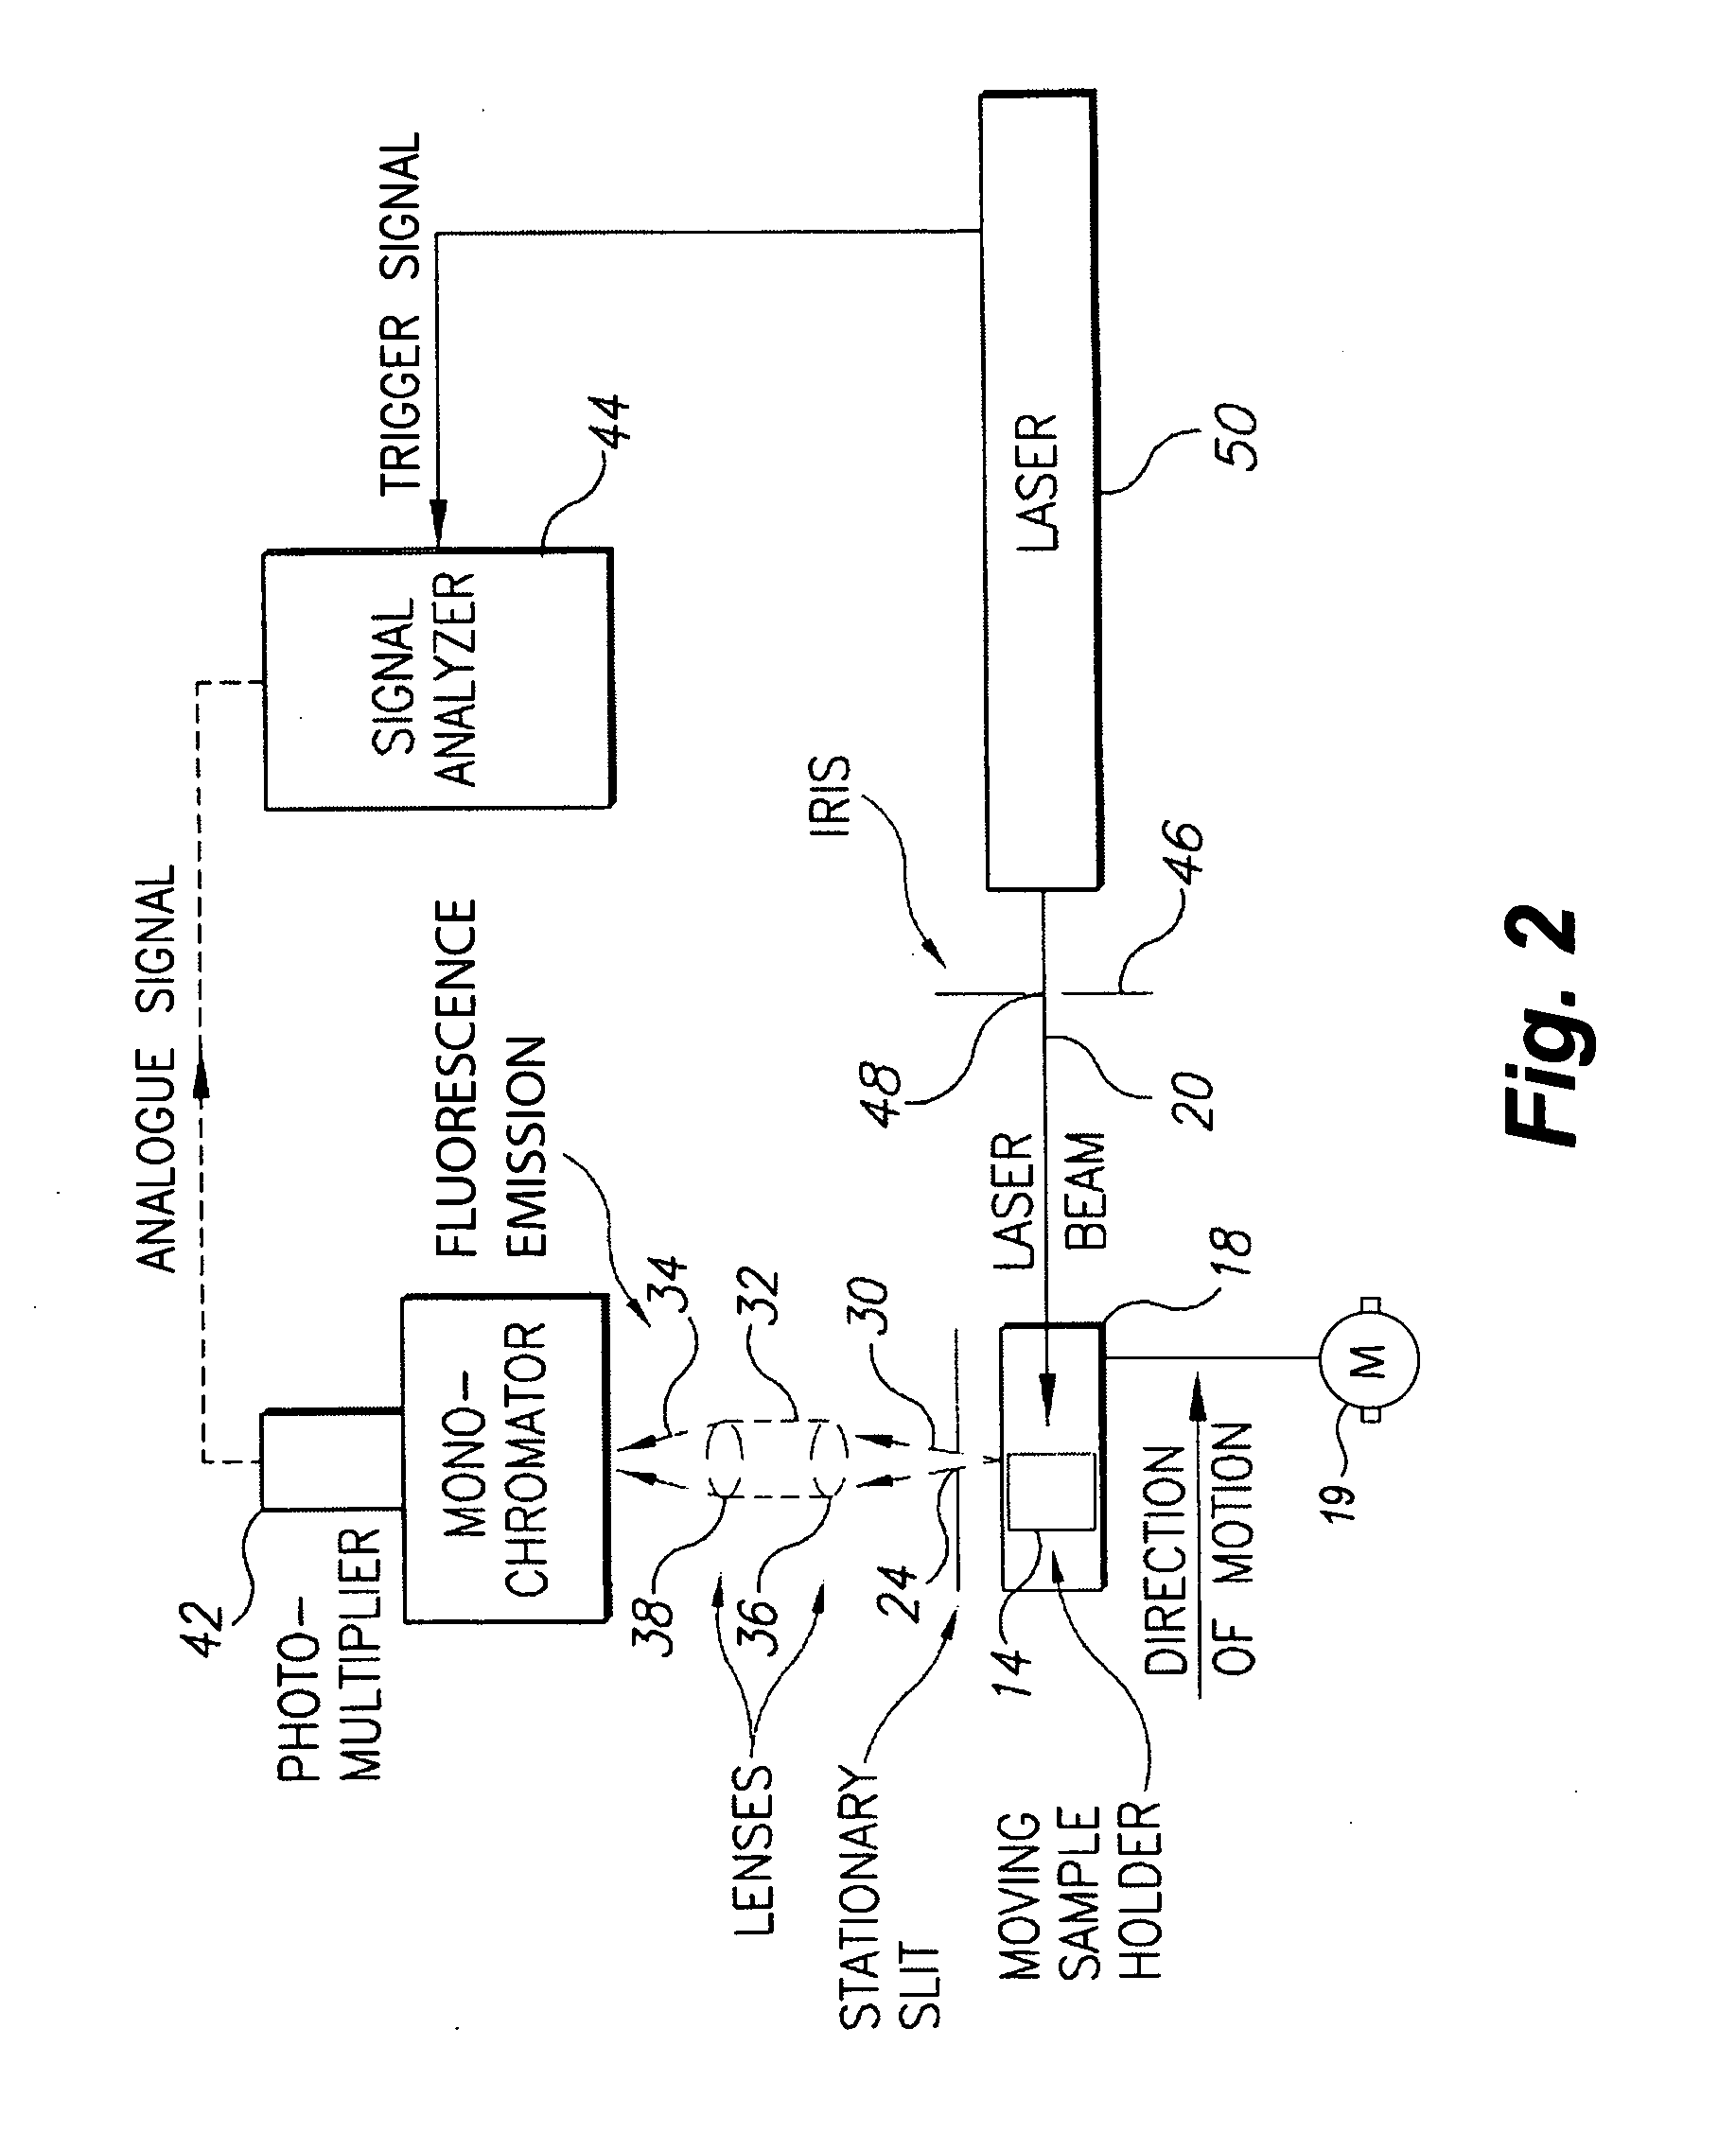
The apparatus for measuring concentrations of fuel mixtures using depth-resolved laser-induced fluorescence is a fluorometer equipped with a sample container holder that is movable in the path of the beam from the light source. Fluorescent emissions from the sample mixture pass at 90° to the excitation light path through a slit that is narrow enough that the emission intensity is effectively produced by a thin layer of the sample and focused on a monochromator, with successive thin layers receiving nonuniform excitation radiation due to reduction of intensity along the excitation light source path with increasing depth penetration and due to reabsorption of emitted fluorescence from adjacent layers. The method has a first mode in which the emission spectrum is scanned at a fixed depth, and a second mode in which the sample is moved relative to the emission monochromator slit to vary the depth while keeping the emission wavelength fixed.

Description

BACKGROUND OF THE INVENTION[0001]1. Field of the Invention[0002]The present invention relates to fluorescent spectroscopy devices and to methods for quantifying the concentration of components in a mixture of petroleum products, and particularly to an apparatus and method for measuring concentrations of fuel mixtures using depth-resolved laser-induced fluorescence.[0003]2. Description of the Related Art[0004]Fluorescent spectroscopy is a tool that has been used for the qualitative and quantitative analysis of compounds that exhibit the phenomena of fluorescence and phosphorescence. When molecules are irradiated by energy of a particular frequency or wavelength, the electrons experience a transition from the ground state to an excited state due to the absorbance of photons. The electrons return to the ground state by any of several different routes known as deactivation processes. The preferred route is the path that provides the shortest lifetime in the excited state. For certain co...

Claims


Application Information

Patent Timeline
Patent Type & Authority Applications(United States)
IPC IPC(8): G01J3/30
CPCG01N21/6402G01N21/645G01N2021/6421G01N33/2829G01N21/6456
Inventor HEGAZI, EZZAT M.
Owner KING FAHD UNIVERSITY OF PETROLEUM AND MINERALS
Learn More