Time-Space Varying Spectra for Seismic Processing

a time-space varying spectra and seismic processing technology, applied in the field of single-or-multi-channel nonstationary waveform processing, can solve the problems of uneven time delay in the alignment of reflected signals from trace to trace, poor frequency resolution of fft of short duration (“window”) signals, and varies time delay between coherent signals. , to achieve the effect of poor frequency resolution, poor frequency resolution, and reduced gibbs side lobes

Inactive Publication Date: 2009-11-26
PRIME GEOSCI CORP
View PDF18 Cites 63 Cited by
  • Summary
  • Abstract
  • Description
  • Claims
  • Application Information

AI Technical Summary

Benefits of technology

[0025]Four methods exemplify such prior art methods. The first method is the Short Time Fourier Transform “STFT”. It segments data by multiplying the time signal with a finite length box car window then computes the FFT. The amplitude and phase spectra are assigned to the center of the time window. The process repeats as the window translates in time with a fixed step size. Partyka, et al., in U.S. Pat. No. 6,131,071 (October, 2000) entitled Spectral Decomposition for Seismic Interpretation apply the method to a set of seismic traces to visualize tuning effects produced by wavelet interference from the top and bottom interfaces of a thin geological layer. The advantage of the method is that you can reconstruct the original signal from its FFT components without information loss and repeatedly apply FFT to its coefficients as if it was the original input. The disadvantage is that the method has poor frequency resolution and produces high magnitude Gibbs side lobes.
[0026]Vassiliou, A. A., and P. Garossino in U.S. Pat. No. 5,850,622 (December, 1998) entitled Time-Frequency Processing and Analysis of Seismic Data using Very Short-Time Fourier Transforms discloses applying a Gaussian tapered window instead of the box car. The advantage is that Gibbs side lobes are much reduced in comparison with box car STFT. The disadvantage is that energy in the spectrum is no longer monochromatic but smeared over a band of frequencies.
[0027]The second method is known as Wigner Distribution (Hlawatsch

Problems solved by technology

Consequently, the trace-to-trace time delay between coherent signals varies with time.
This causes uneven time delays in the alignment of reflected signals from trace to trace.
A further complication arises from surface waves that are dispersive, that is different frequencies travel with different speeds.
The FFT of short duration (“window”) signals, however, has poor frequency resolution.
As stated earlier, a disadvantage of FFT is its inability to compute with arbitrarily high frequency resolution the spectrum from a finite time window of the signal.
However, none of these methods satisfy all five advantages of FFT.
They are limited in their scope of applications as a result.
The disadvantage is that the method has poor frequency resolution and produces high magnitude Gibbs side lobes.
The disadvantage is that energy in the spectrum is no longer monochromatic but smeared over a band of frequencies.
A disadvantage of the method is that it produces only the power spectrum and not the phase spectrum.
Consequently the method cannot uniquely reconstruct the original signal from only the amplitude spectrum.
A second disadvantage with this method is that when there is any overlap between frequency bands at different times Wigner Distribution produces “cross-term” hashed response in the time-frequency plane.
First, its resolution is not uniform over the entire time-frequency plane.
Second, since the ‘scale’ coefficients are not equivalent of FT coefficients it is difficult to use them in many FT based signal processing applications.
Five disadvantages of the method are that (a) the wavelet decomposition is non-unique, (b) wavelets in the dictionary are not orthogonal, (c) redundant wavelet set makes computing expensive, (d) selection of a wavelet dictionary is subjective, and (e) signal reconstruction has information loss.
In summary, prior art methods for time-varying spectral analysis provide time-frequency resolution trade-offs that suit specific applications but lack the versatility of FFT.
Wavelet Transform produces non-uniform frequency spacing.
Furthermore, it is inefficient because it requires cross-correlation with a large redundant set of wavelets.
None of the four methods suit the broad range of applications that in addition to time-frequency resolution require lossless inversion,
The disadvantage is that the method produces noisy horizons.
A disadvantage is that they are not continuous in time and certain subtle discontinuities that are vertically continuous may be missed.
The method, however, gives false results in areas of steep dips and noise.
Further, it suffers

Method used


Image

  • Time-Space Varying Spectra for Seismic Processing
  • Time-Space Varying Spectra for Seismic Processing
  • Time-Space Varying Spectra for Seismic Processing

Examples


Embodiment Construction

A—Time-Frequency Spectra

[0077]While prior-art methods of spectral analysis manipulate a short data window to obtain a spectrum, the method of this invention “un-windows” the short window then performs standard fast Fourier transform (“FFT”) on the data. The key concept of the invention is to extrapolate the portion of the signal in the short window into a signal spread over a longer window. In doing so, a continuity relationship among data within and outside of the short window is used. Consequently, the long-window comprises original data present in the short-window plus its extrapolation that is not a tapered version of the original data in the long-window. However, the extrapolation depends on the continuity model and its parameters. Different choices of the model and the parameters will produce different FFT outputs. As a result, the method of this invention produces a FFT estimate and not the exact FFT, which as stated in the Background section will have poor frequency resoluti...


PUM


Abstract

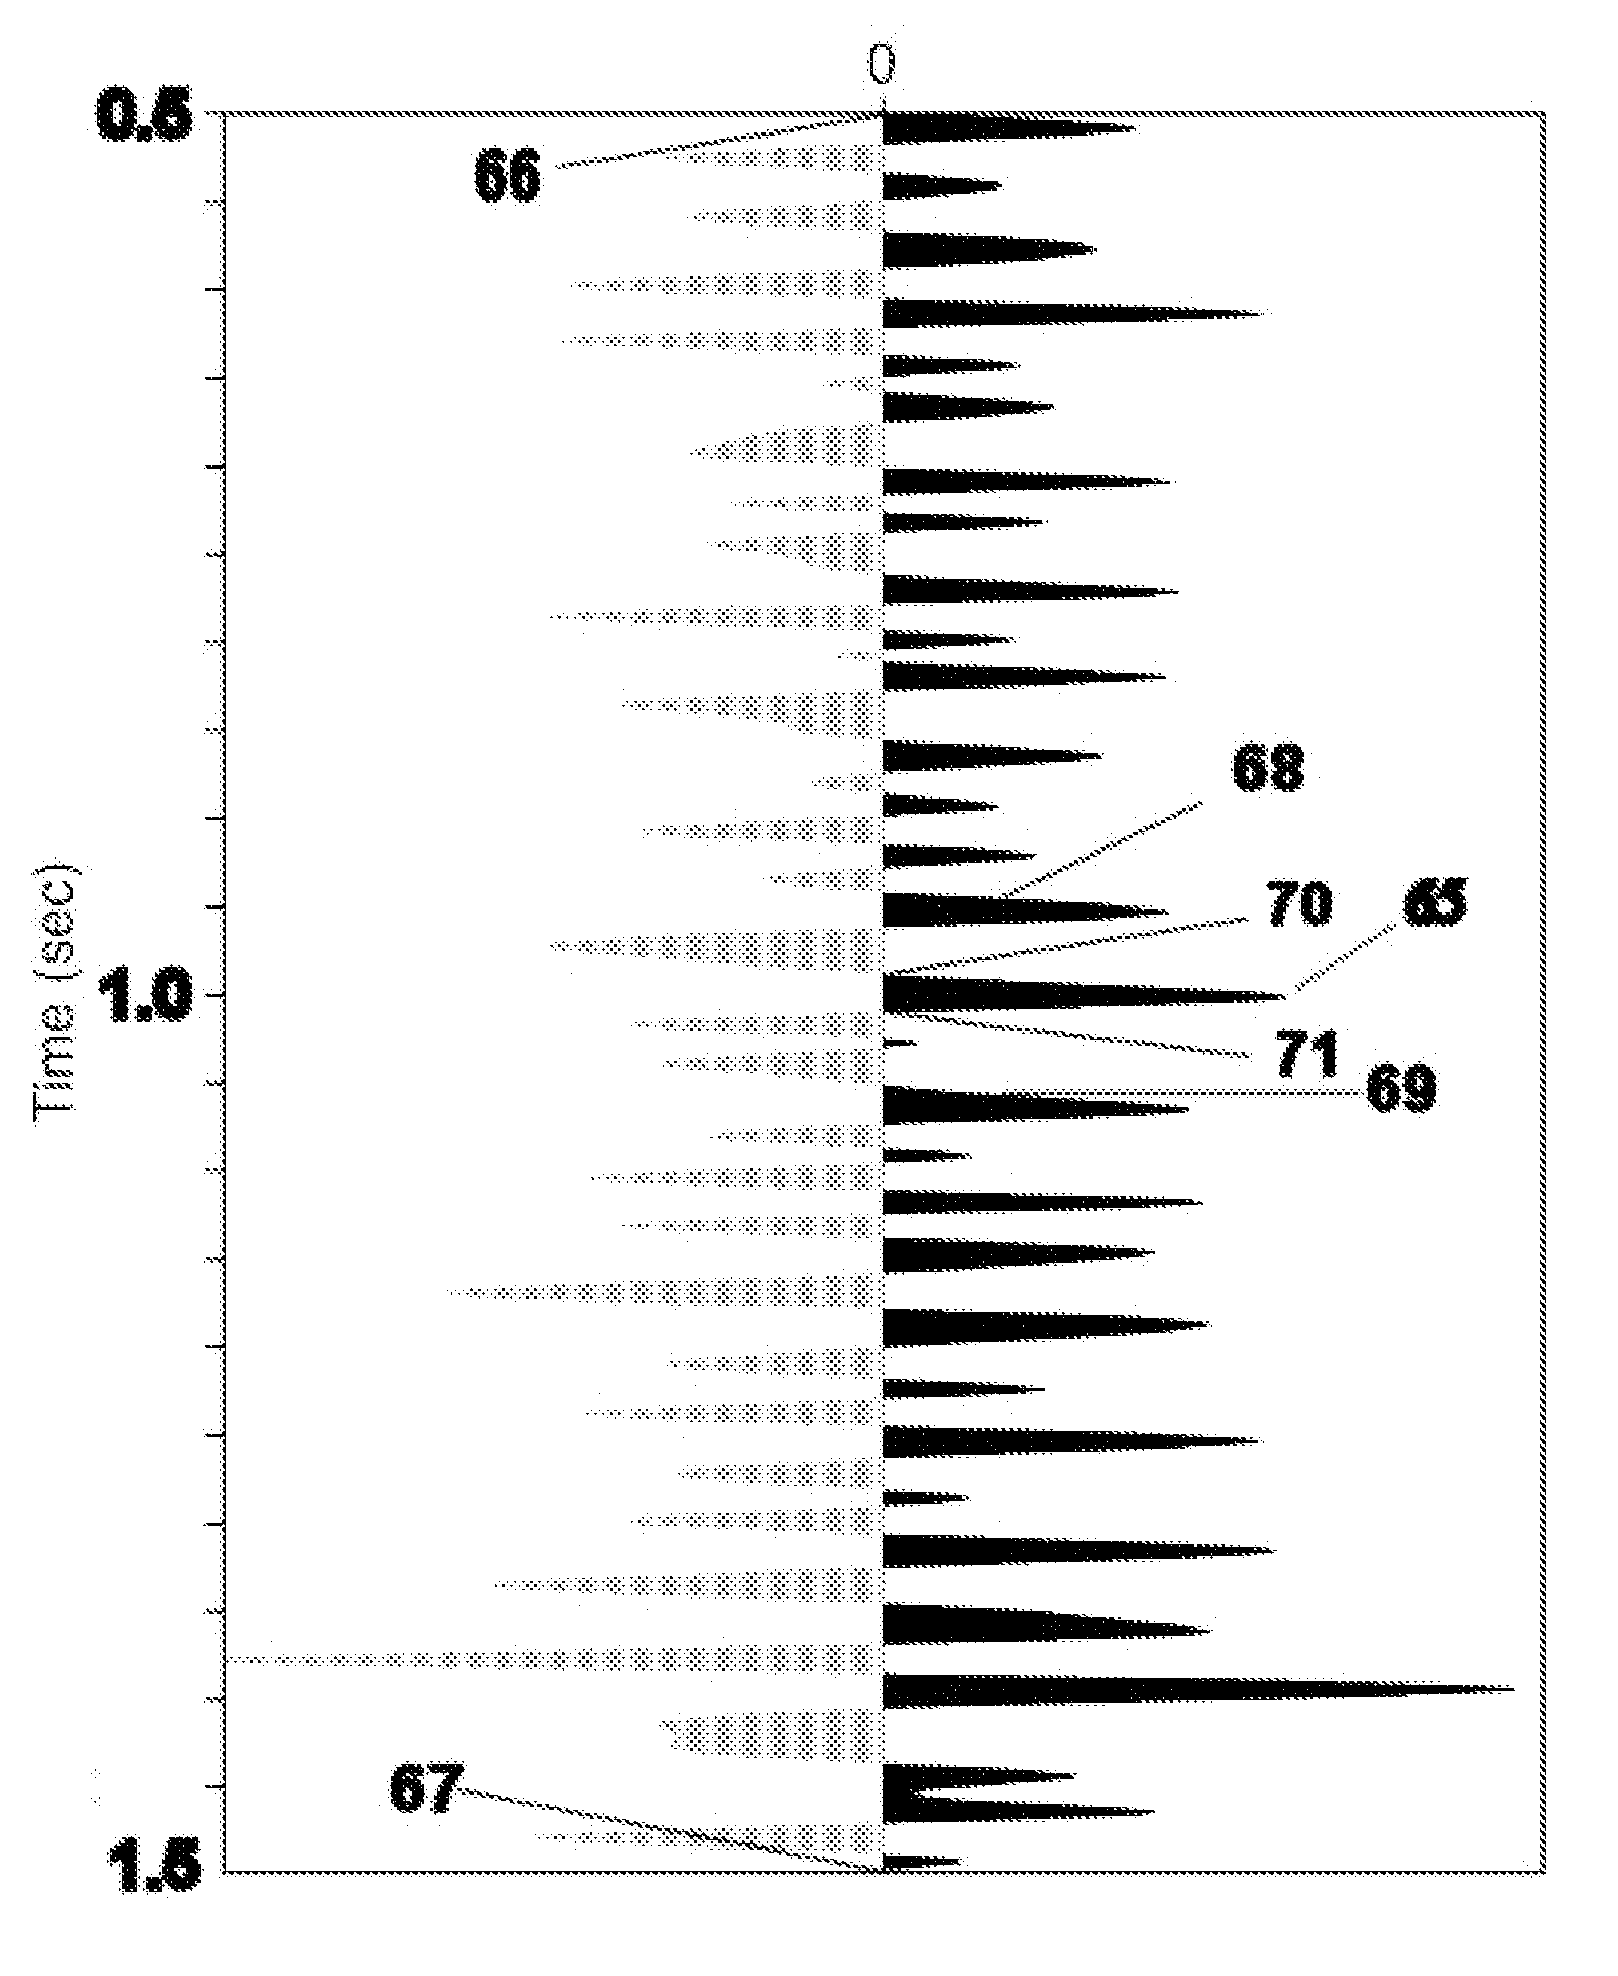
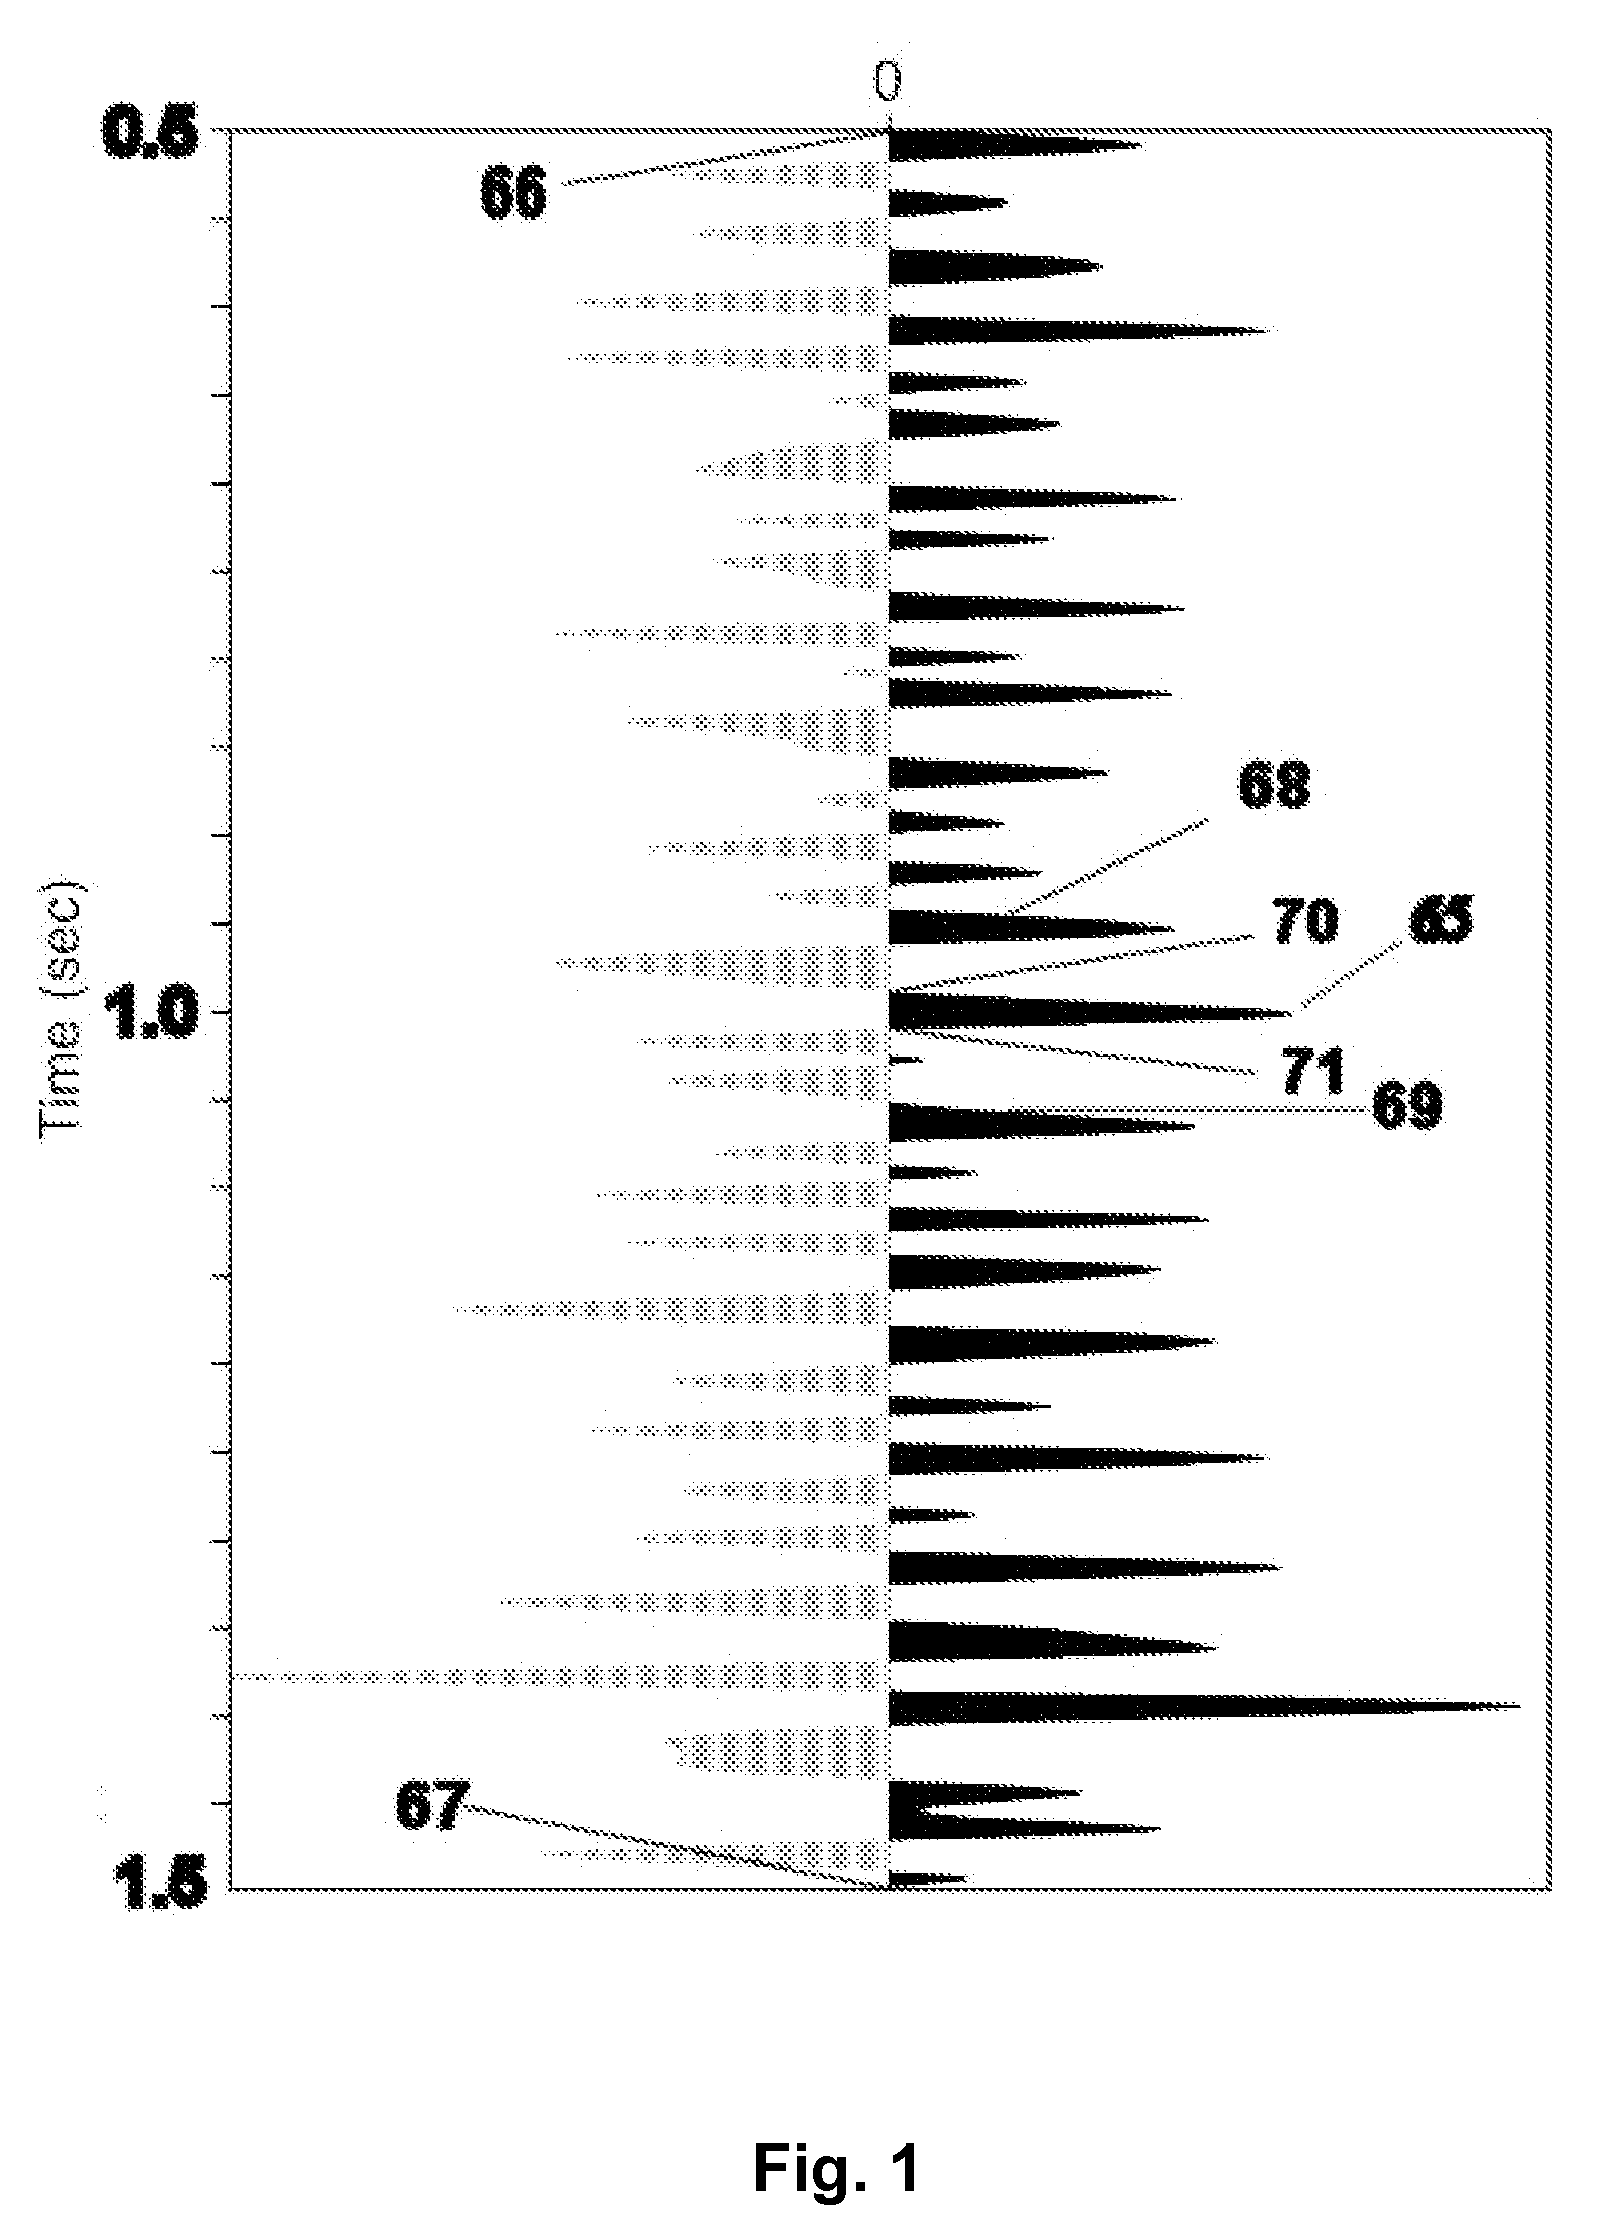
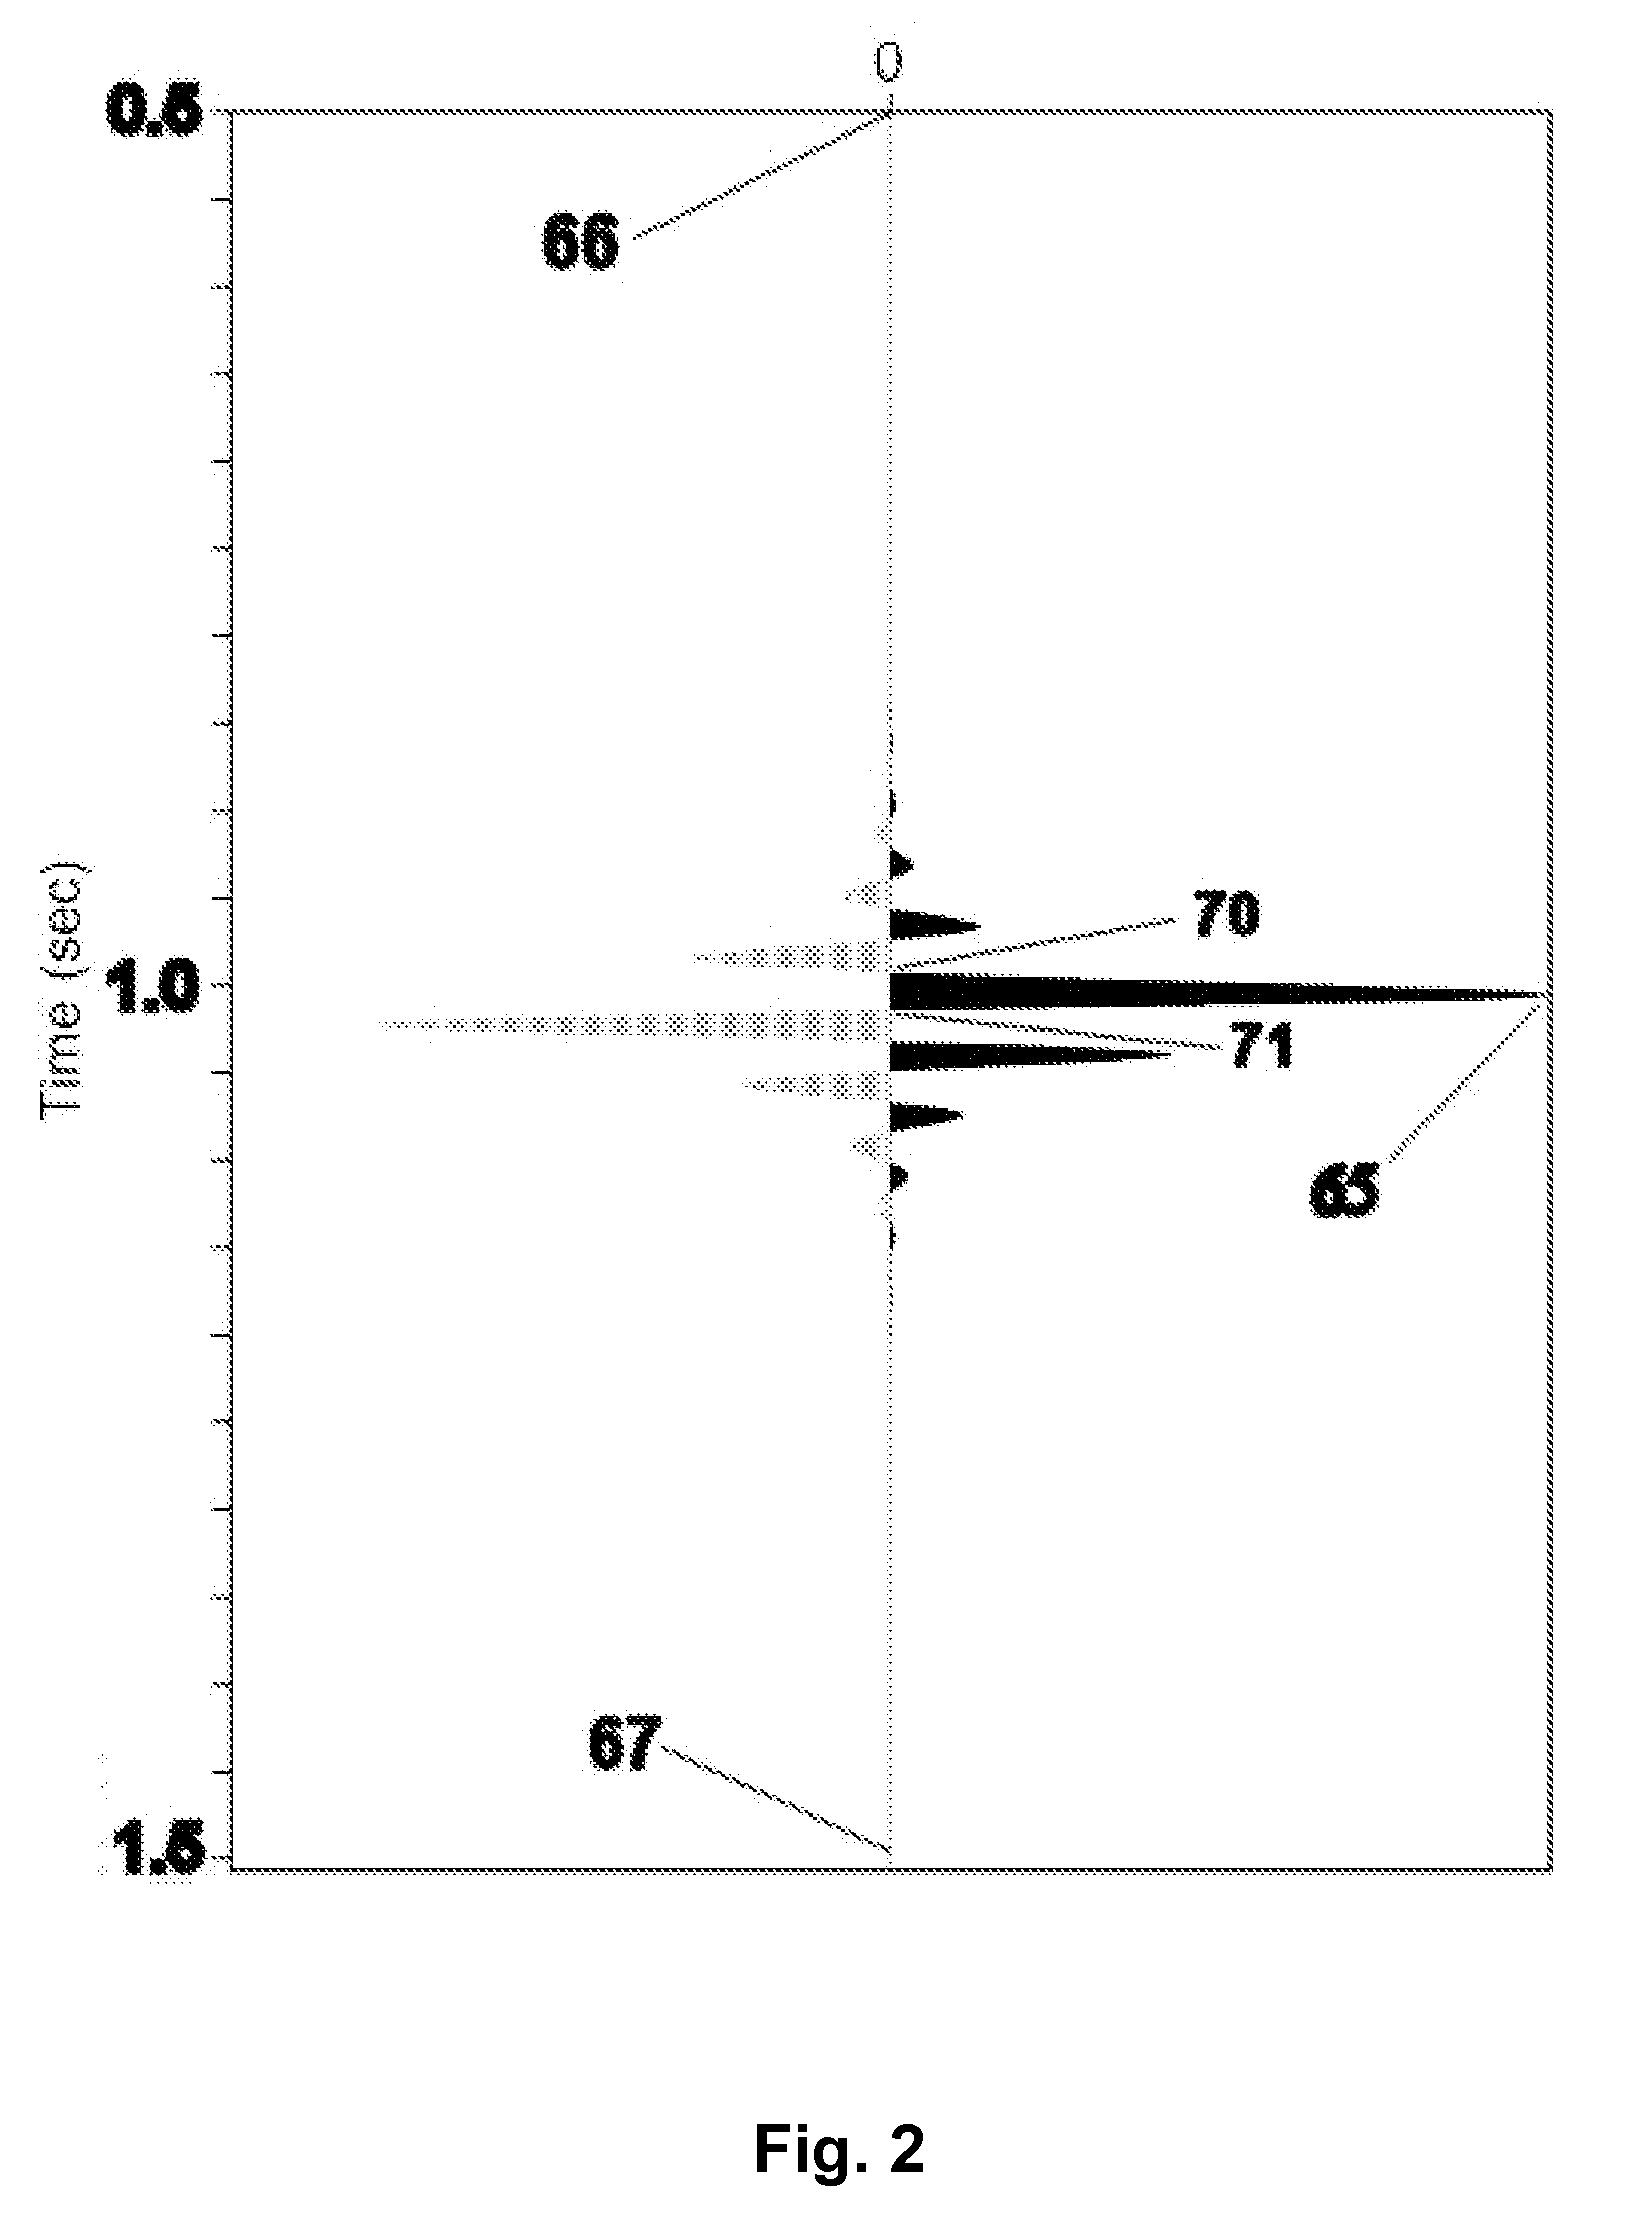
A method and visualization apparatus for spectral analysis of time-and-space varying signals enables high resolution investigation of 3D seismic data for the exploration of oil and gas. The method extrapolates multi-resolution short windows into an average long window then computes its FFT. Extrapolation uses the continuity relationship between data inside and outside of short windows. Applications of the method are illustrated with graphical screen 3D volume displays of amplitude spectra, dip and azimuth, curvature and faults (figure below). Aside from high resolution these displays improve the productivity of a seismic interpreter.

Description

CROSS REFERENCE TO RELATED APPLICATIONS[0001]Priority is claimed from U.S. Provisional Application No. 60 / 904,085 filed on May 25, 2007.STATEMENT REGARDING FEDERALLY SPONSORED RESEARCH OR DEVELOPMENT[0002]Not applicableBACKGROUND OF THE INVENTION[0003]1. Field of the Invention[0004]The invention relates generally to processing of single- or multi-channel non-stationary waveforms that occur, for example, in seismic exploration, speech, radar, sonar, radio, space communication, electron microscopy and medical remote sensing fields.[0005]In particular, methods of the invention estimate the time-space varying frequency and wavenumber spectra, time delay between signals, dispersion, attenuation, dip and azimuth, curvature and higher-order reflection surfaces, and faults from signals in a 3D seismic volume. Further, this invention includes an apparatus to visualize and interpret results produced by the estimation methods.[0006]2. Description of the Related Art[0007]In seismic exploration ...

Claims


Application Information

Patent Timeline
IPC IPC(8): G01V1/36
CPCG01V1/36G01V1/34
Inventor ALAM, AFTABTAYLOR, JAMES D.
Owner PRIME GEOSCI CORP
Why Eureka
Try Eureka