Genetic component of complications in type 2 diabetes
- Summary
- Abstract
- Description
- Claims
- Application Information
AI Technical Summary
Benefits of technology
Problems solved by technology
Method used
Image
Examples
example 1
Geoethnic Clustering
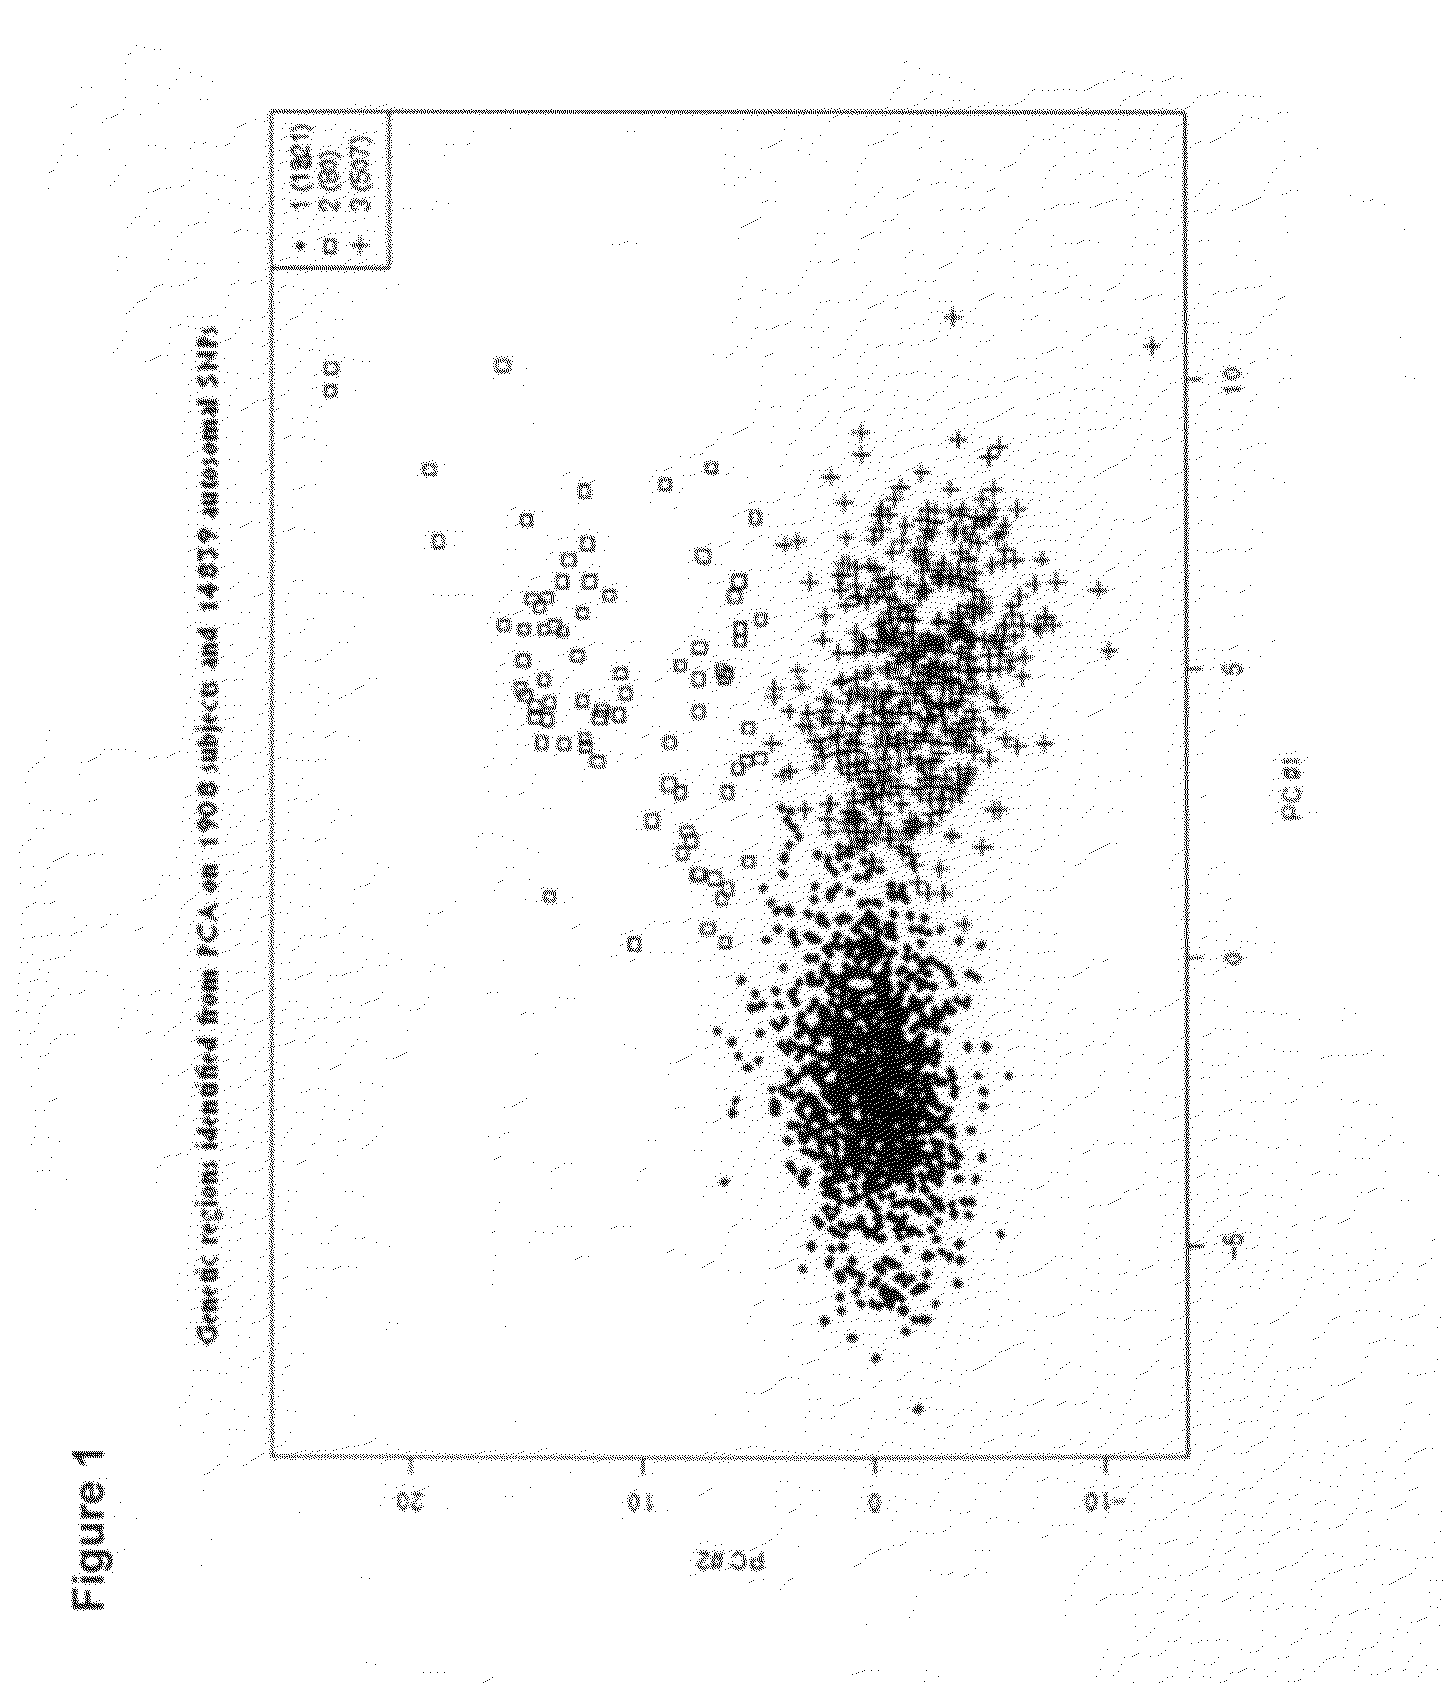
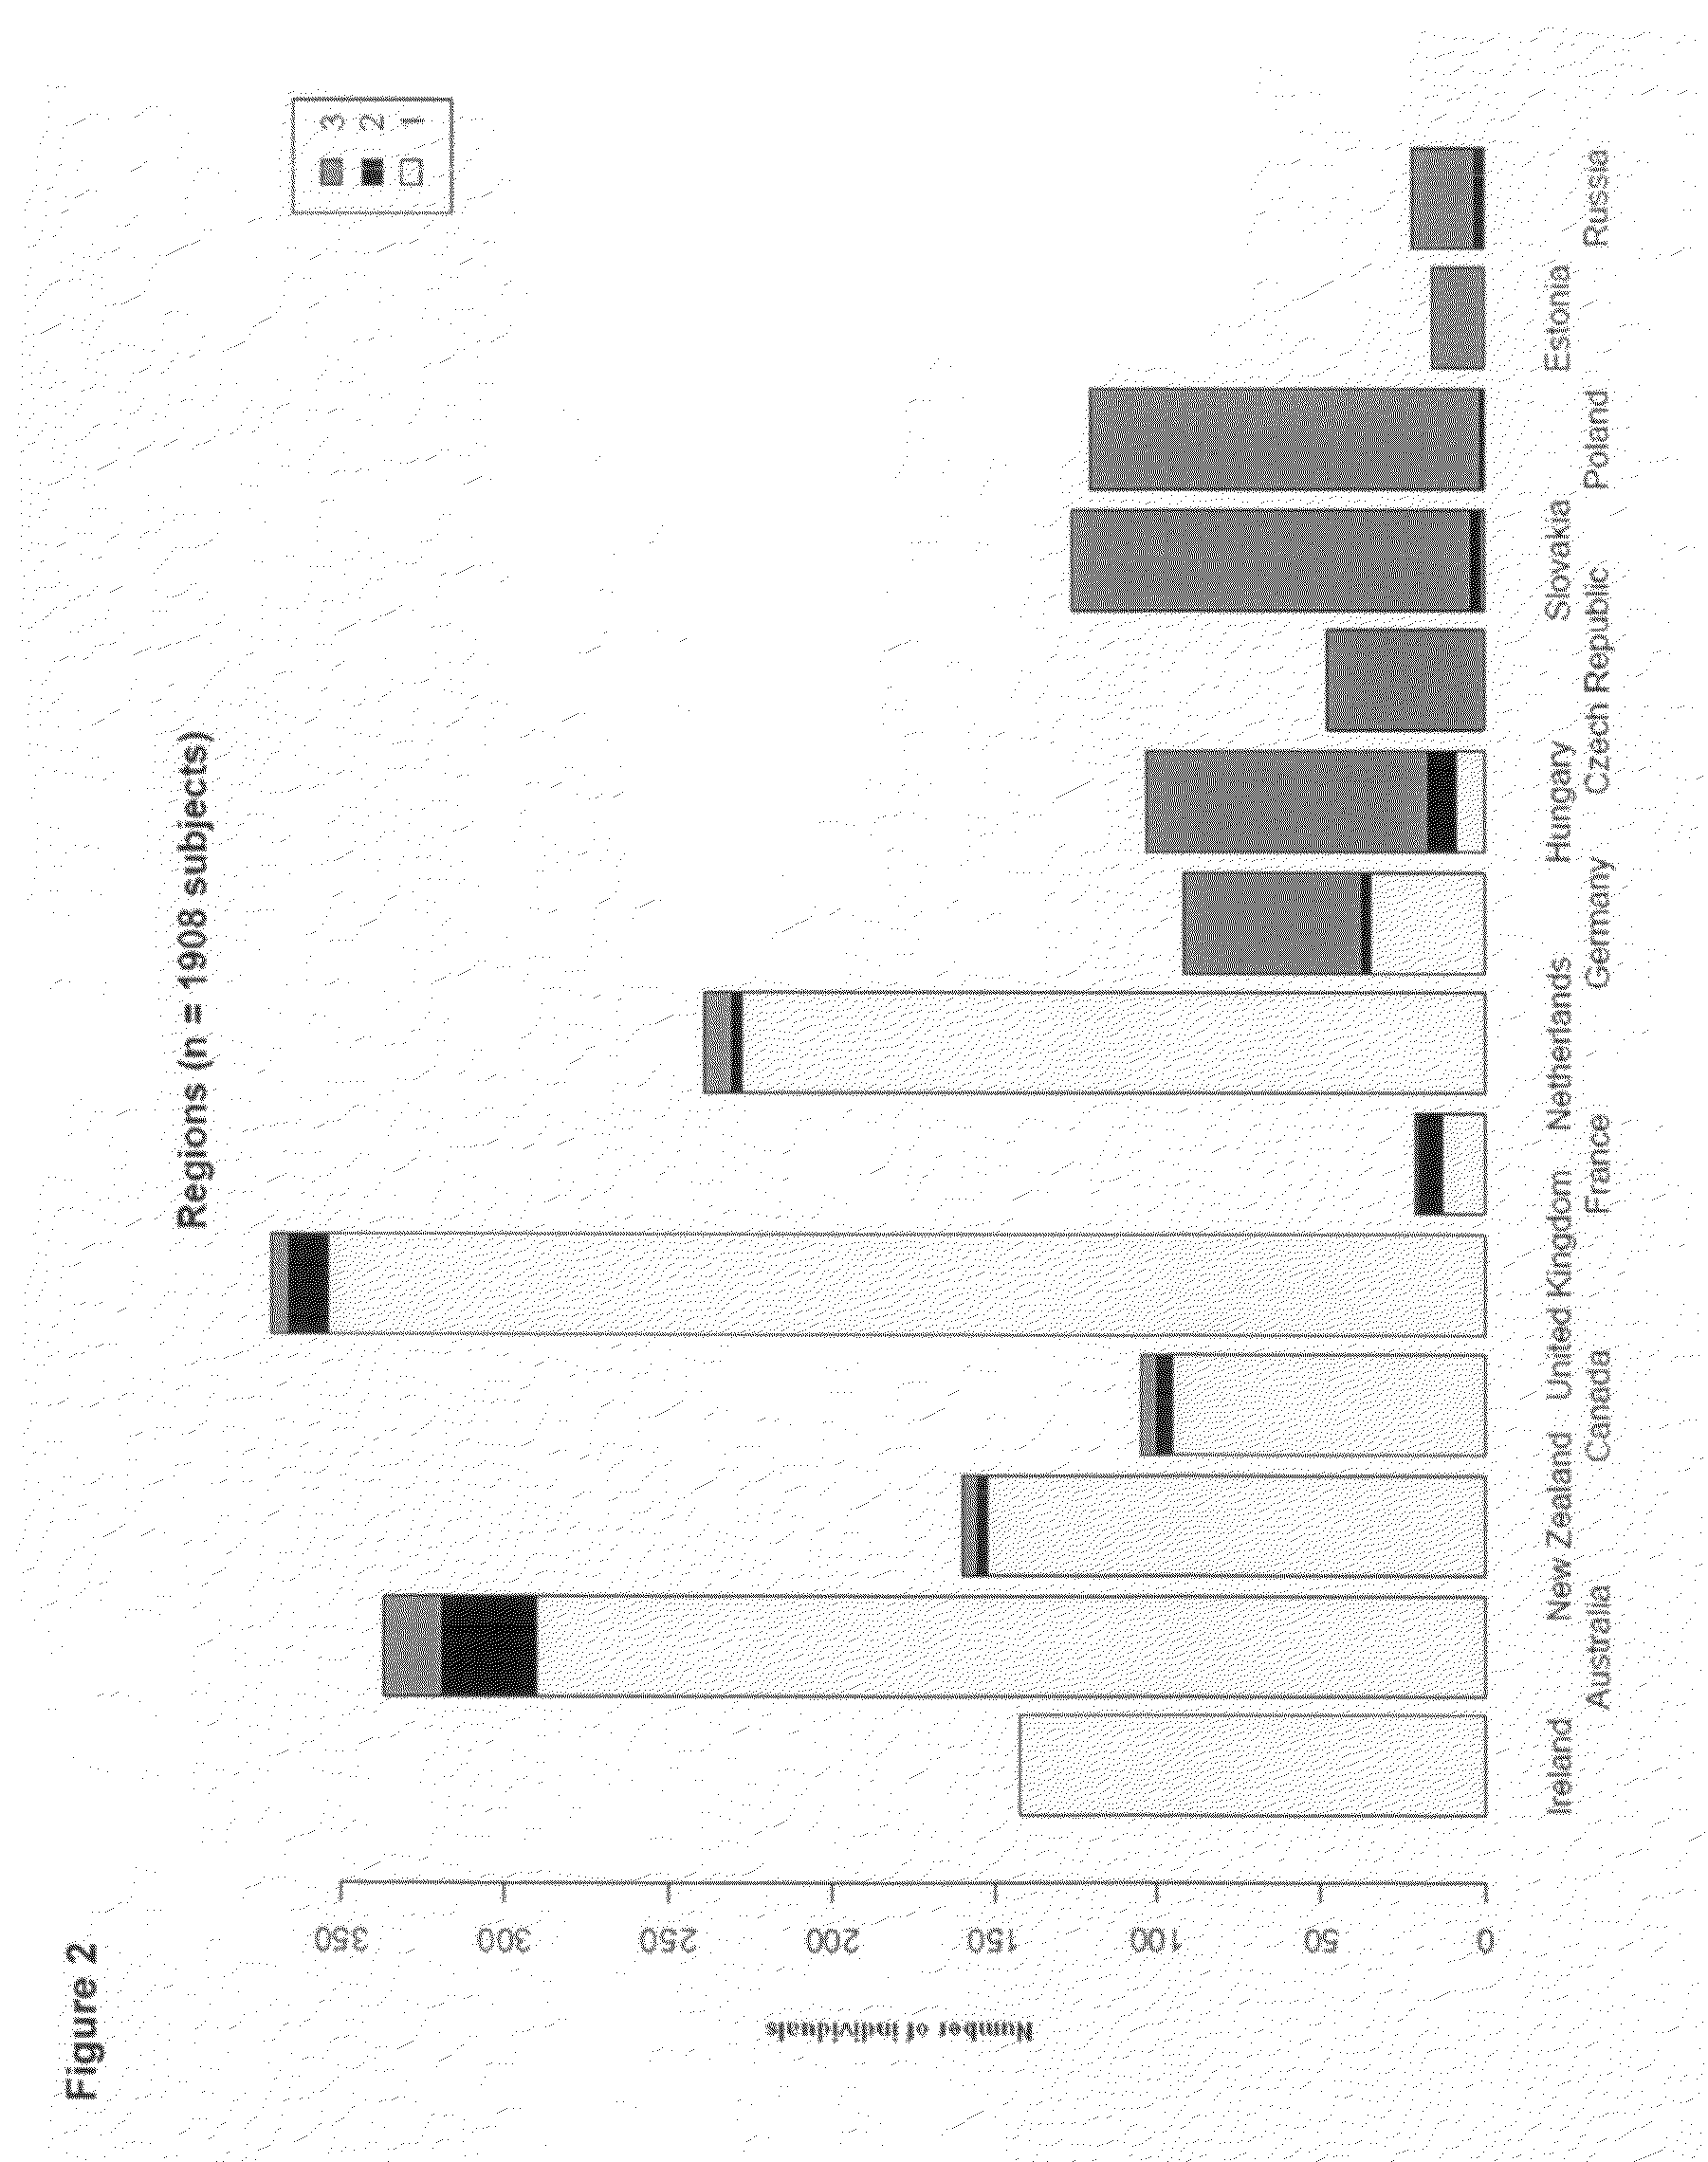
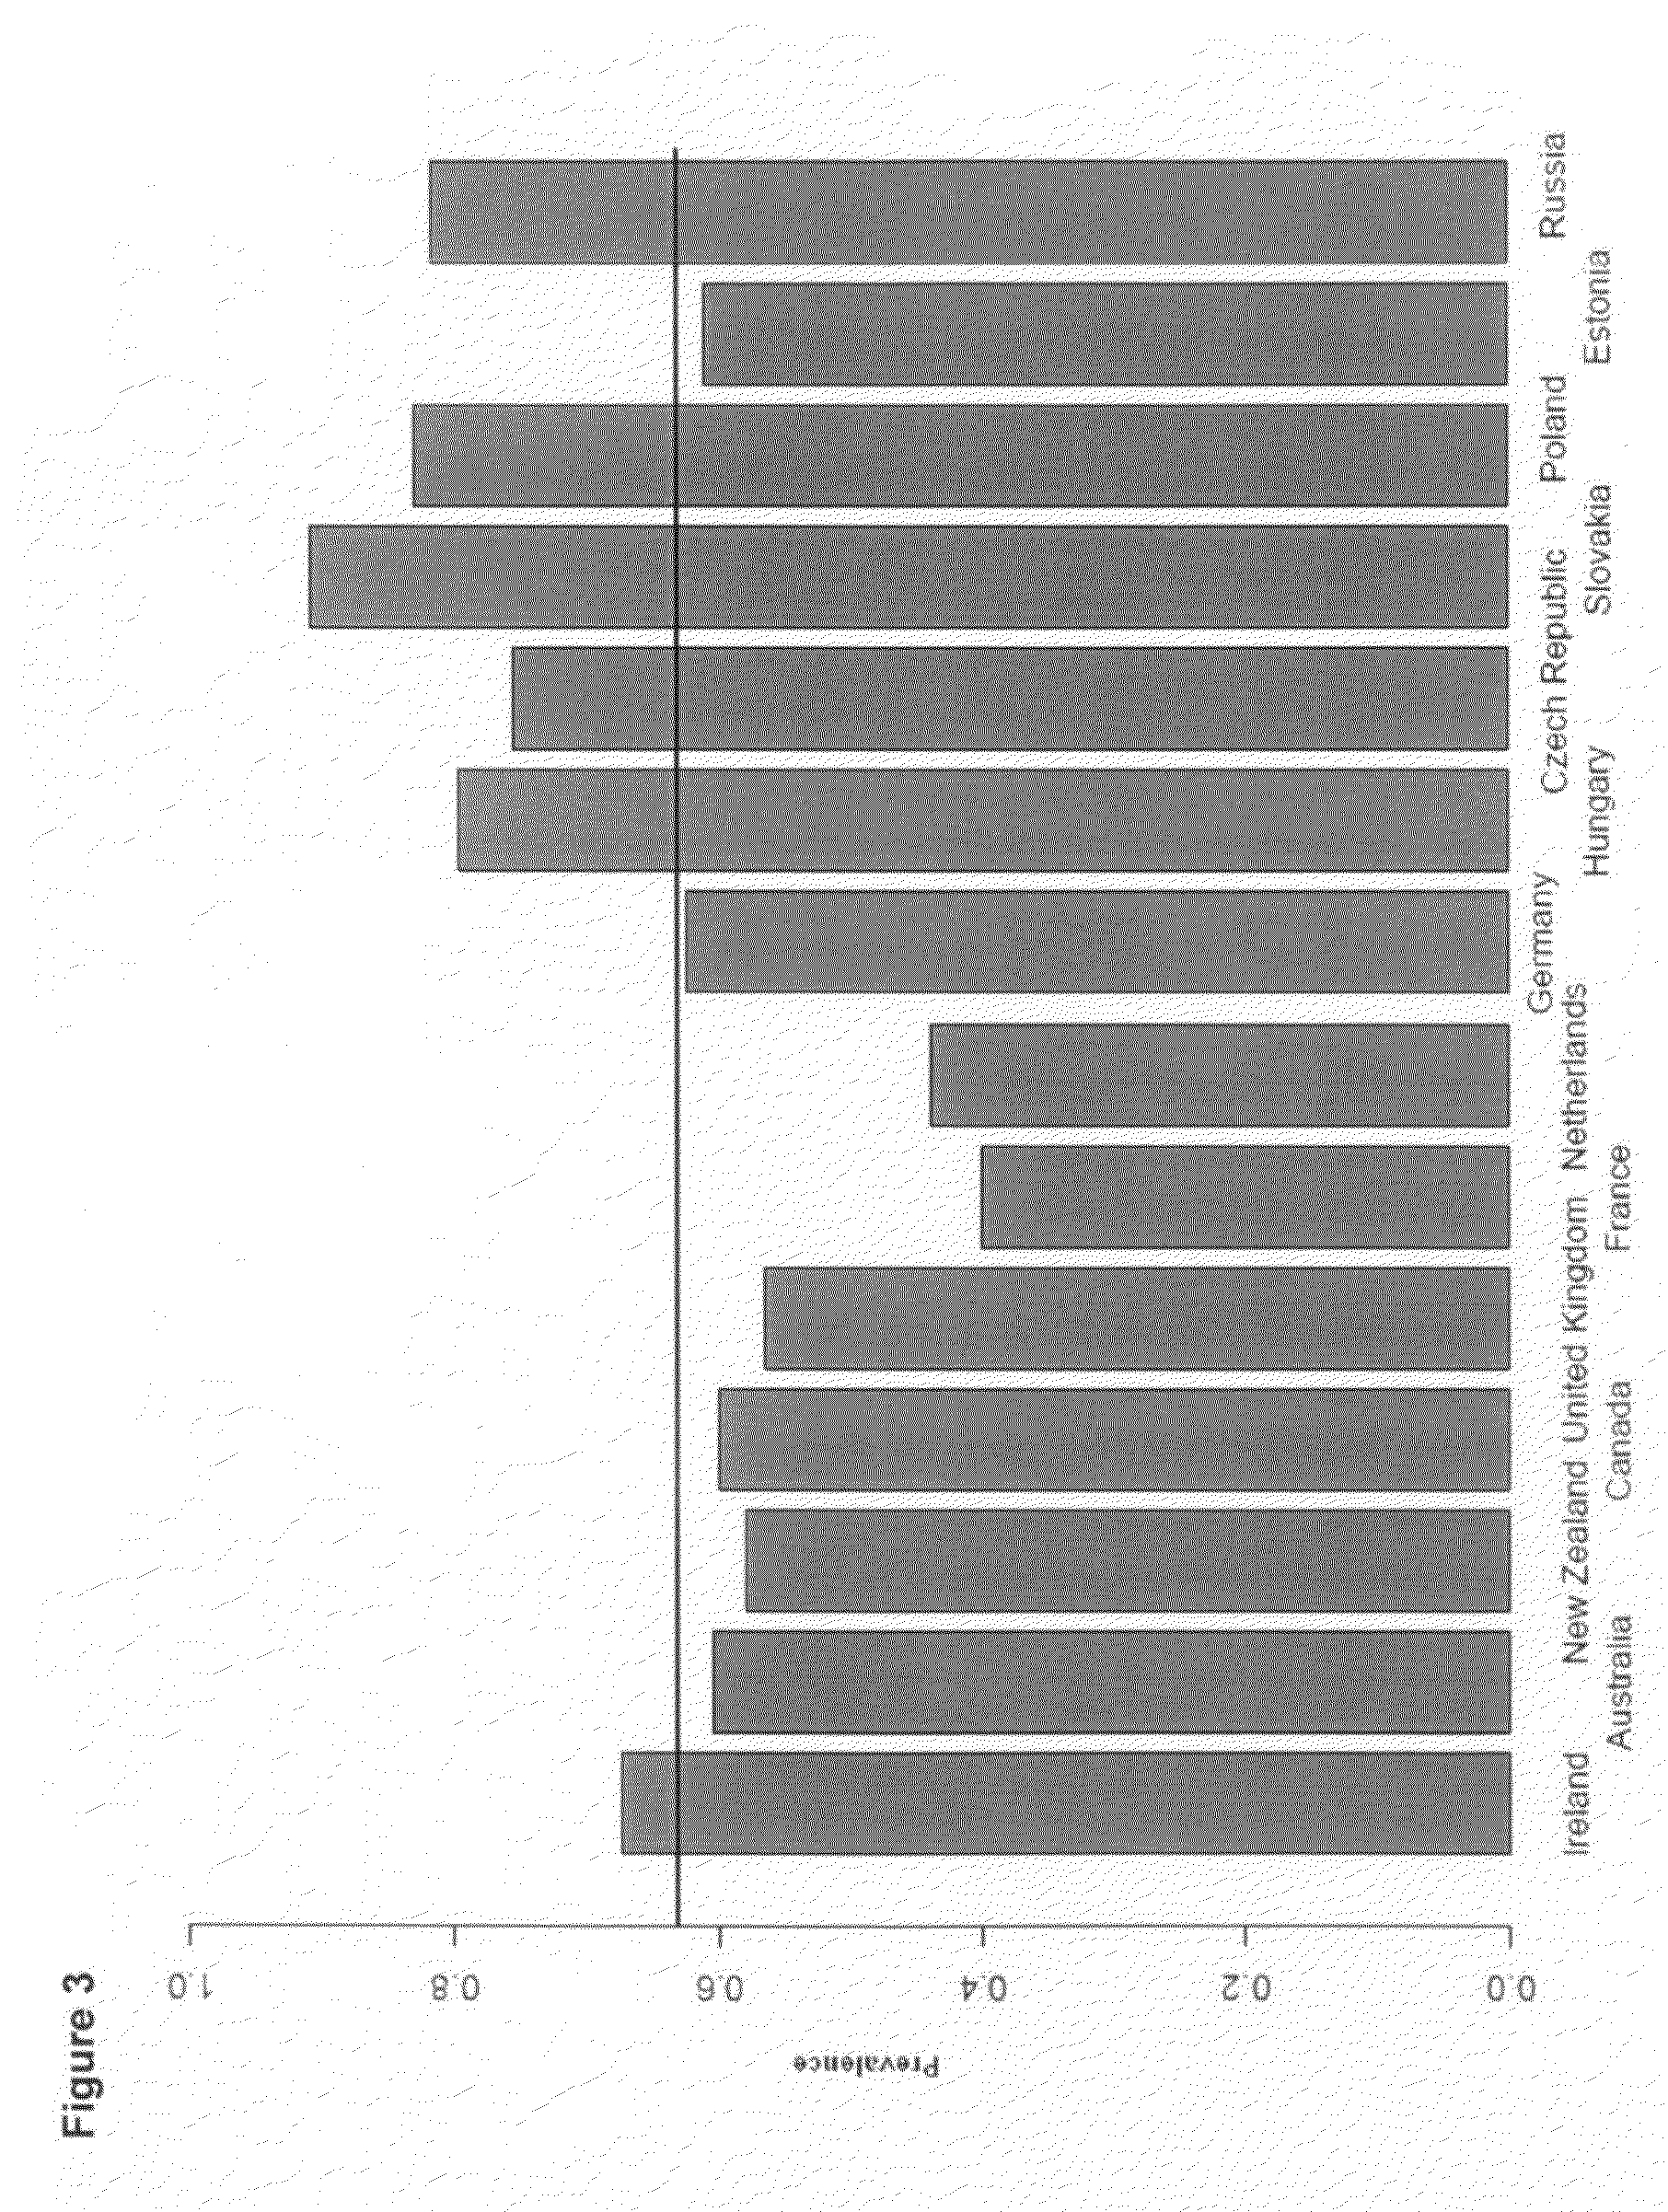
[0353]It is has been shown that we can distinguish without any overlap Caucasians, Africans and Asians. Given the density of the currently available genomic markers and the power of our study, we demonstrated that we can distinguish individuals of Caucasian origin within European populations. Our data show that using a subset of 14,961 SNPs (list in provided in Table 13) unrelated to T2D complications, we were able to cluster the individuals into three groups along the PC1 and PC2 axes (FIG. 1): Group 1 (n=1317 individuals), Group 2 (n=80) and Group 3 (n=507). The two predominant populations (Group 1 and Group 3) exhibit a west / east cline in Europe and a majority of the western type (Group 1) were found in Australia, New-Zealand and Canada (FIG. 2). It is relevant to state here that population in Eastern Europe (Group 3) present a higher prevalence of complications such as and not limited to albuminuria, hypertension, stroke and myocardial infarction (FIG. 3). Th...
example 2
Combination of SNPs
[0358]Demonstration of the predictive power of the SNP provided in tables 1, 4, 7 and 10 could be made by combining several of those SNP markers selected based on their level of association with diabetes complications and on the frequency of their risk or protective alleles in the population. Several methods are known by those skilled in the art to select appropriate markers.
[0359]Particularly preferred are combinations of biomarkers provided in tables 16 and 19.
[0360]Prediction models rely on training and testing sets or bootstrap procedures. Two different models of classification were used: logistic regression and support vector machines. Logistic regression is a well known method which models the probability of a binary variable representing the outcome of interest (event vs. non-event) as a function of quantitative and / or categorical predictors. Support vector machine searches for optimal hyperplanes that separate two classes (here cases and controls) by maxim...
example 3
Selection of Patients for Clinical Trials of T2D Drugs
[0363]Application of a classification tool in selecting patients with higher risk for T2D complications could dramatically reduce the sample size (and / or the time and cost) required to perform clinical outcome studies in T2D. In our estimations we assumed the following scenario. A randomized clinical trial with two arms is designed to test the impact of novel antidiabetic medication on the rate of cardiovascular events in T2D patients. In one arm, patients receive the usual medication (control arm) whereas, in the other arm (treatment arm), patients receive the novel antidiabetic medication in top of the usual medication. The number of samples required in both arms is such that a difference of 20% between the two arms respective annual event rates will be detected with 80% power at a fixed significance level of 5%. The trial is planned for 5 years.
[0364]FIG. 8 shows the impact of the annual event rate in the control arm on the nu...
PUM
| Property | Measurement | Unit |
|---|---|---|
| Fraction | aaaaa | aaaaa |
| Fraction | aaaaa | aaaaa |
| Fraction | aaaaa | aaaaa |
Abstract
Description
Claims
Application Information
 - R&D
- Intellectual Property
- Life Sciences
- Materials
- Tech Scout
- Unparalleled Data Quality
- Higher Quality Content
- 60% Fewer Hallucinations
Browse by: Latest US Patents, China's latest patents, Technical Efficacy Thesaurus, Application Domain, Technology Topic, Popular Technical Reports.
© 2025 PatSnap. All rights reserved.Legal|Privacy policy|Modern Slavery Act Transparency Statement|Sitemap|About US| Contact US: help@patsnap.com


