Method of forming mass image

a mass image and image technology, applied in the field of mass image formation, can solve the problems of difficult to correct local sensitivity variation, difficult to form an image appropriately reflecting,

Inactive Publication Date: 2011-12-29
CANON KK
View PDF5 Cites 12 Cited by
  • Summary
  • Abstract
  • Description
  • Claims
  • Application Information

AI Technical Summary

Benefits of technology

[0012]According to the present invention, when a two-dimensional distribution image based on information on the mass of constituents in an analyte is acquired, it is possible to obtain a signal intensity in which variations such as sensitivity difference in the case of mass spectroscopy has been corrected for each pixel. In addition, since an internal standard is selected by the region to which a pixel belongs, a more suitable internal standard is selected. Therefore, distribution of the normalized signal intensity matches the actual distribution of the constituent.

Problems solved by technology

In Japanese Patent Application Laid-Open No. 2004-037120, since an external standard material is arranged in a position away from the target constituent, it was difficult to correct a local sensitivity variation resulting from an ionization inhibiting substance such as salt and lipid locally present in a measurement range.
For this reason, it was difficult to form an image appropriately reflecting the abundance of a measurement object when a two-dimensional distribution image was formed.

Method used


Image

  • Method of forming mass image
  • Method of forming mass image
  • Method of forming mass image

Examples


example 1

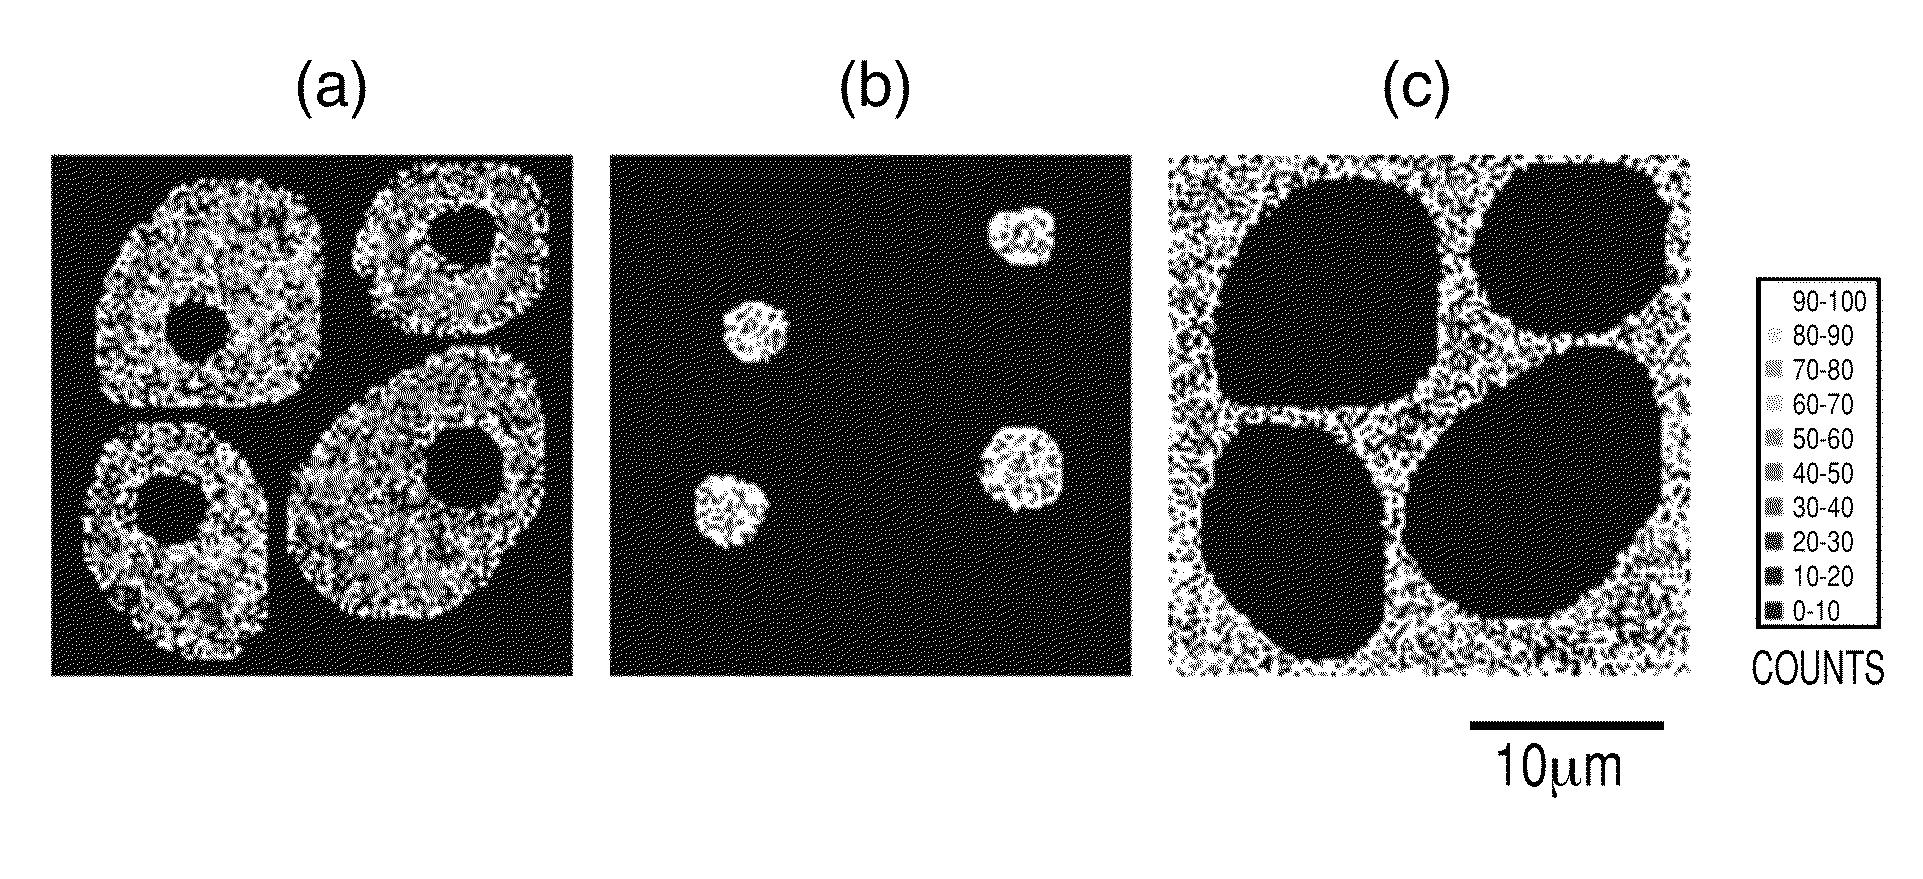
[0070]Hereinafter, there is shown an example in which a tissue section is used as an analyte and an image is acquired by the TOF-SIMS method.

[0071]A silicon (Si) substrate containing no impurities is washed with acetone, ethanol, and deionized water, in this order, on which 100 nm of gold (Au) is deposited to form an analytical substrate.

[0072]In the present Example, a diseased tissue section is used as an analyte. A diseased tissue is embedded in an OCT compound, is frozen, and is then cut into a thickness of about 4 μm with a microtome to obtain a section. The resulting section is arranged on the substrate which has been previously installed and cooled in the microtome so that an analysis surface faces upward. The section is fixed to the substrate by pressing the edges thereof with a wool brush to be adhered thereto. After the sample is freeze-dried, 10 μL of a trypsin solution having a proper concentration are dropped on the surface of the sample. The sample is digested overnight...

example 2

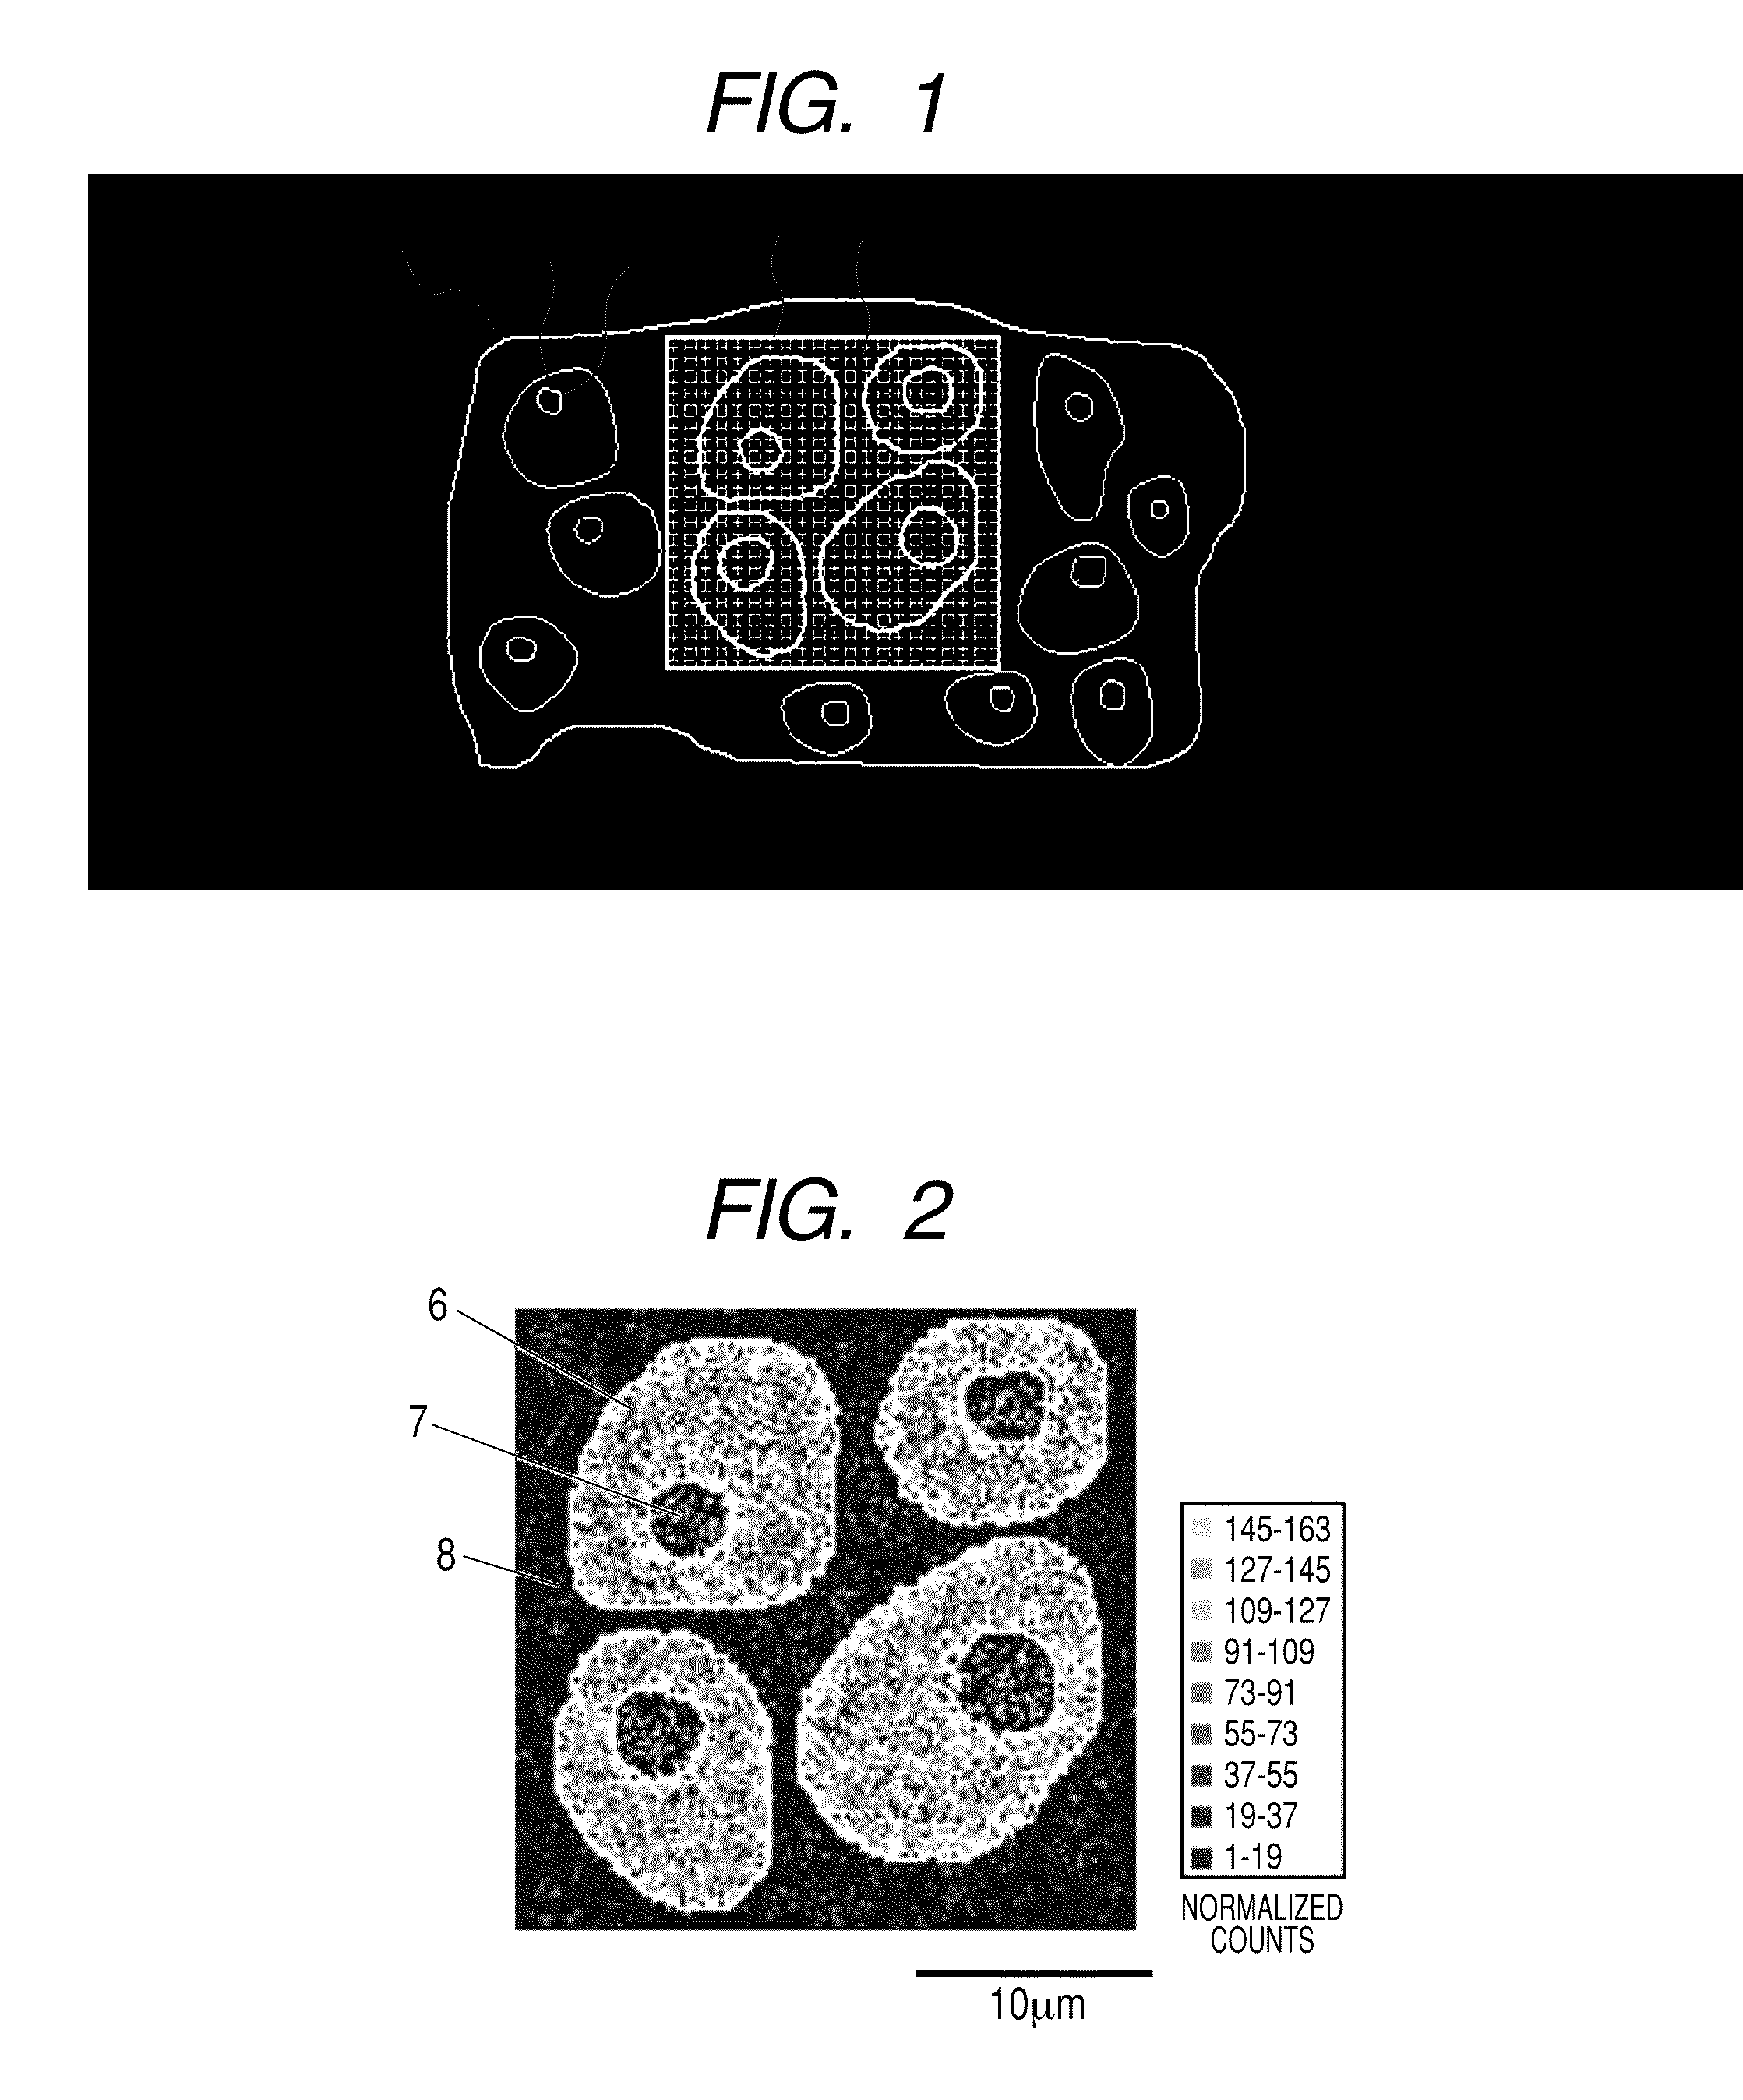
[0092]Hereinafter, there is illustrated a method of holding information on the mass of constituents in an analyte obtained from a determined measurement range as electronic data and using computer software to the electronic data to semi-automatically form a two-dimensional distribution image of the target constituent.

[0093]The data used for processing is the electronic data that stores the mass spectrum two dimensional distribution obtained by measuring the trypsin-digested tissue section obtained in Example 1. The procedure of processing is as follows.

(Step 1) The number of pixels in the measurement range is specified. The two-dimensional distribution data of this mass spectrum is constituted from 128×128 measurement pixels in the XY direction. For the purpose of reducing processing time, the measurement range is divided into 64×64 pixels by redefining 2×2 measurement pixels in the XY direction as one pixel. And the number of 0 to 63 is newly applied to each pixel in the XY coordin...


PUM


Abstract

An object of the present invention is to provide a method of comprehensively visualizing a constituent in tumor tissue or the like at a cellular level.The present invention provides a method of forming a two-dimensional distribution image of a target constituent based on information on the mass of constituents of the tissue section wherein, as the internal standard material, any one of actin, tubulin and GAPDH is used in the intracellular region, one of histone and nucleic acid is used in the nuclear region, and one of albumin and cytokine is used in the extracellular region.

Description

TECHNICAL FIELD[0001]The present invention relates to a method of acquiring information on the mass of constituents in an analyte as an image using mass spectrometry, and particularly to a method of forming an image of the two-dimensional distribution state of a biological substance such as proteins and peptides contained in a tissue section by normalizing signal strength.BACKGROUND ART[0002]There is known an analytical method of comprehensively visualizing the expression amount of a protein expressed in tumor tissue based on signal strength using a time-of-flight secondary ion mass spectrometer (TOF-SIMS) (U.S. Pat. No. 7,446,309).[0003]Moreover, the normalization of signal intensity of mass spectrometry using a standard material is known. In a proteomic analysis, proteins are separated by two-dimensional electrophoresis and the separated proteins are analyzed by mass spectroscopy. Then, the intensity of the protein of interest is normalized using the intensity of a protein having ...

Claims


Application Information

Patent Timeline
Patent Type & Authority Applications(United States)
IPC IPC(8): H01J49/26H01J49/40G16B45/00
CPCG06F19/26Y10T436/24G01N33/6848H01J49/0004G16B45/00
Inventor KOMATSU, MANABUHASHIMOTO, HIROYUKI
Owner CANON KK
Why Eureka
Try Eureka