Methods for Quantifying Vitamin D Metabolites by Mass Spectrometry
a mass spectrometry and metabolite technology, applied in the field of methods for quantifying vitamin d metabolites by mass spectrometry, can solve the problems of rare clinical measurements of vitamin d, the inactive vitamin d precursor, and low diagnostic valu
- Summary
- Abstract
- Description
- Claims
- Application Information
AI Technical Summary
Benefits of technology
Problems solved by technology
Method used
Image
Examples
example 1
Quantitative Analysis of 1,25-Dihydroxyvitamin D3 in a Sample Via Formation of an Amine / 1,25-Dihyrdoxyvitamin D3 Adduct
[0169]To about 200 μL of serum is added about 300 μL methanol containing excess amine and an internal standard (e.g., deuterated 1α,25-dihydroxyvitamin D3). The sample is vortexed and spun. The sample is then injected into a Q-TOF mass spectrometer (Agilent) using a small C18 column (20 mm×2 mm I.D., particle size 1.8 μm). Elute with methanol gradient and quantify at the expected molecular ion peaks. For example, for thyroxine (T4), quantify at 1194.1 to 5 decimals or 1192.2 to 5 decimals.
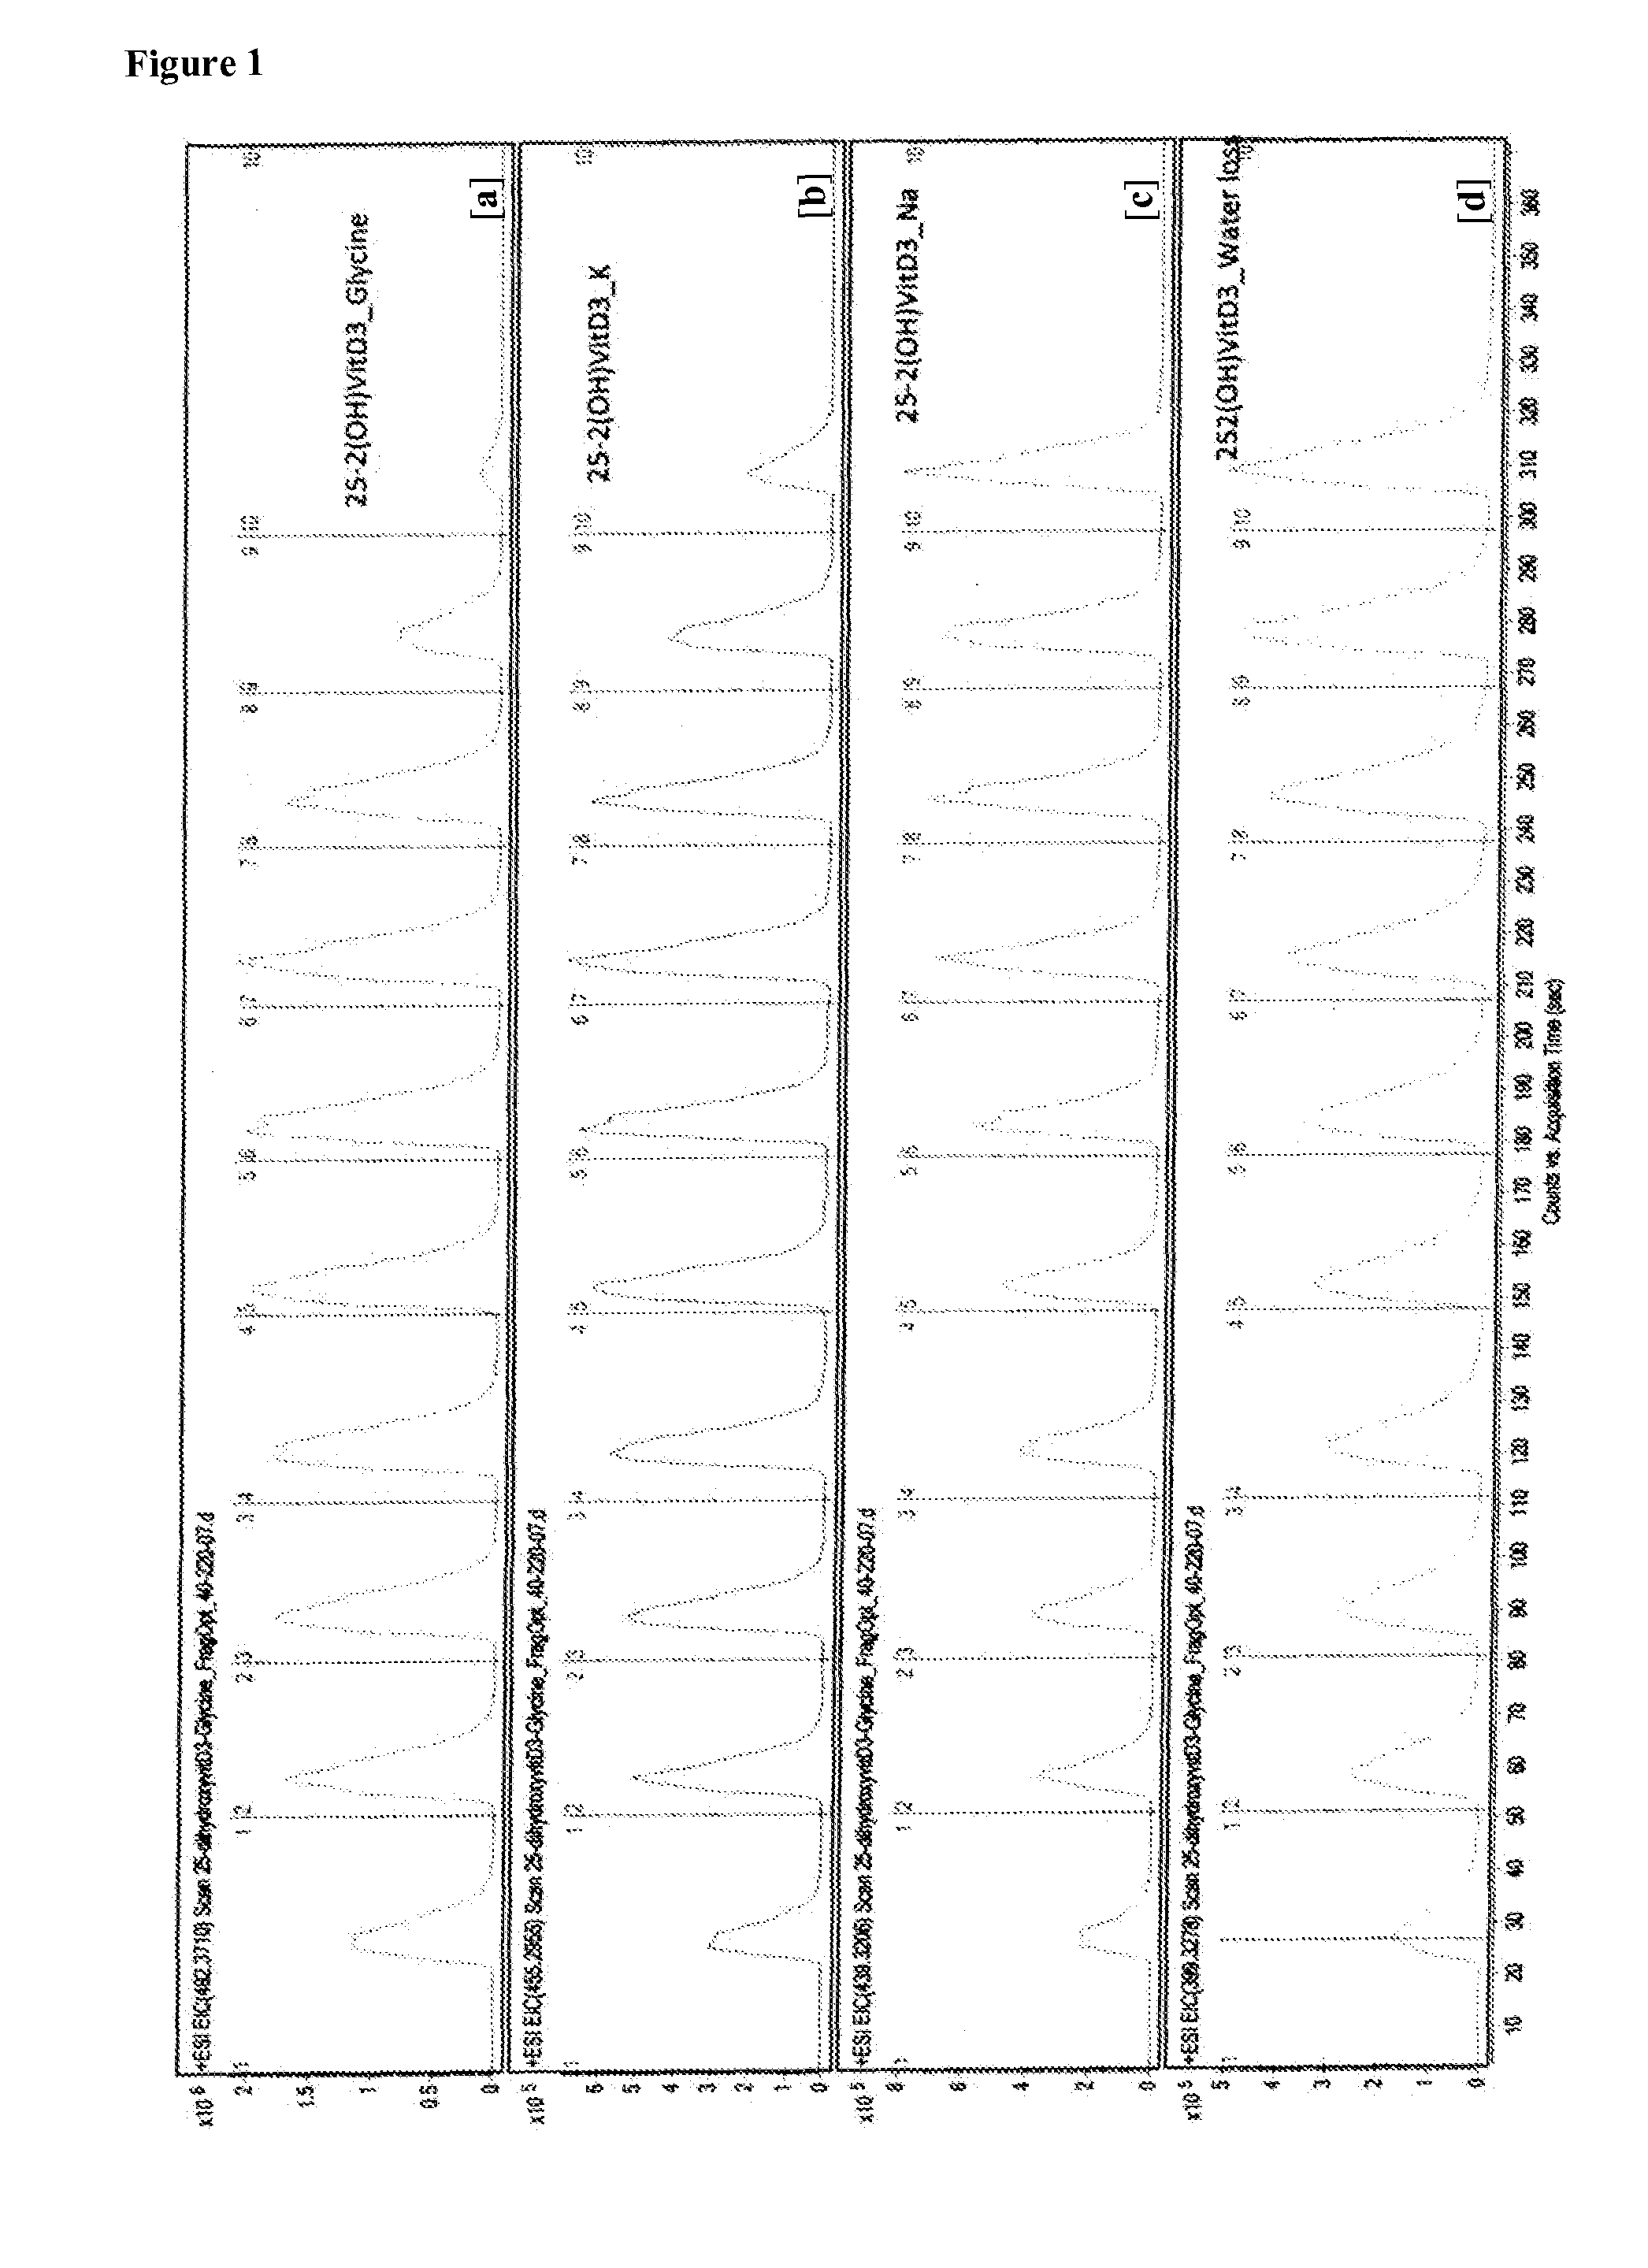
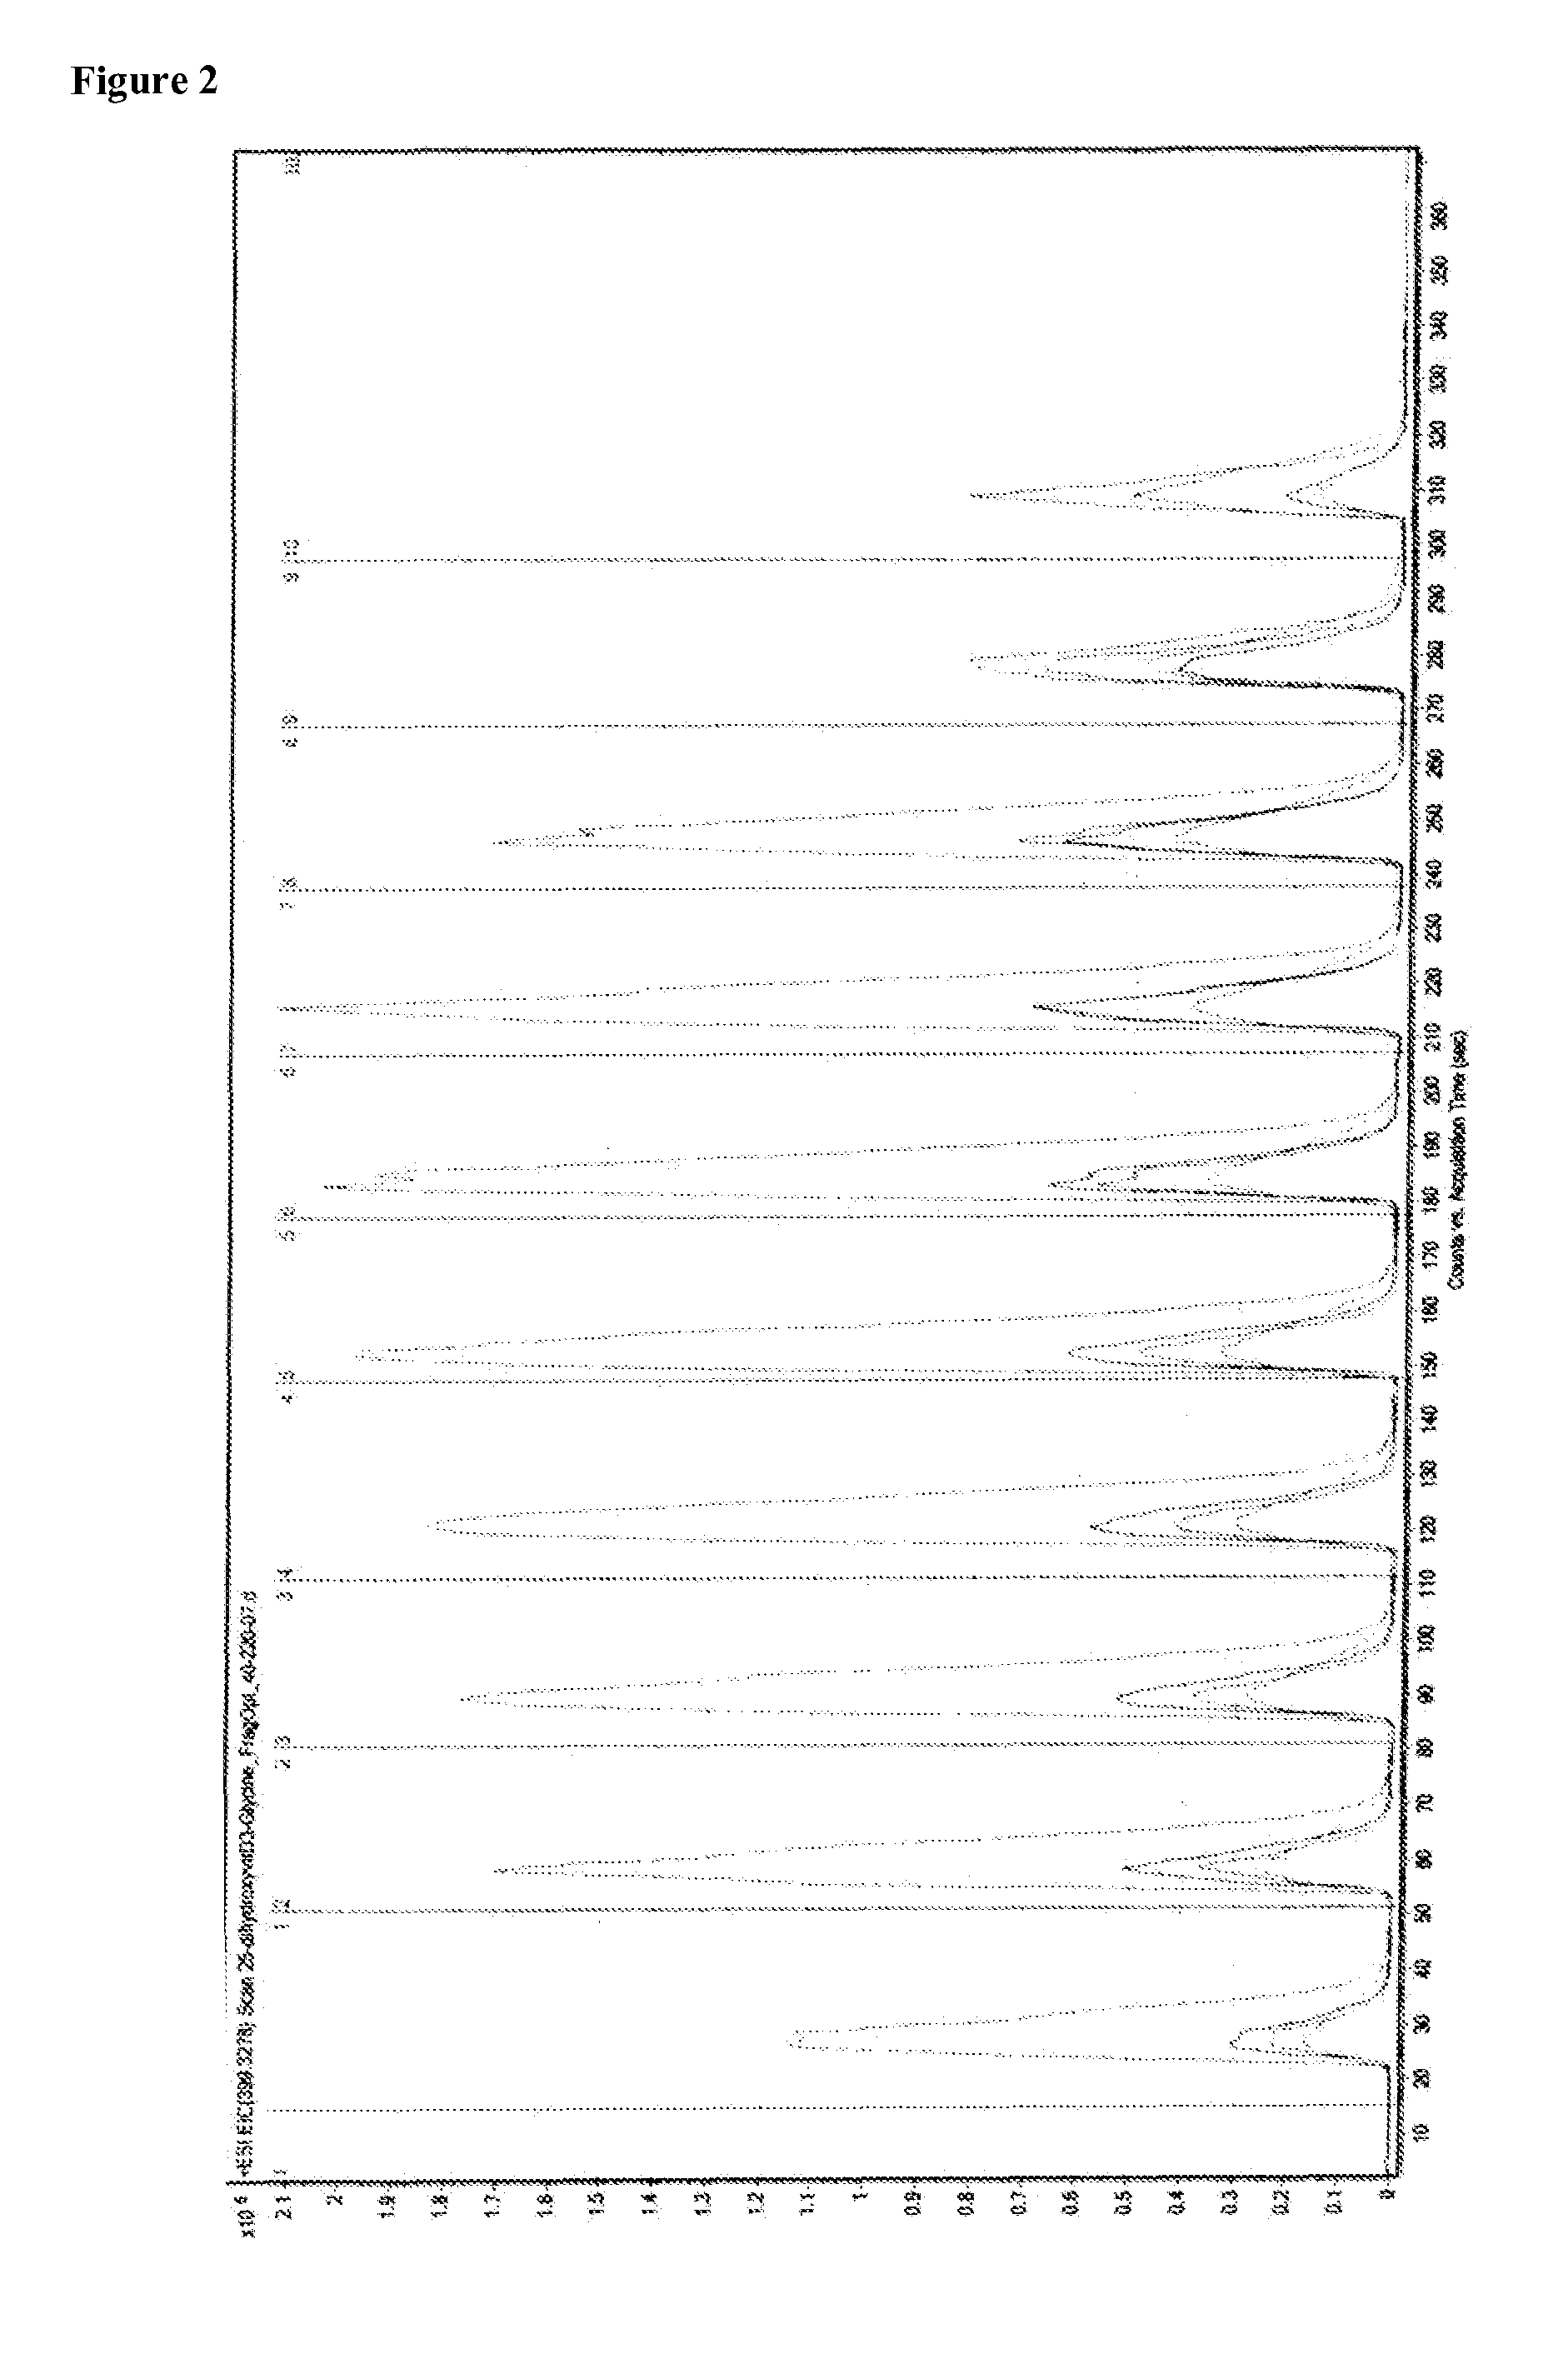
[0170]The mass spectrum of adducts of 1,25-dihydroxyvitamin D3 with thyroxine (T4), triiodothyronine (T3), glycine, alainine, arginine, serine, and iodothyronamine were obtained. The adduct molecular ion peaks which were quantified are shown in the table below.
aminepeak (m / z, amu)glycine492.2alanine506.4serine522.4arginine591.5iodothyronamine772.4triiodothyronine (T3)1066.2 or 1068...
example 2
Quantitative Analysis of 1,25-Dihydroxyvitamin D3 in a Sample Via Formation of an Alkali Metal Ion / 1,25-Dihyrdoxyvitamin D3 Adduct
[0172]To serum is added a buffer containing an alkali metal salt (at about 1 nM) and, optionally, an internal standard (e.g., deuterated 1α,25-dihydroxyvitamin D3). The sample is vortexed and spun. The sample is then injected into a Q-TOF mass spectrometer (Agilent) using a small C18 column (20 mm×2 mm I.D., particle size 1.8 μm). The sample is eluted with methanol and the expected molecular ion peaks are quantified. For example, for sodium, quantify at 439.3 to 5 decimals.
[0173]The mass spectrum of adducts of 1,25-dihydroxyvitamin D3 with sodium (m / z of 439.3206 amu) and potassium (m / z of 455.2955 amu) were obtained.
example 3
Preparation of a Calibration Curve
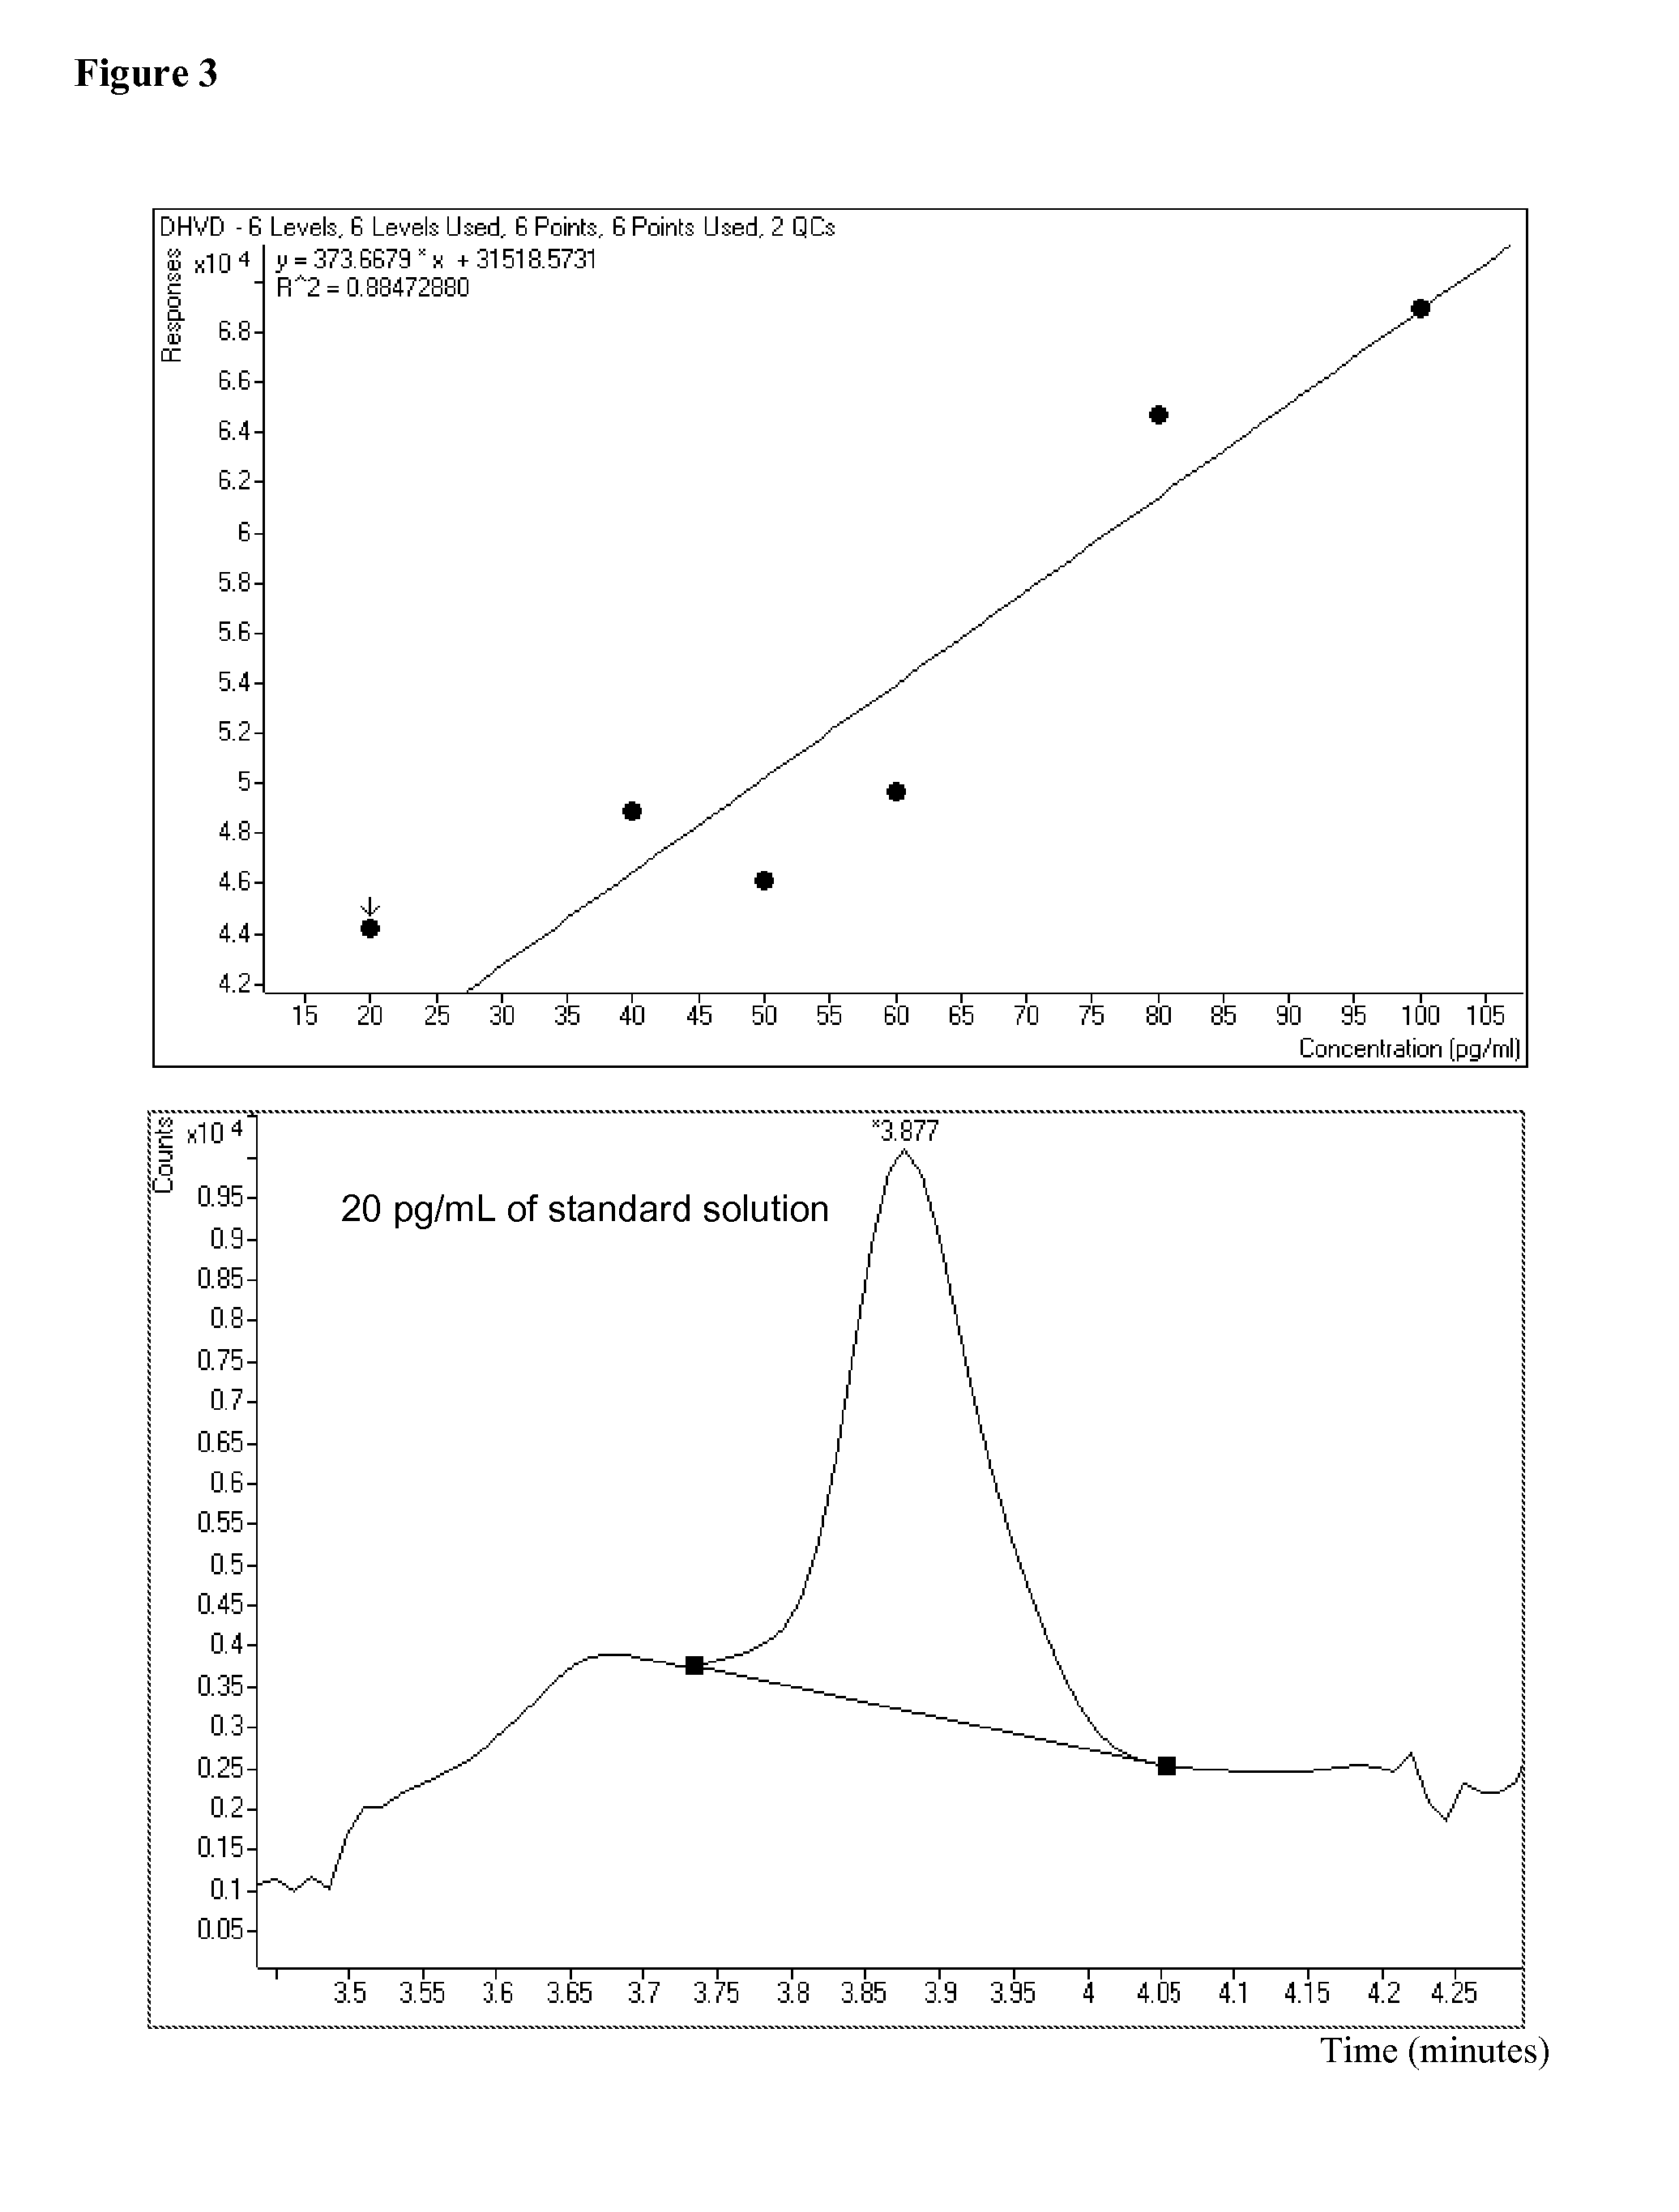
[0174]A calibration curve for 1,25-dihydroxyvitamin D3 glycine adducts is shown in FIG. 3. After a standard (18 μL) was injected onto a column (such as an Agilent Sorbex C18 column, 2.1×15 mm, 1.8 micron), the column was washed for about two minutes with a 2% MeOH / 2 mM glycine solution. After switching to a 98% MeOH / 2 mM glycine solution, the standard was eluted and the area under the curve was measured and correlated to concentration. The flow rate used was 0.35 mL / min. The peak shown in FIG. 3 (bottom) is measured at 492.3610.
PUM
| Property | Measurement | Unit |
|---|---|---|
| Concentration | aaaaa | aaaaa |
| Concentration | aaaaa | aaaaa |
| Time | aaaaa | aaaaa |
Abstract
Description
Claims
Application Information
 - R&D
- Intellectual Property
- Life Sciences
- Materials
- Tech Scout
- Unparalleled Data Quality
- Higher Quality Content
- 60% Fewer Hallucinations
Browse by: Latest US Patents, China's latest patents, Technical Efficacy Thesaurus, Application Domain, Technology Topic, Popular Technical Reports.
© 2025 PatSnap. All rights reserved.Legal|Privacy policy|Modern Slavery Act Transparency Statement|Sitemap|About US| Contact US: help@patsnap.com


