Direct measurements of nanoparticles and virus by virus mass spectrometry
- Summary
- Abstract
- Description
- Claims
- Application Information
AI Technical Summary
Benefits of technology
Problems solved by technology
Method used
Image
Examples
example 1
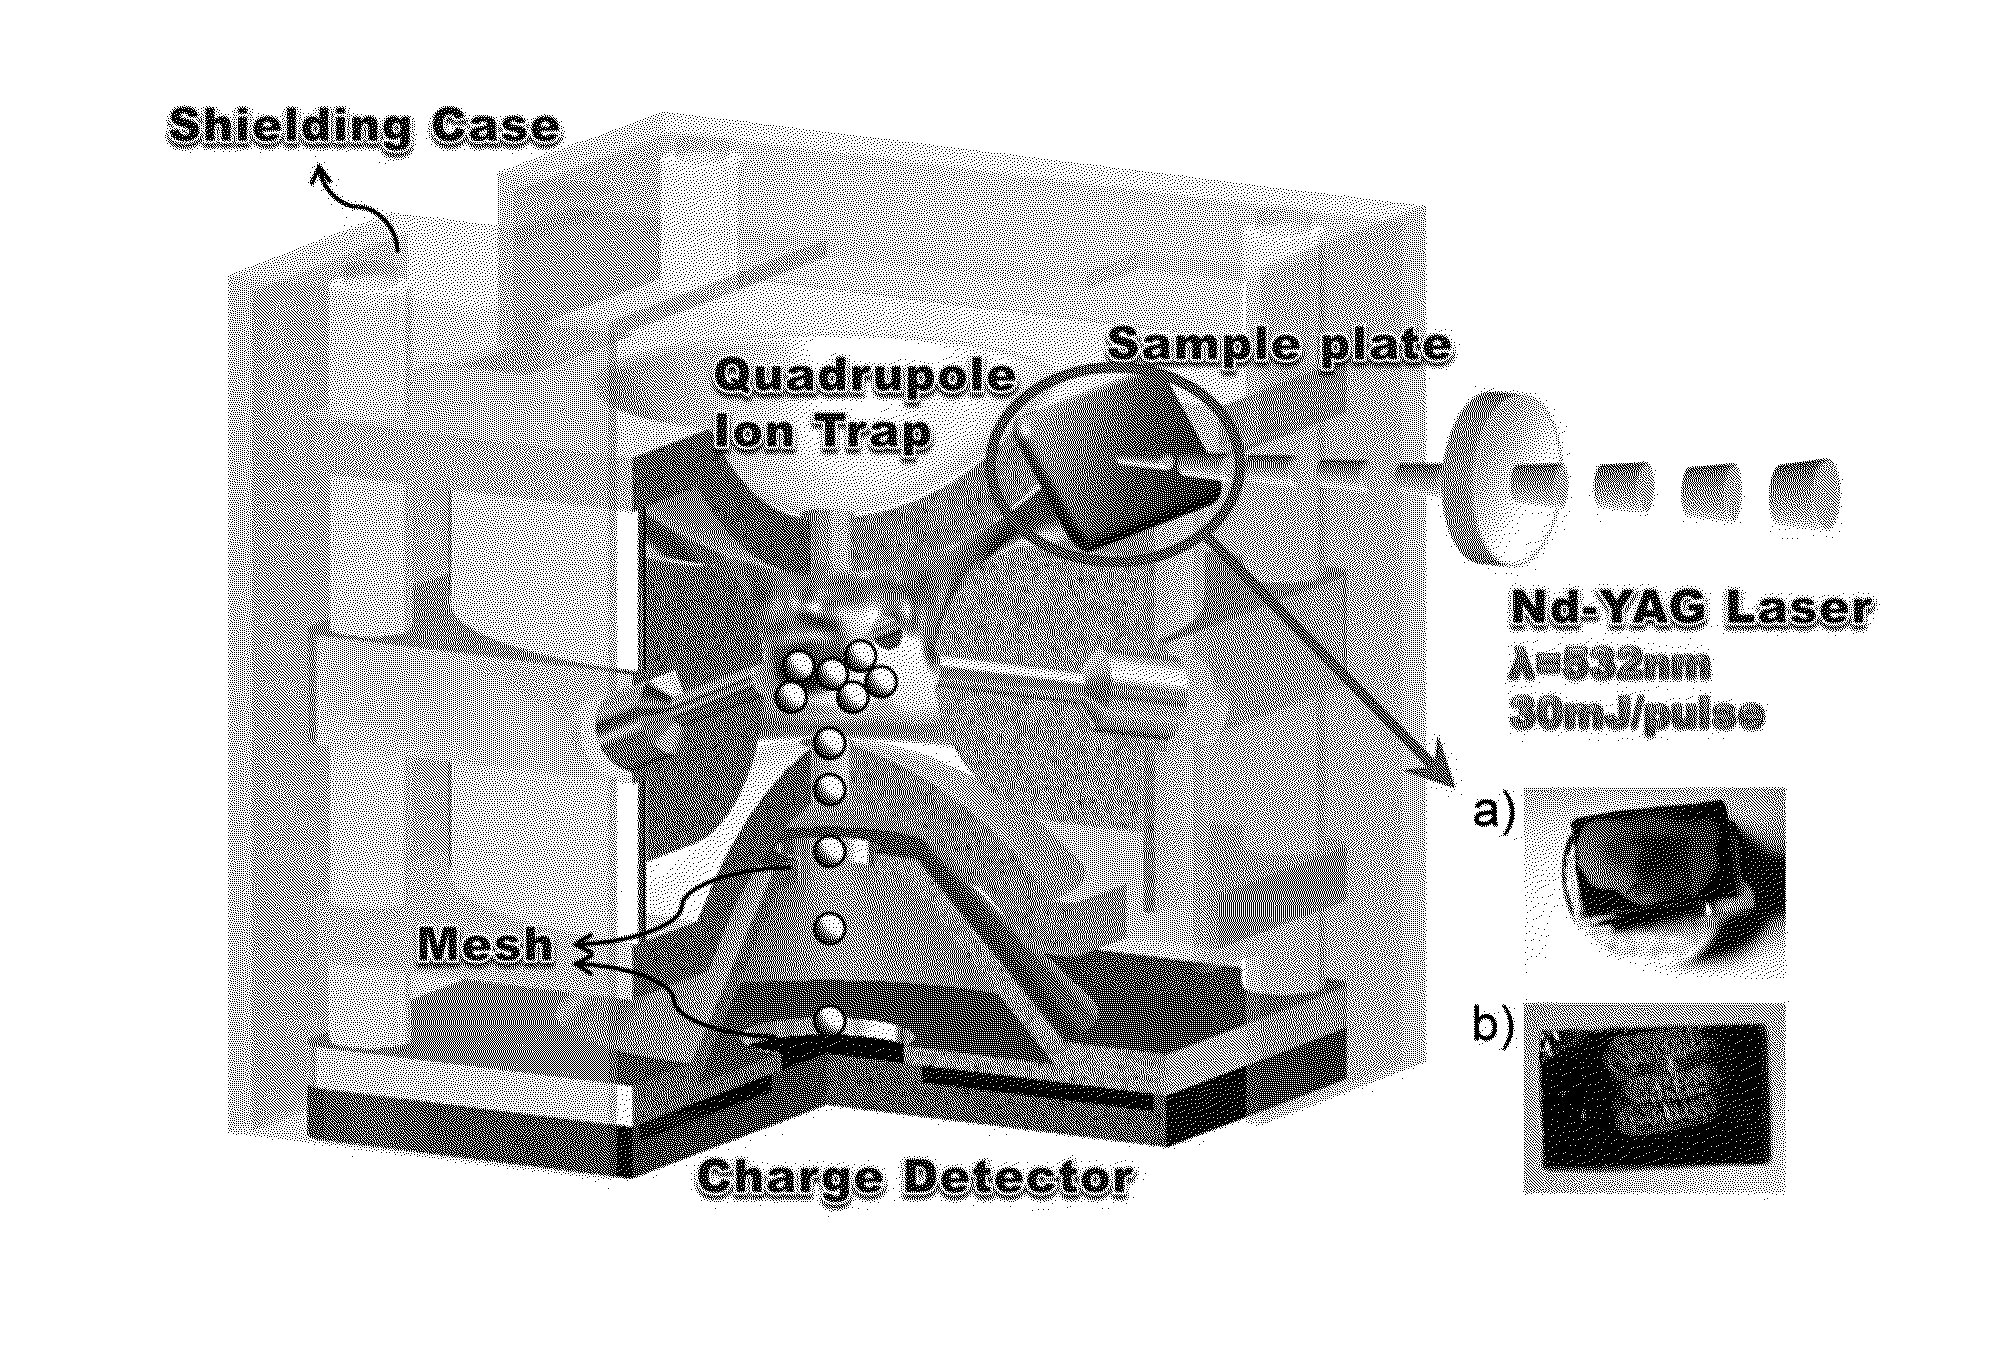
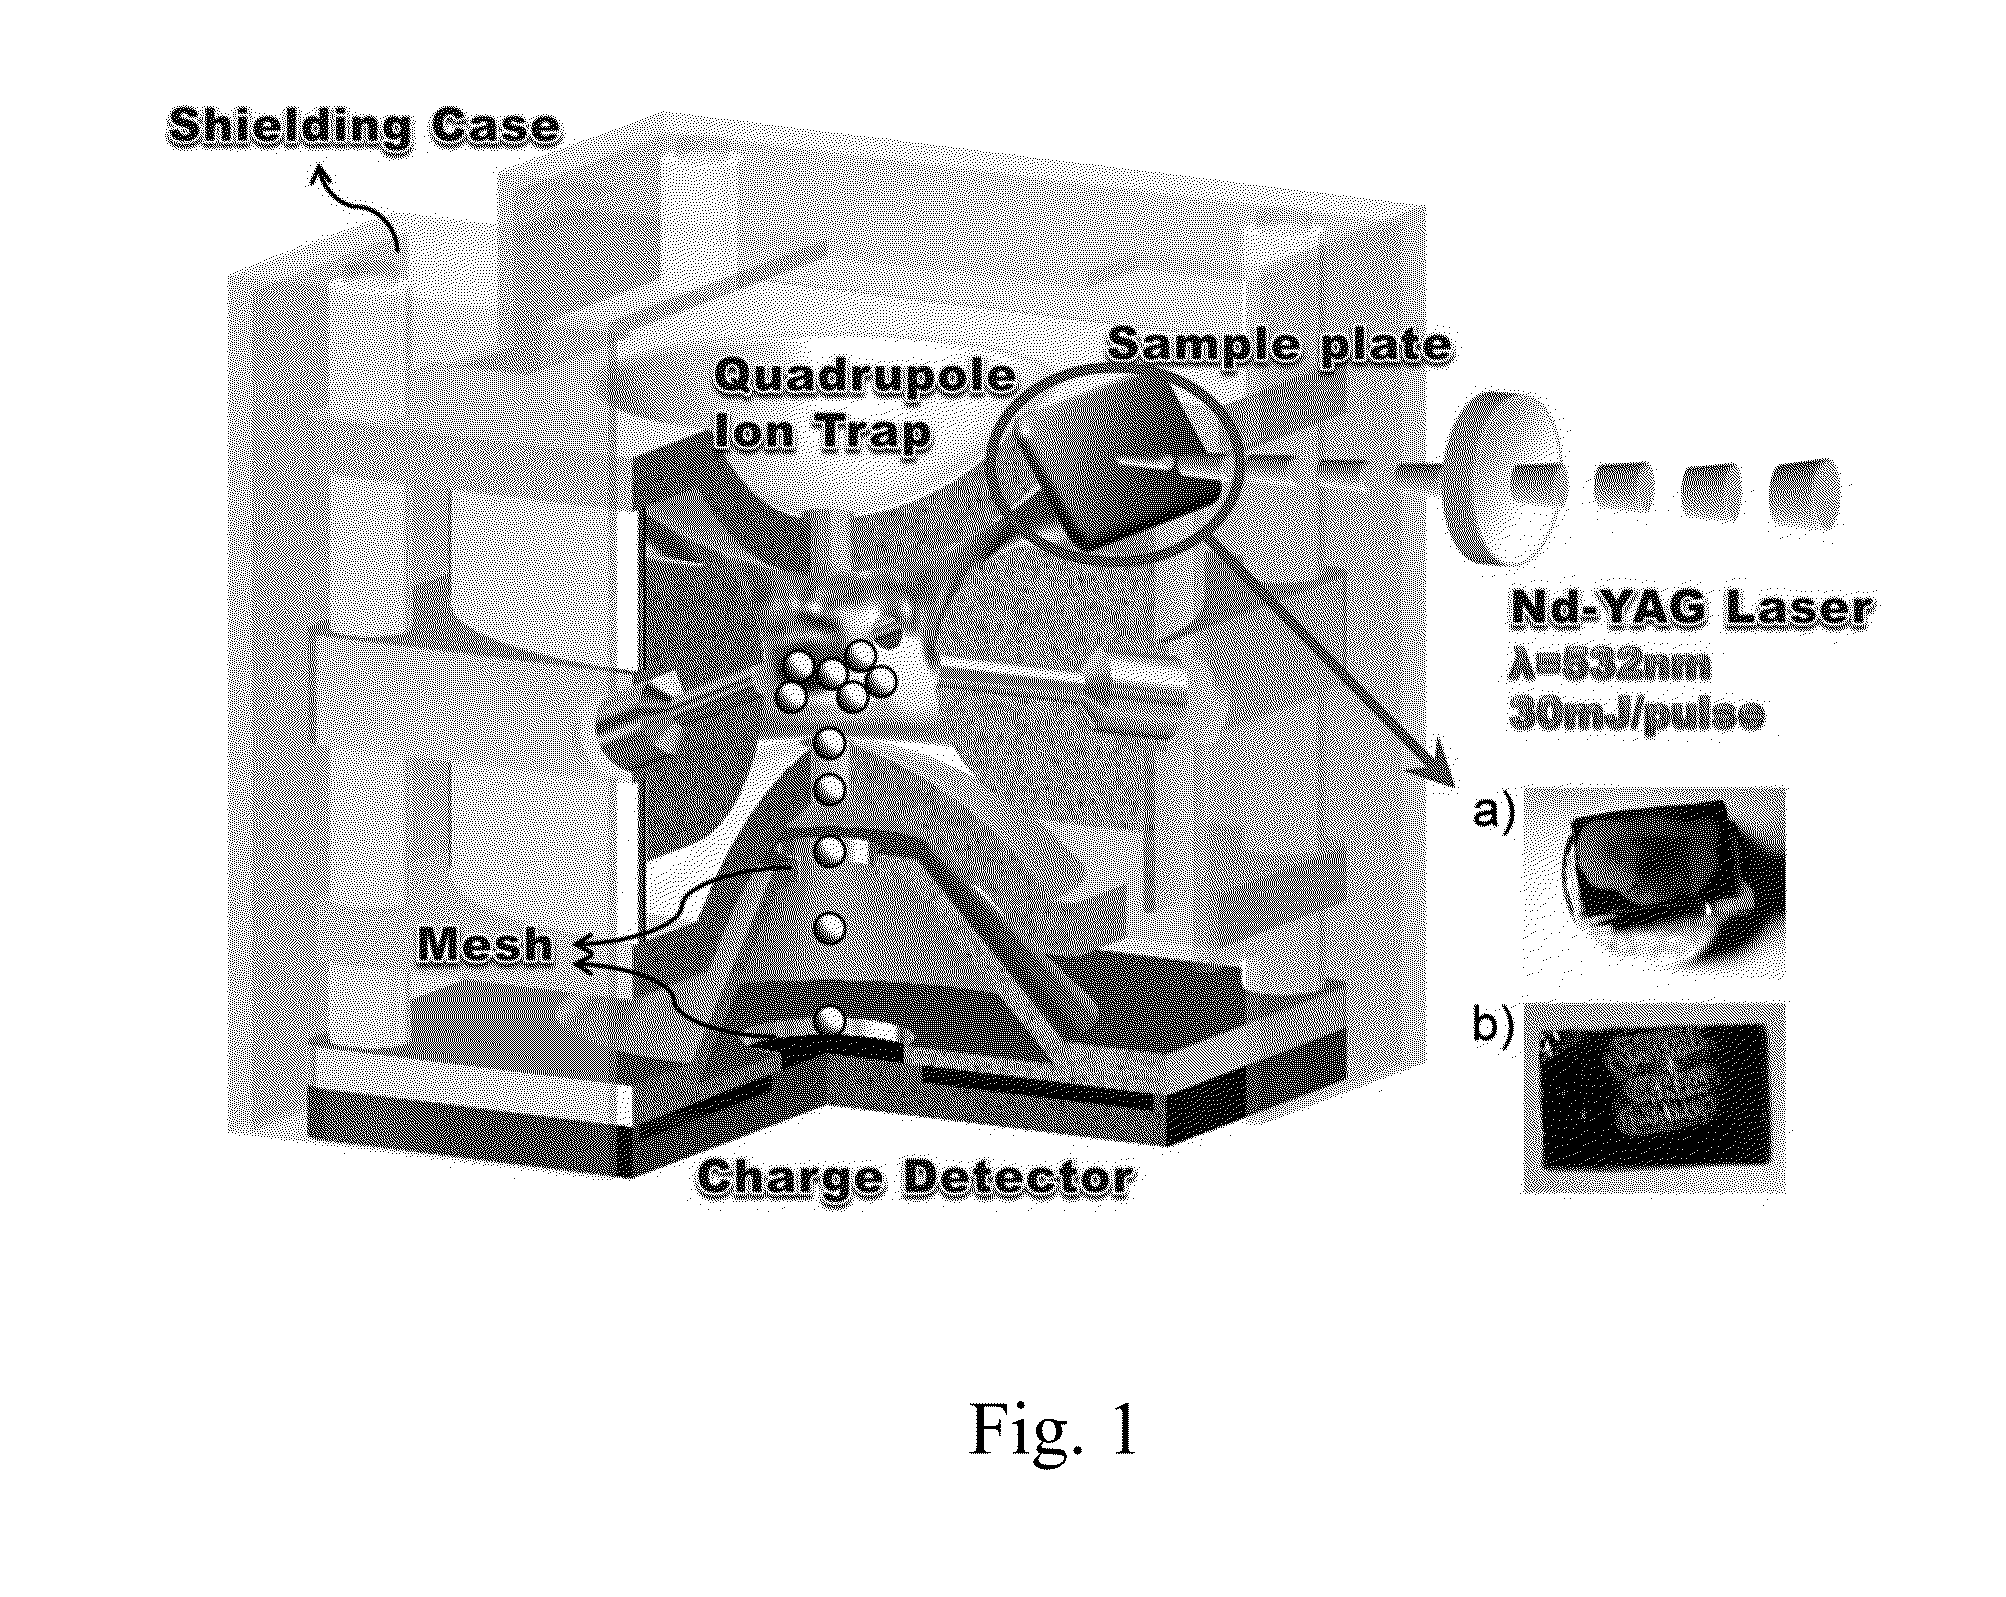
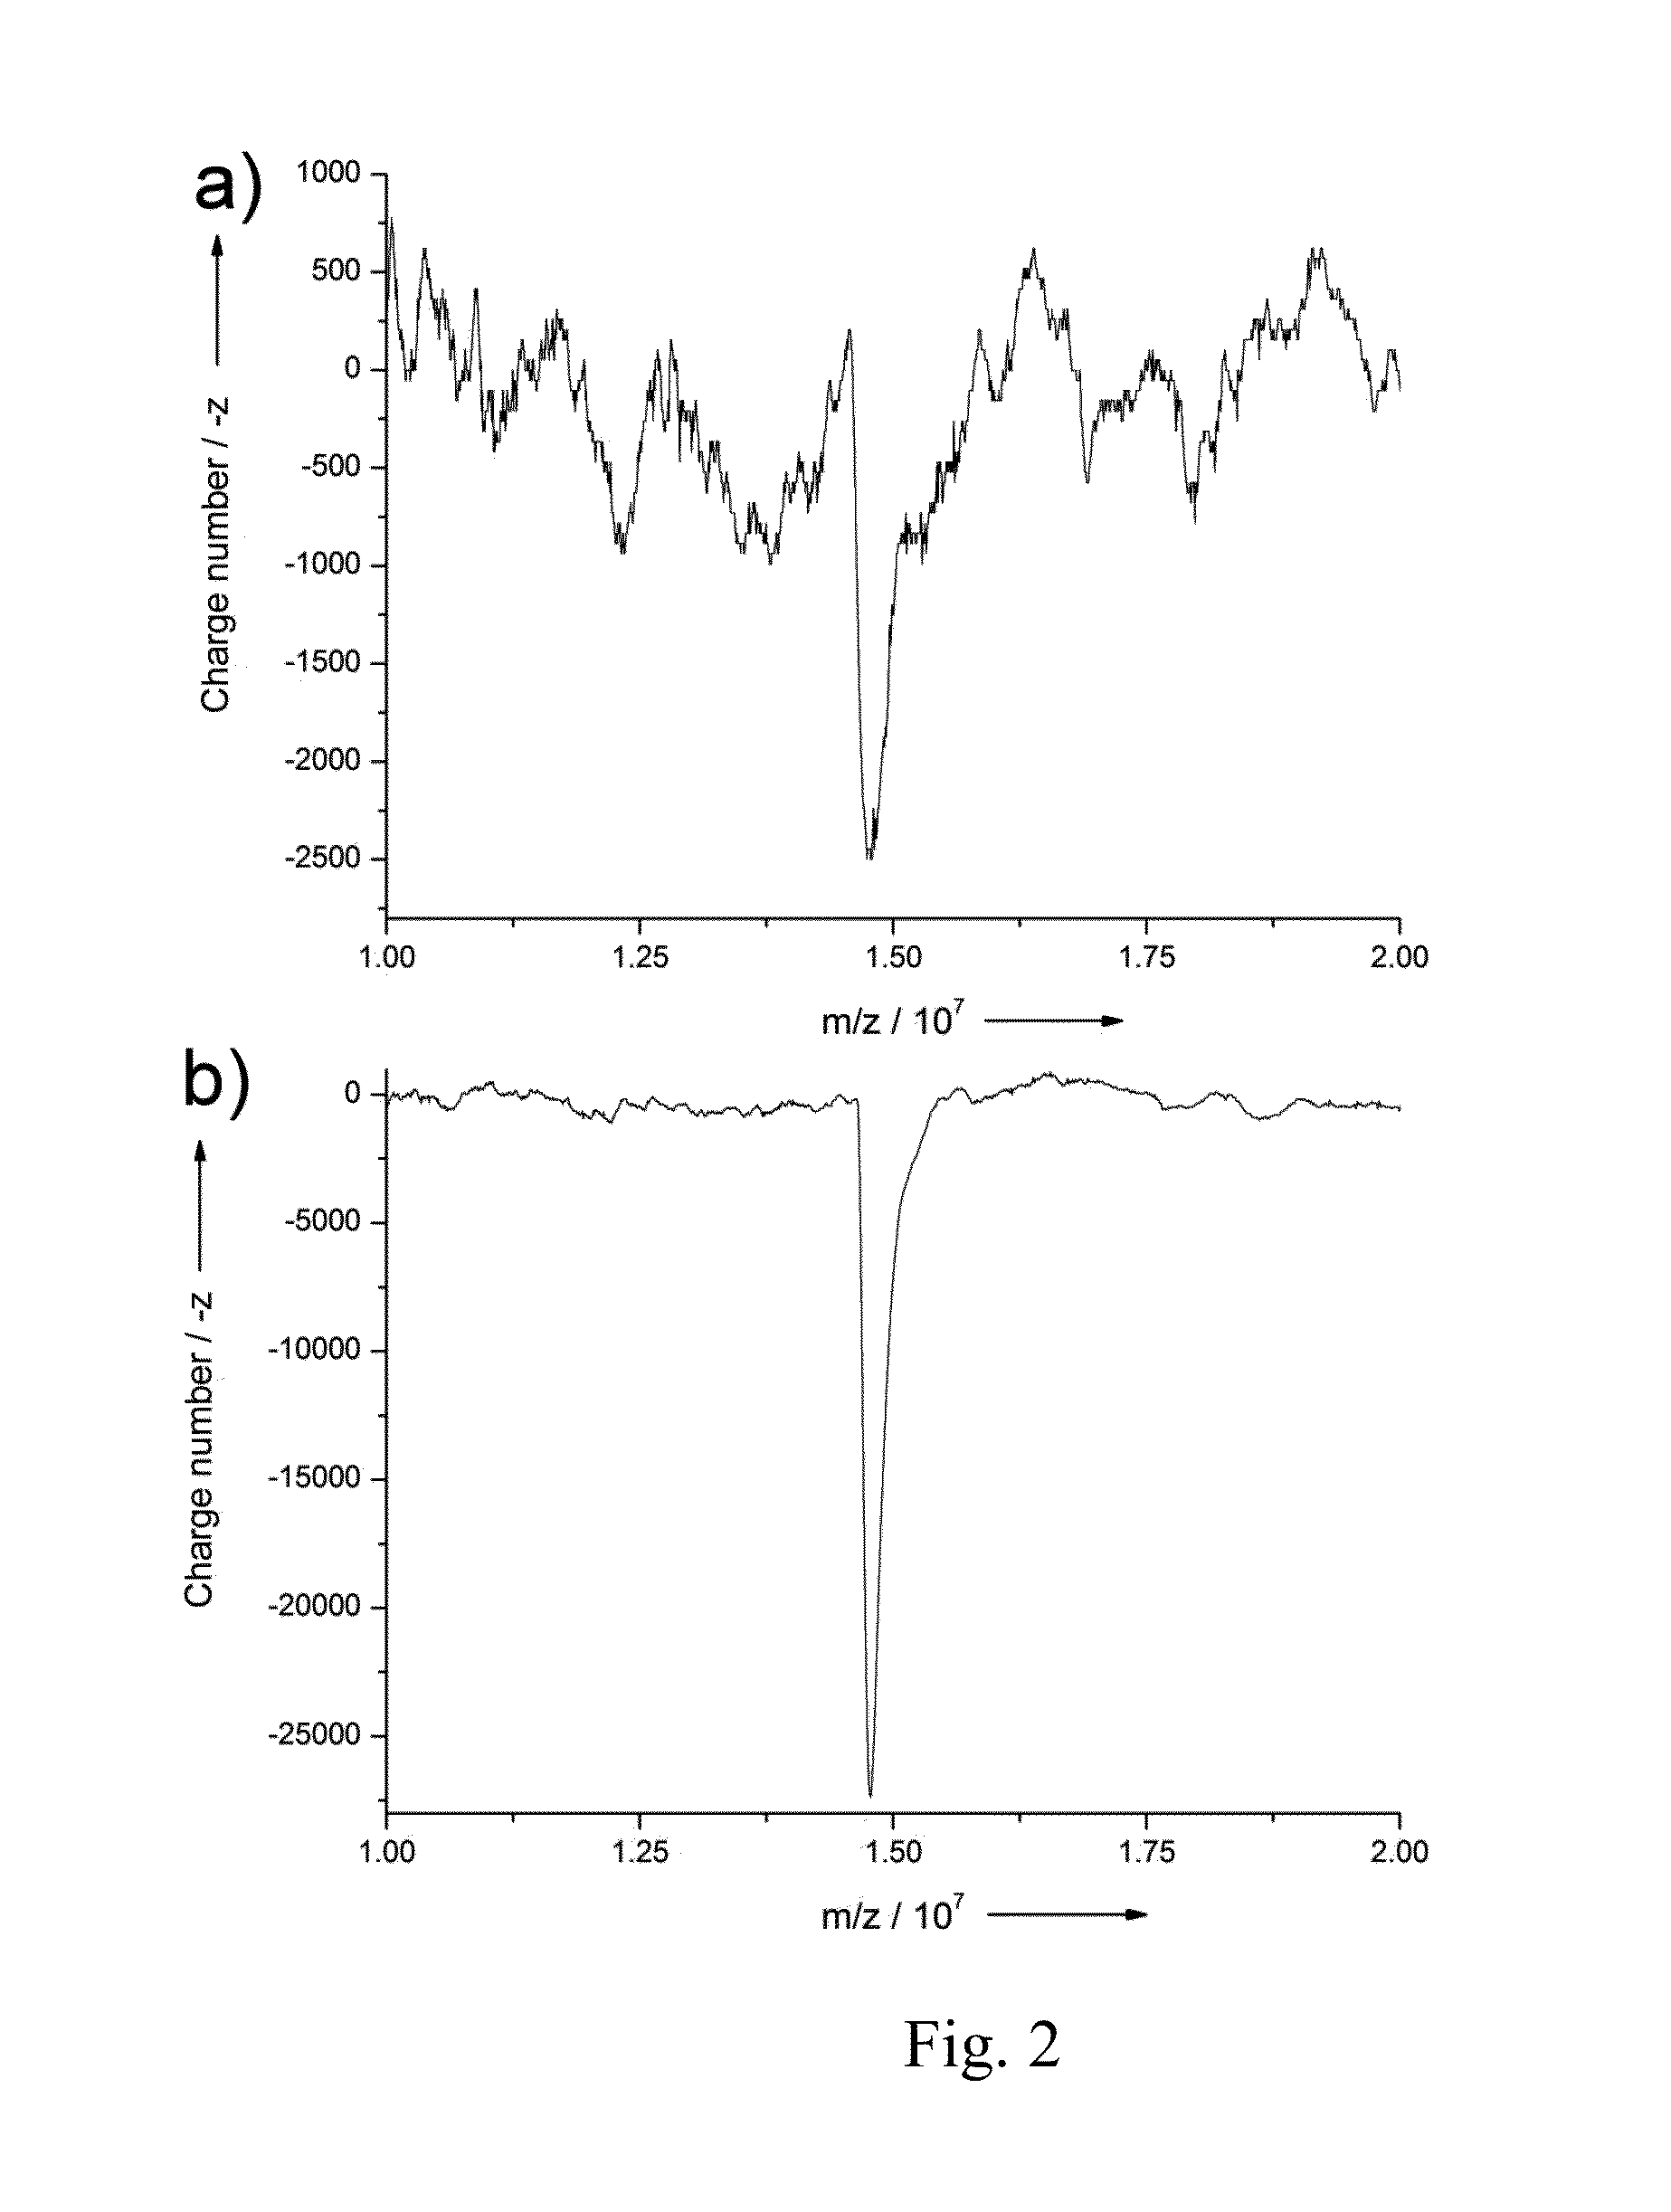
[0100]As shown in FIG. 2, synchronizing the time of the laser firing so that it occurs at zero RF voltage increases trap efficiency so that more nanoparticles are collected. In FIG. 2, the mass spectrum of 50 nm polystyrene sphere particles (Thermo Scientific) was obtained with an apparatus configured as an inventive VMS instrument of this disclosure. The single-scan mass spectra of 50 nm polystyrene sphere particles with the inventive VMS instrument were obtained: (a) without phase synchronization, and (b) with phase synchronization. Surprisingly, the signal to noise of the mass spectrum is greatly increased.
example 2
[0101]With an apparatus configured as an inventive VMS instrument of this disclosure, the masses of virus were detected accurately. In this example, polystyrene spheres (Thermo Scientific) with sizes of 50 and 100 nm were detected. The mass spectrum of these polystyrene sphere particles by VMS is shown in FIG. 3. These masses were close to the mass range of a virus. The calculated masses were 4.14×10⁷ and 3.3×10⁸ Da, respectively. The ion trap was operated under an axial mass-selective instability mode by scanning the trap driving frequency in the range 2000-500 Hz and 1500-200 Hz, respectively. A voltage of 1000 Vp-p was initially applied with a high-voltage transformer driven by a RF voltage power amplifier and a functional generator. In scanning the frequency, the scanning rate window is fixed at 100 ms with the functional generator, and particles could be ejected along an axial direction and subsequently detected with a charge sensitive detector. All of the mass spectra were the...
example 3
[0103]In FIG. 3a, the m / z of 50 nm polystyrene sphere particles were measured to be 4.12×10⁷ (M+, monomer), 8.6×10⁷ (M2+, dimer), 1.26×10⁸ (M3+), 1.68×10⁸ (M4+), 2.04×10⁸ (M5+), 2.47×10⁸ (M6+), and 2.88×10⁸ (M7−). The particle numbers were determined by dividing intensity of charge sensitive detector and charge number of particle. The clusters carried double charges and were measured to be 9.8×10⁷ (M52+), 1.19×10⁸ (M62+), and 1.46×10⁸ (M72+). These results show that larger nanoparticles carry more charges when the volume of the particles (larger clusters) increases. These results agree with the calculated mass of 50 nm polystyrene sphere monoparticles (4.14×10⁷ Da).
[0104]In FIG. 3b, the m / z of 100 nm polystyrene sphere particles were measured to be 3.26×10⁸ (M+, single charge), 1.65×10⁸ (M2+, double charges), and 1.12×10⁸ (M3+, triple charges). These are in agreement with the calculated mass of 100 nm polystyrene sphere monoparticles as 3.3×10⁸ Da. For these experiments, the mass sp...
PUM
 Abstract
Description
Claims
Application Information
 - R&D
- Intellectual Property
- Life Sciences
- Materials
- Tech Scout
- Unparalleled Data Quality
- Higher Quality Content
- 60% Fewer Hallucinations
Browse by: Latest US Patents, China's latest patents, Technical Efficacy Thesaurus, Application Domain, Technology Topic, Popular Technical Reports.
© 2025 PatSnap. All rights reserved.Legal|Privacy policy|Modern Slavery Act Transparency Statement|Sitemap|About US| Contact US: help@patsnap.com


