System for noninvasive optical measurements of physiological properties in tissue
- Summary
- Abstract
- Description
- Claims
- Application Information
AI Technical Summary
Benefits of technology
Problems solved by technology
Method used
Image

Examples
Embodiment Construction
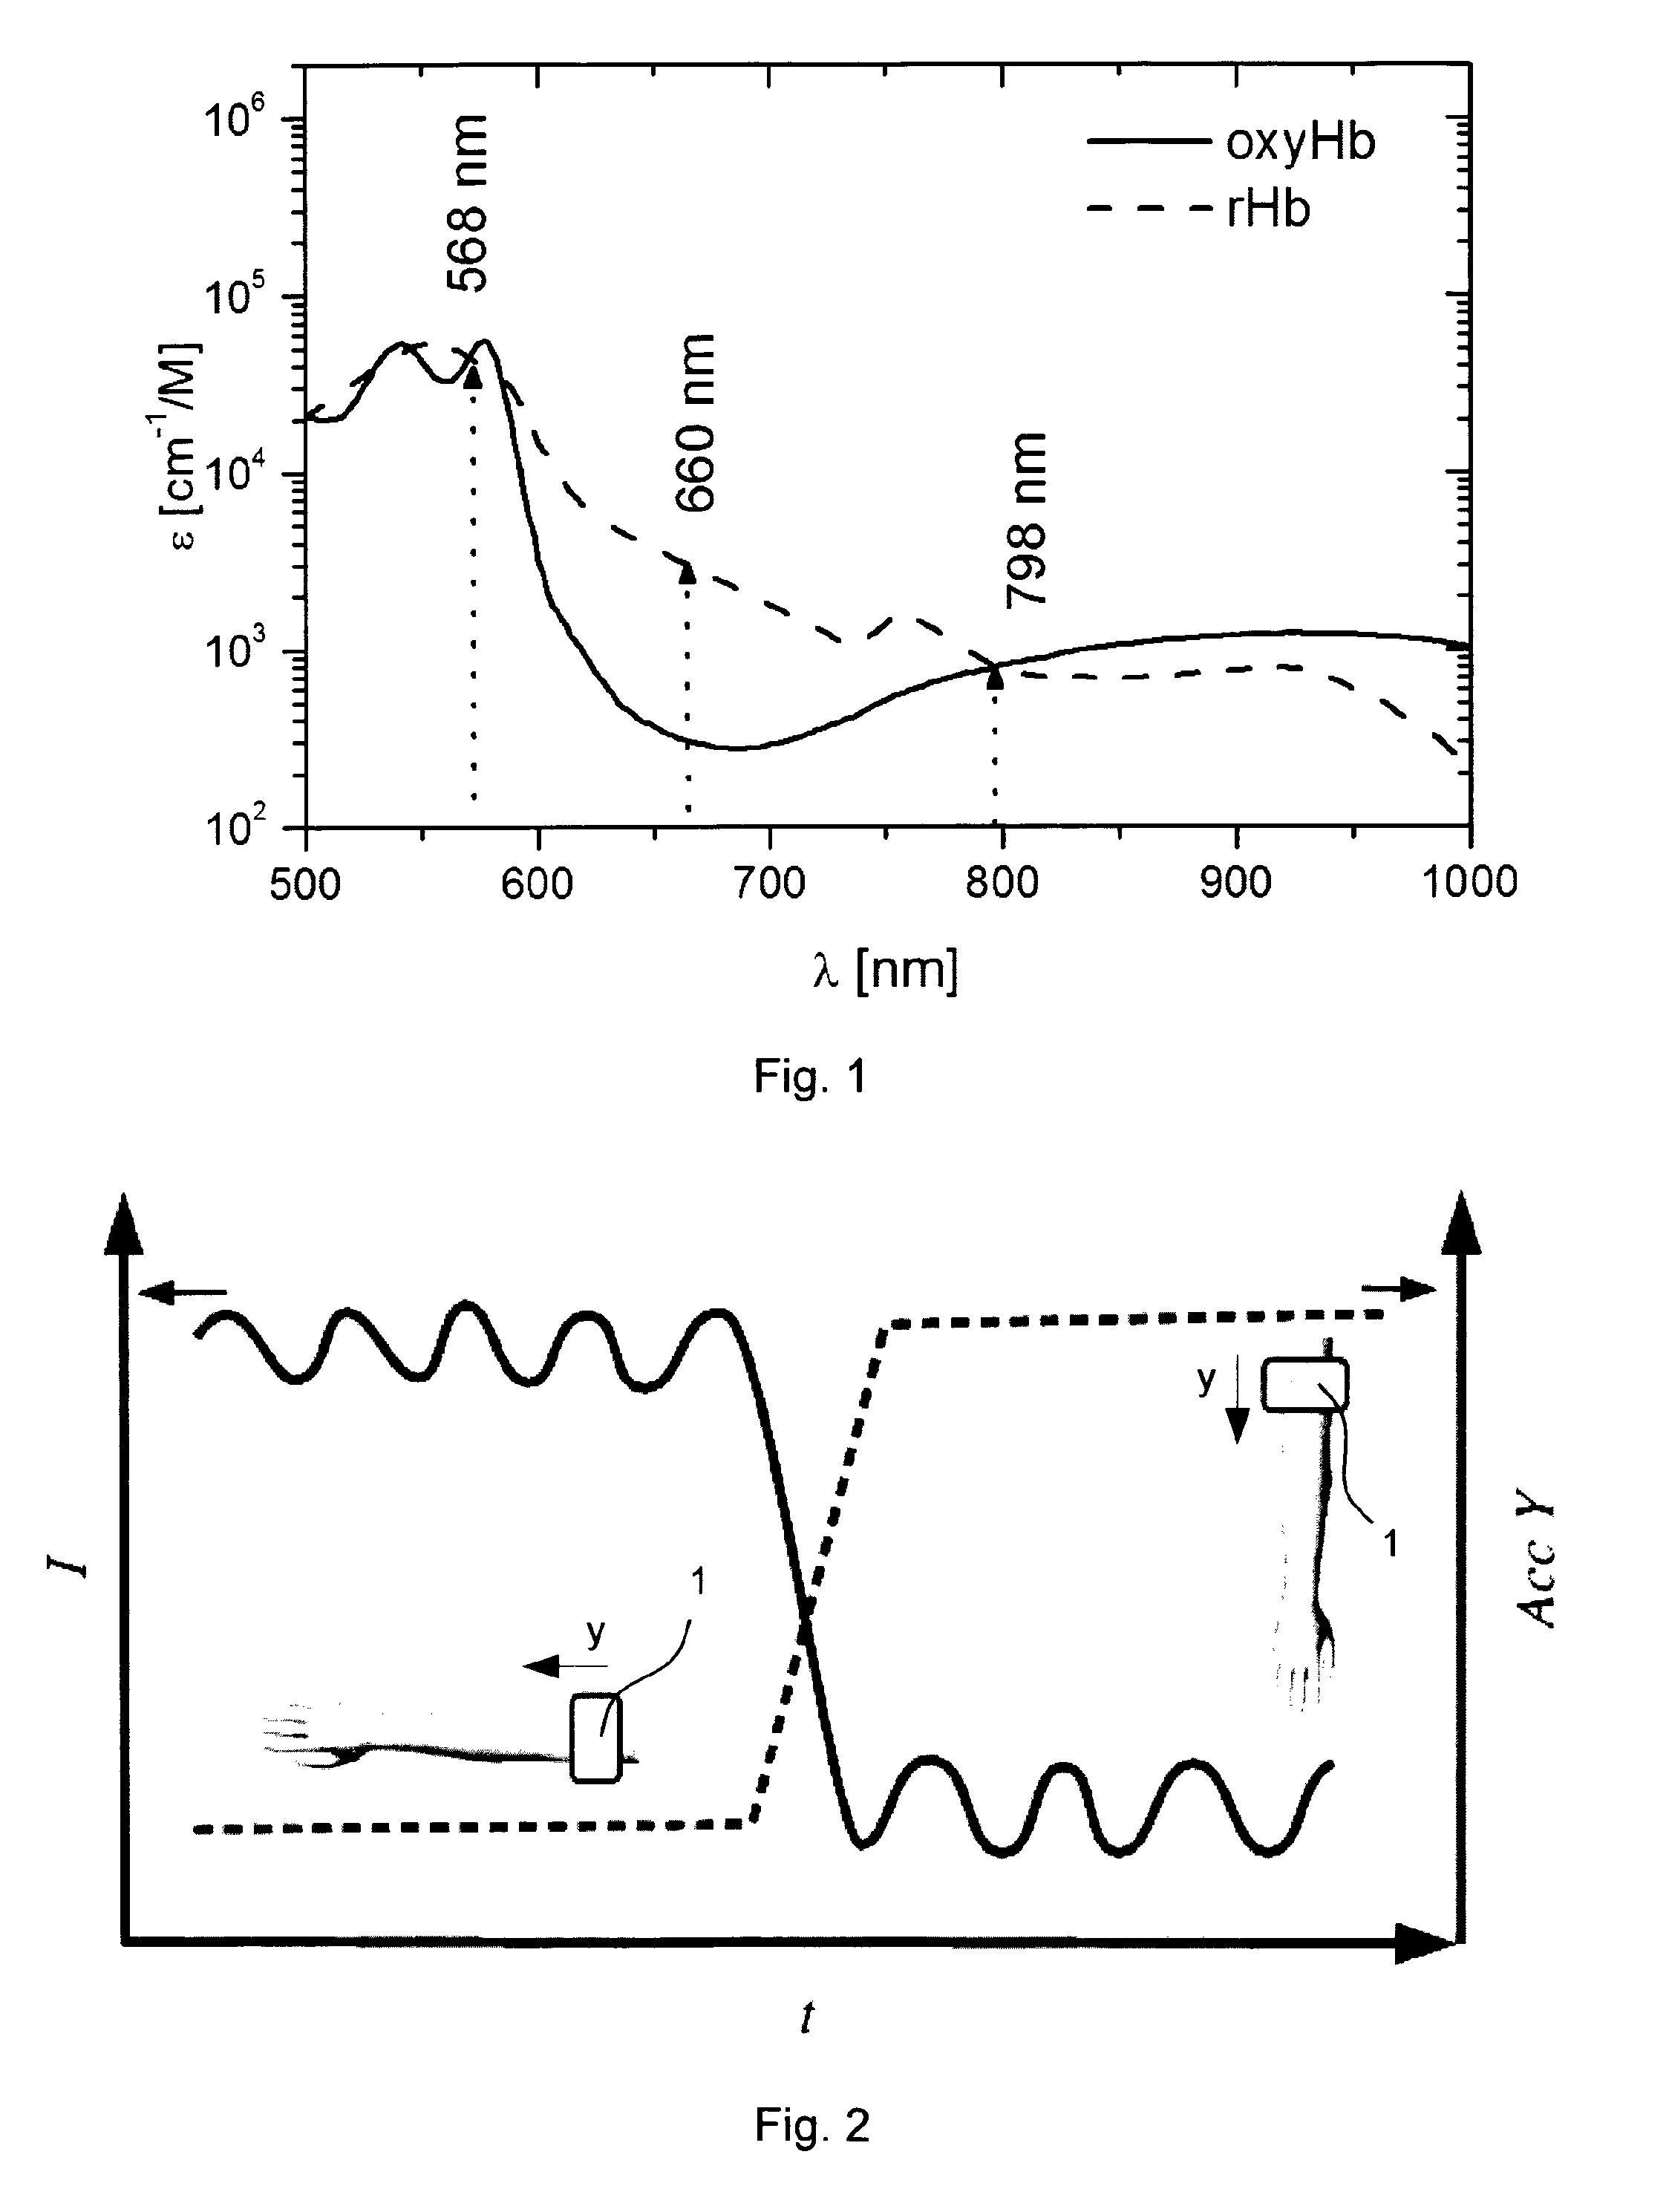
[0085]FIG. 1 schematically shows a graph with the absorbance of oxygenated hemoglobin (oxyHb) and reduced hemoglobin (rHb) in dependence of the wavelength of light. The vertical axis s of the graph represents the absorbance i.e. a molar extinction coefficient [cm−1 / M] which measures how strongly chemical species (in this case oxyHb and rHb) absorb light. The horizontal axis λ of the graph represents the wavelength [nm] of the light. Vertical dotted lines represent wavelengths chosen for one embodiment as described above. Two of these wavelengths are isosbestic points: a green isosbestic point at 568 nm and an infrared isosbestic point at 798 nm. Isosbestic points correspond to a wavelength where oxyHb and rHb exhibit the same absorbance. A red wavelength at 660 nm represents a point with a large difference i.e. a large contrast in the absorbance of oxyHb and rHb.
[0086]A difference in the absorbance of oxygenated and reduced hemoglobin as for example in the red range at 660 nm can be...
PUM
 Abstract
Description
Claims
Application Information