Data processing system and program for chromatograph mass spectrometer

Active Publication Date: 2017-03-09
SHIMADZU CORP
View PDF3 Cites 5 Cited by
  • Summary
  • Abstract
  • Description
  • Claims
  • Application Information

AI Technical Summary

Benefits of technology

[0026]As described thus far, with the data processing system for a chromatograph mass spectrometer according to the first or second aspect of the present invention, even when the mass chromatogram at the target mass-to-charge ratio is distorted or saturated, it is possible to create a true mass chromatogram at the target mass-to-charge ratio or obtain the true peak height or peak area at the target mass-to-charge ratio by using a mass chromatogram at the correction mass-to-charge ratio at which neither the distortion nor saturation is present.
[0027]Therefore, even the quantity of a high concentration sample that would need to be diluted in the conventional case can be correctly determined without dilution, so that the amount of labor for the analysis will be reduced. In the case of the measurement of a samp

Problems solved by technology

In general, such a data processing system has limits on the magnitude of the signal that can be processed, due to hardware limitations of the signal-processing circuits including an A/D converter.
The system cannot correctly perform calculations if the magnitude of the input signal is higher than the upper limit or lower than the lower limit.
Besides such a limitation related to signal processing, ion detection by a mass spectrometer involves the problem that th

Method used


Image

  • Data processing system and program for chromatograph mass spectrometer
  • Data processing system and program for chromatograph mass spectrometer
  • Data processing system and program for chromatograph mass spectrometer

Examples


embodiment 1

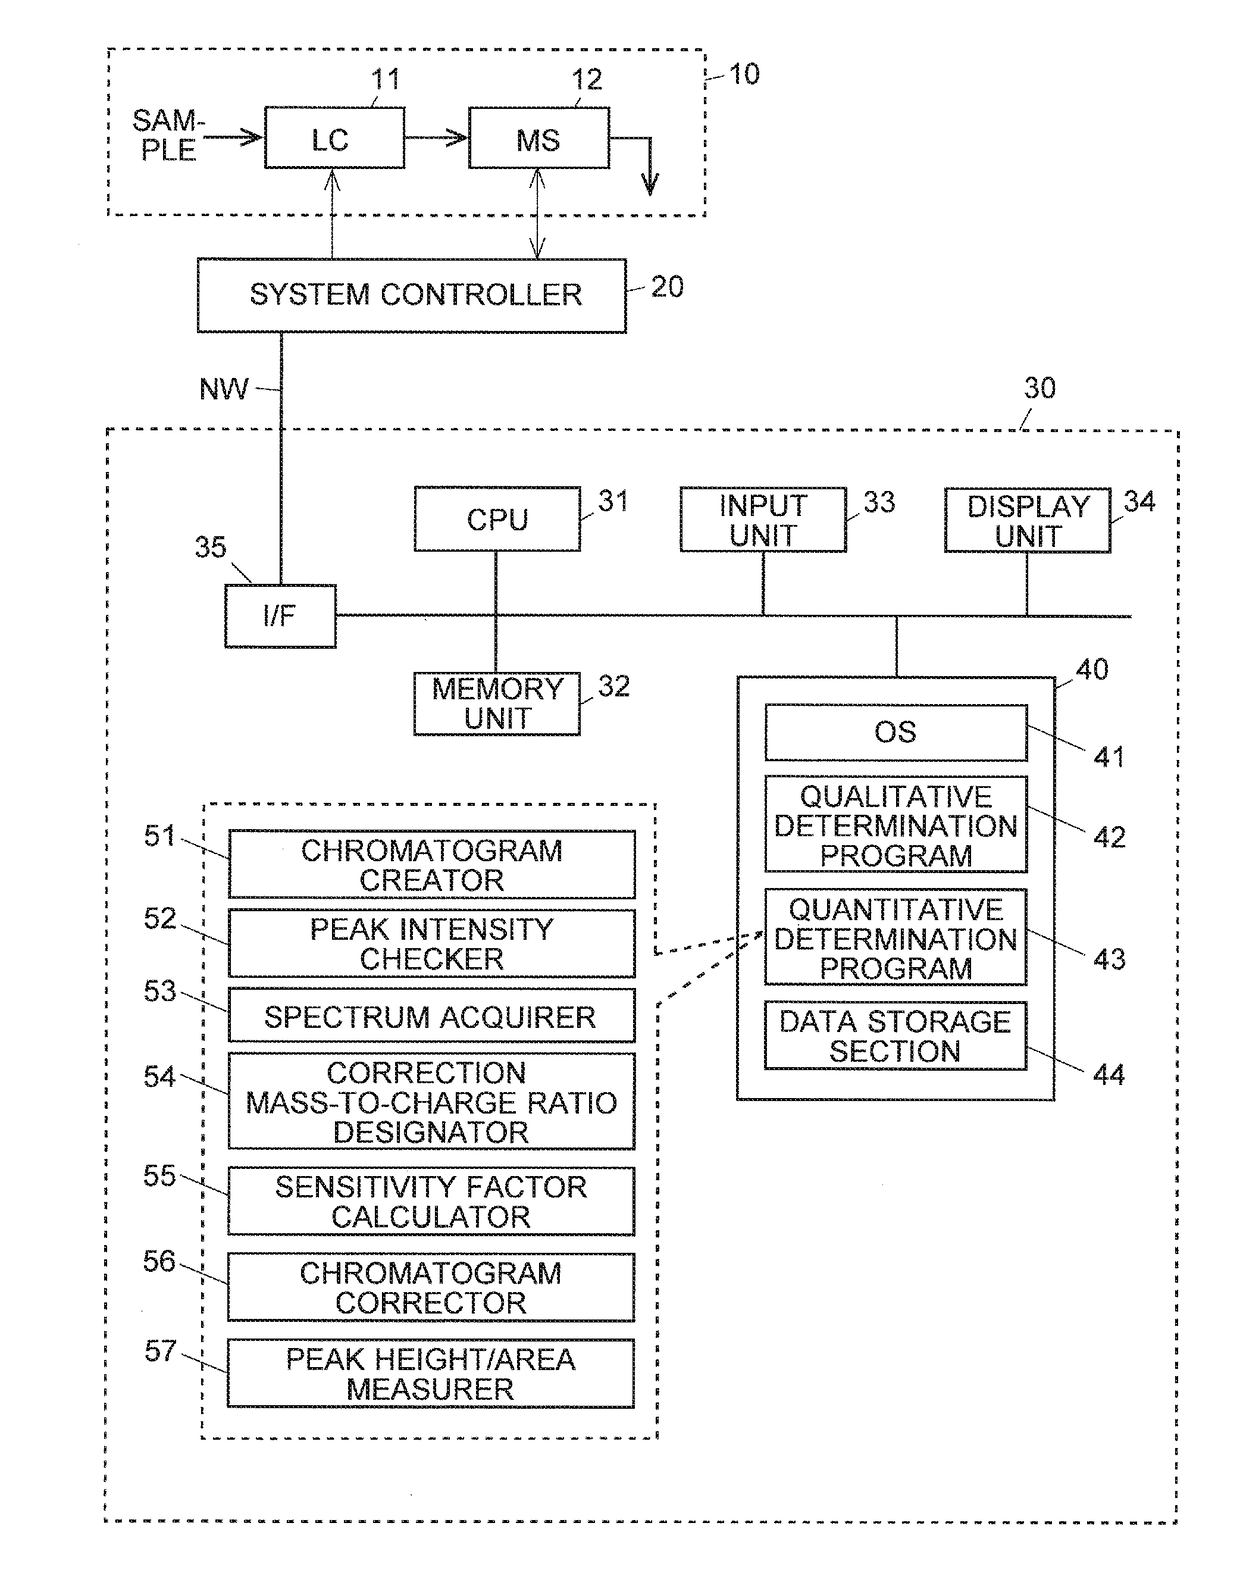
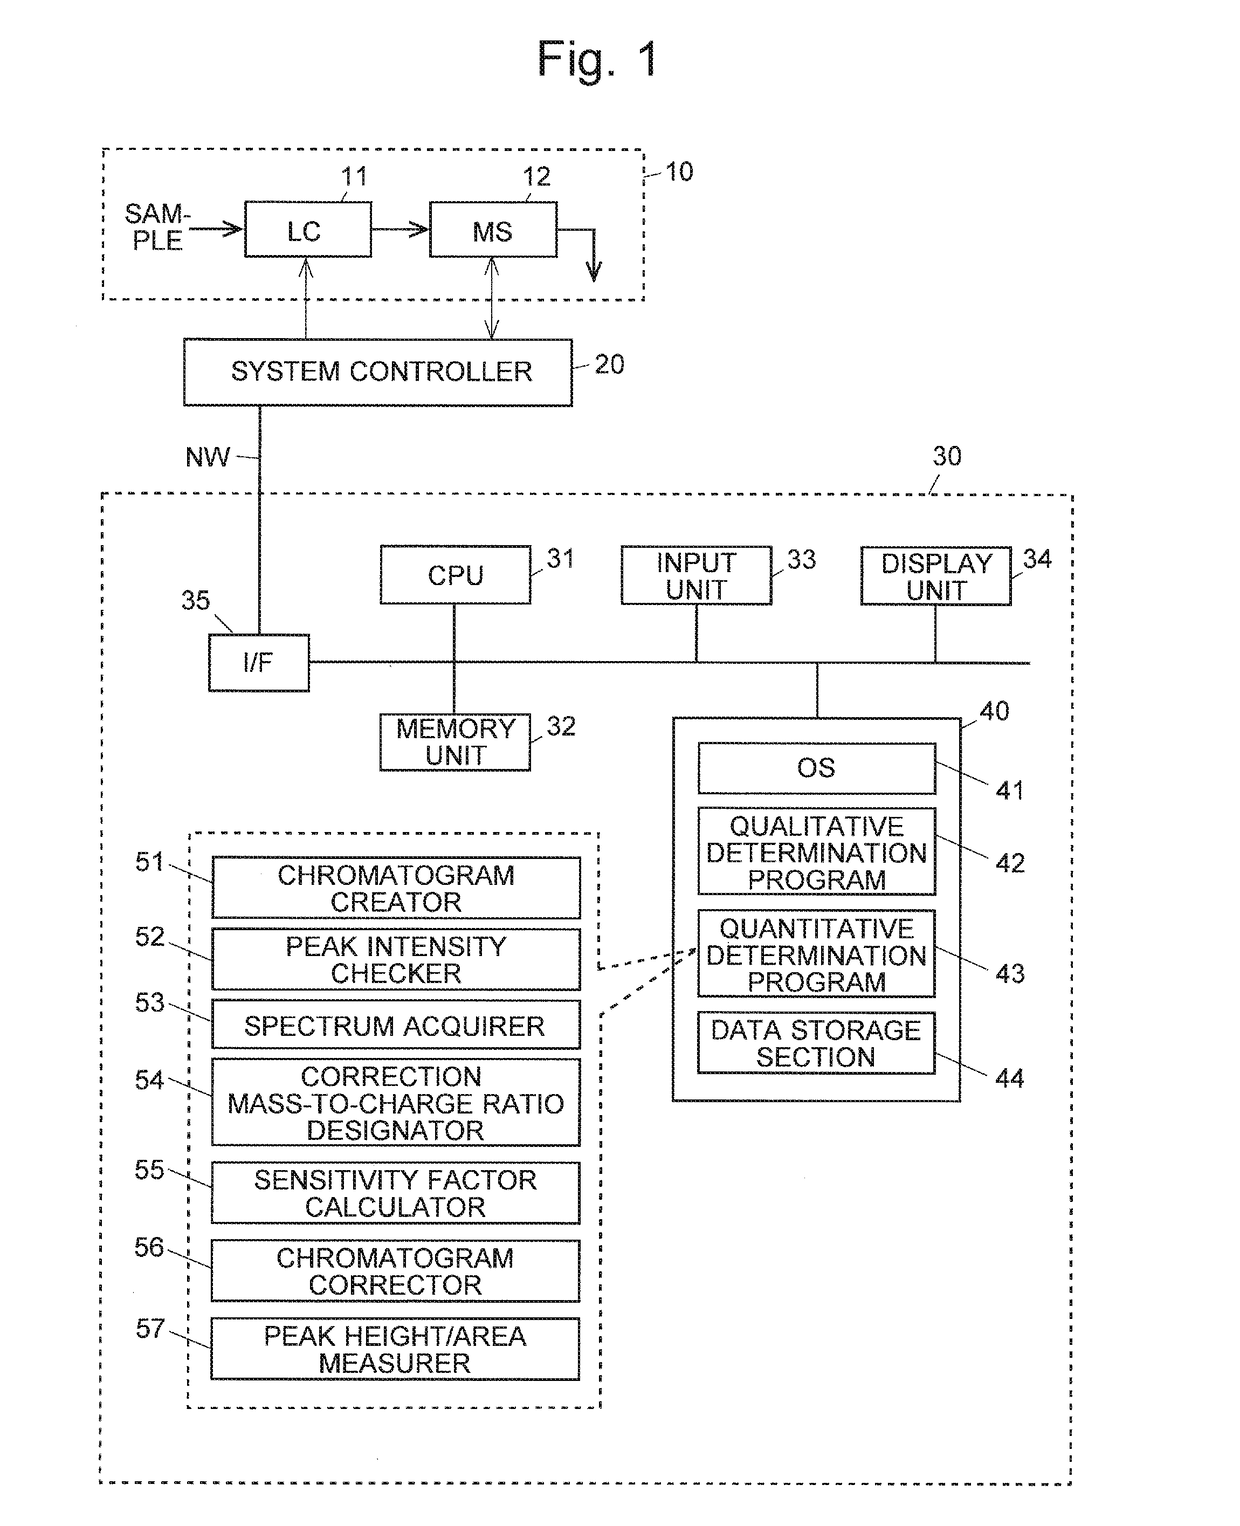
[0039]FIG. 1 is a schematic configuration diagram of a sample analyzing system including a data processing system for a chromatograph mass spectrometer according to the present embodiment. This sample analyzing system is composed of: a liquid chromatograph mass spectrometer (LC-MS) 10 in which a liquid chromatograph (LC) 11 for temporally separating the components contained in a liquid sample is connected to a mass spectrometer (MS) 12 for analyzing each of the separated components within a predetermined mass-to-charge-ratio range; a system controller 20 connected to the LC-MS 10; and a data processing system 30 for processing data fed from the LC-MS 10 via the system controller 20.

[0040]The data processing system 30 is actually a computer, such as a workstation or personal computer, including a central processing unit (CPU) 31 with the following units connected to each other: a memory unit 32; an input unit 33 including a keyboard, mouse and / or other devices; a display unit 34, suc...

embodiment 2

[0055]The second embodiment of the present invention is hereinafter described with reference to FIGS. 9 and 10. FIG. 9 is a schematic configuration diagram of a sample analyzing system including a data processing system 30a for a chromatograph mass spectrometer according to the present embodiment. The sample analyzing system according to the present embodiment is identical to the system of Embodiment 1 except that a corresponding peak height / area measurer 58 and a peak height / area corrector 59 are provided as the functional blocks of the quantitative determination program 43a in place of the previously described chromatogram corrector 56 and the peak height / area measurer 57 (hereinafter, the components that are common to both the present embodiment and Embodiment 1 are denoted by the same numerals, and the descriptions of those components will be appropriately omitted).

[0056]In the sample analyzing system according to the previously described Embodiment 1, the true mass chromatogram...


PUM


Abstract

In a chromatogram mass spectrometer's data processing system, if the intensity of a target peak originating from a target component at a target mass-to-charge ratio is equal to or higher than a threshold, the mass-to-charge ratio of a peak having a signal intensity lower than the threshold on the mass spectrum corresponding to the point in time where the target peak appears is designated as a correction mass-to-charge ratio. A mass spectrum at a point in time in the target peak where the signal intensity does not exceed the threshold is acquired. A sensitivity factor is calculated by dividing the strength at the target mass to-charge ratio on this mass spectrum by the strength at the correction mass to-charge ratio on the same spectrum. A mass chromatogram at the correction mass-to-charge ratio is created. This mass chromatogram is multiplied by the sensitivity factor to create a corrected mass chromatogram.

Description

TECHNICAL FIELD[0001]The present invention relates to a data processing system and program for a chromatograph mass spectrometer including a chromatograph (such as a liquid chromatograph or gas chromatograph) coupled with a mass spectrometer.BACKGROUND ART[0002]In a chromatograph mass spectrometer, three-dimensional data consisting of the three axes of time, mass-to-charge ratio and signal intensity (e.g. output voltage) are collected by temporally separating the components in a sample with the chromatograph and acquiring a mass spectrum with the mass spectrometer by sequentially analyzing each component eluted from the chromatograph (for example, see Patent Literature 1). In a data processing system for a chromatograph mass spectrometer, a peak which appears on such three-dimensional data is detected, and the substance corresponding to that peak is identified from the peak position (retention time and mass-to-charge ratio) with reference to a previously-set identification table. Ad...

Claims


Application Information

Patent Timeline
IPC IPC(8): G01N30/86G01N30/72
CPCG01N30/8658G01N30/8631G01N30/7233G01N30/8675H01J49/0036H01J49/0031
Inventor SHIMOMURA, MANABUTANAKA, KAORI
Owner SHIMADZU CORP
Why Eureka
Try Eureka