Methods for determining oil and water compositions in drilling muds
a technology of oil and water composition and drilling mud, which is applied in the field of magnetic resonance diagnostic schemes, can solve the problems of time-consuming cleaning of devices, slow measurement procedure, and inability to perform only a small volume of drilling material samples, and achieve the effect of shortening relaxation tim
- Summary
- Abstract
- Description
- Claims
- Application Information
AI Technical Summary
Benefits of technology
Problems solved by technology
Method used
Image
Examples
example 1
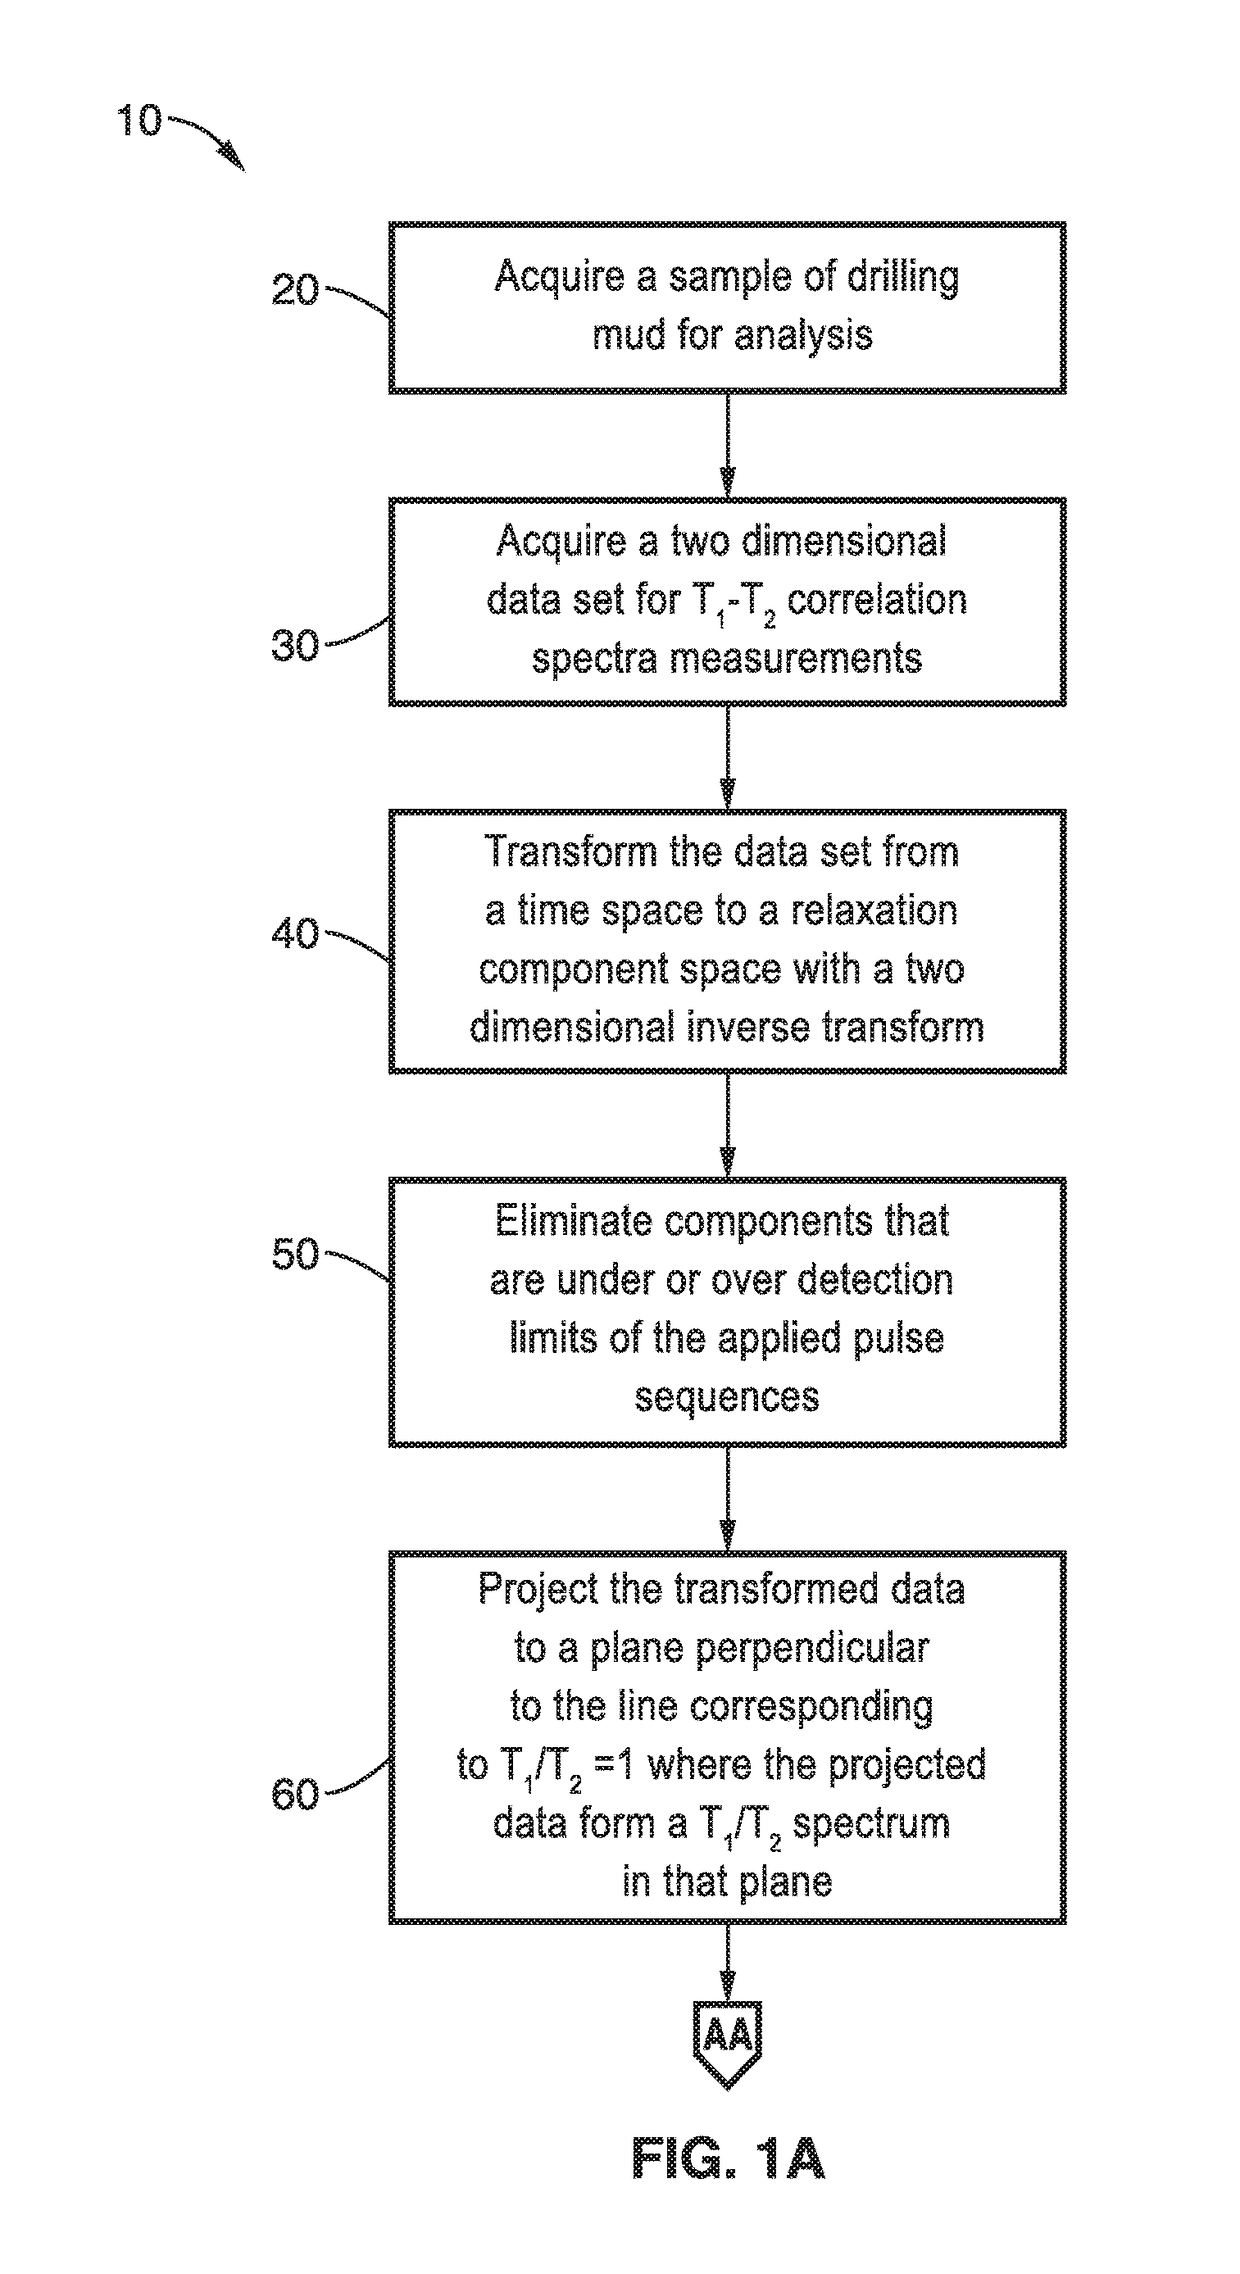
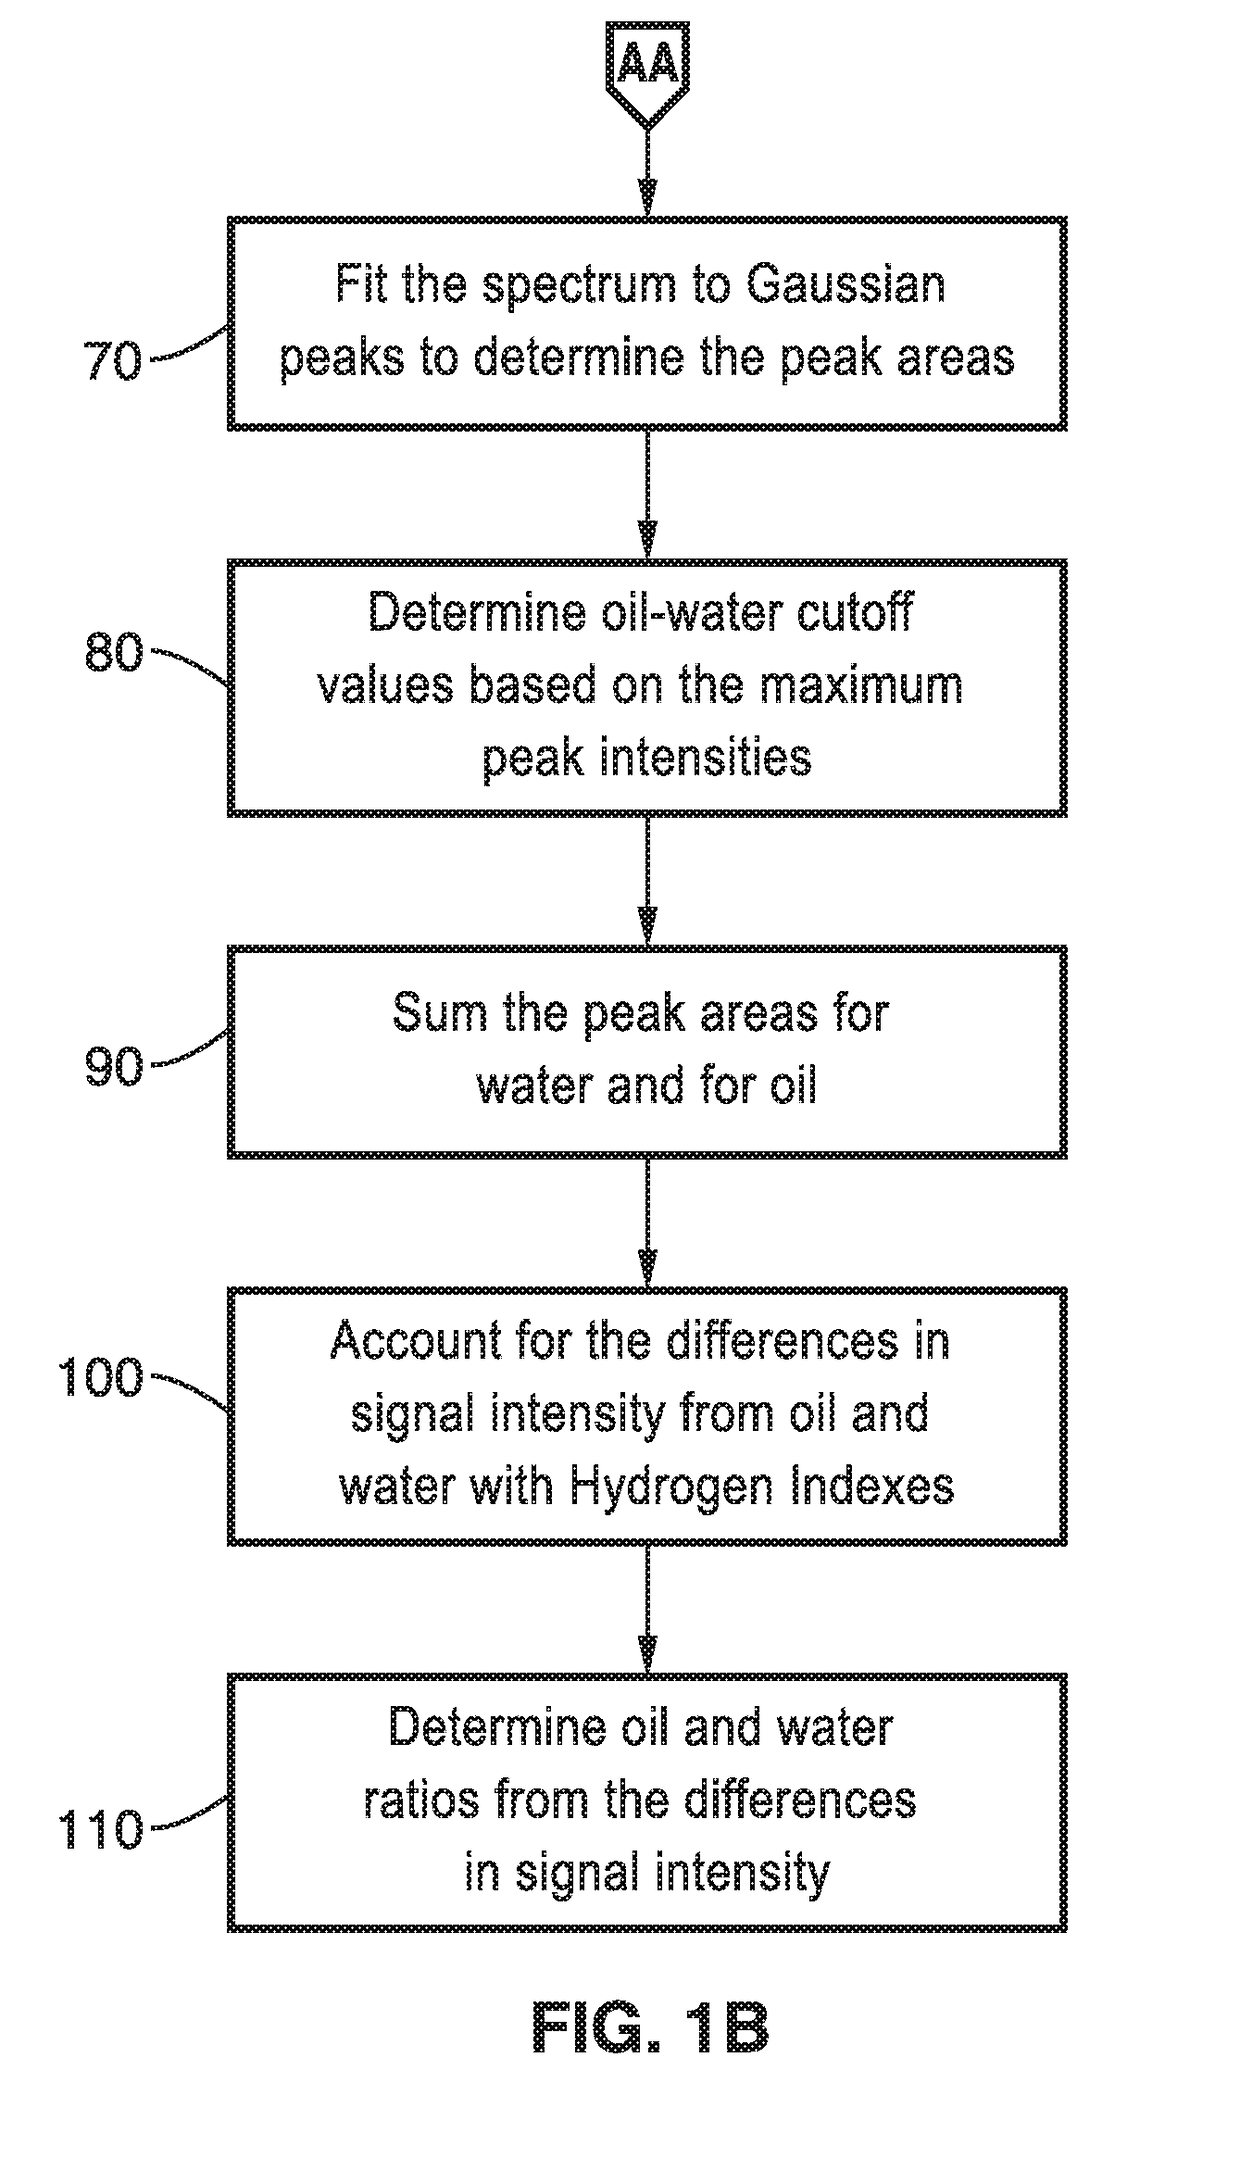
[0041]In order to demonstrate the technology, analysis of different samples of drilling mud with a range of water and oil percentages was conducted. Water cut measurements were performed on the well blended samples that were loaded into small vials. The range of water cut of interest is 10% -30%. A mud with 28.57% water cut was used as the base mud. Different amounts of diesel were added to the base mud to create various samples of mud with different water cut percentages within the range of interest. Water was added to drilling mud samples to increase their water fraction [m / m]. As the water percentage was increased, the ratio of the signals from the transformed data gave a linear response. Based on the water added, the original water content could also be determined.
[0042]The first method tested for the NMR measurement of watercut of the samples was the one-dimensional NMR method. The one-dimensional method only used with drilling muds that show a distinctive separation of water a...
example 2
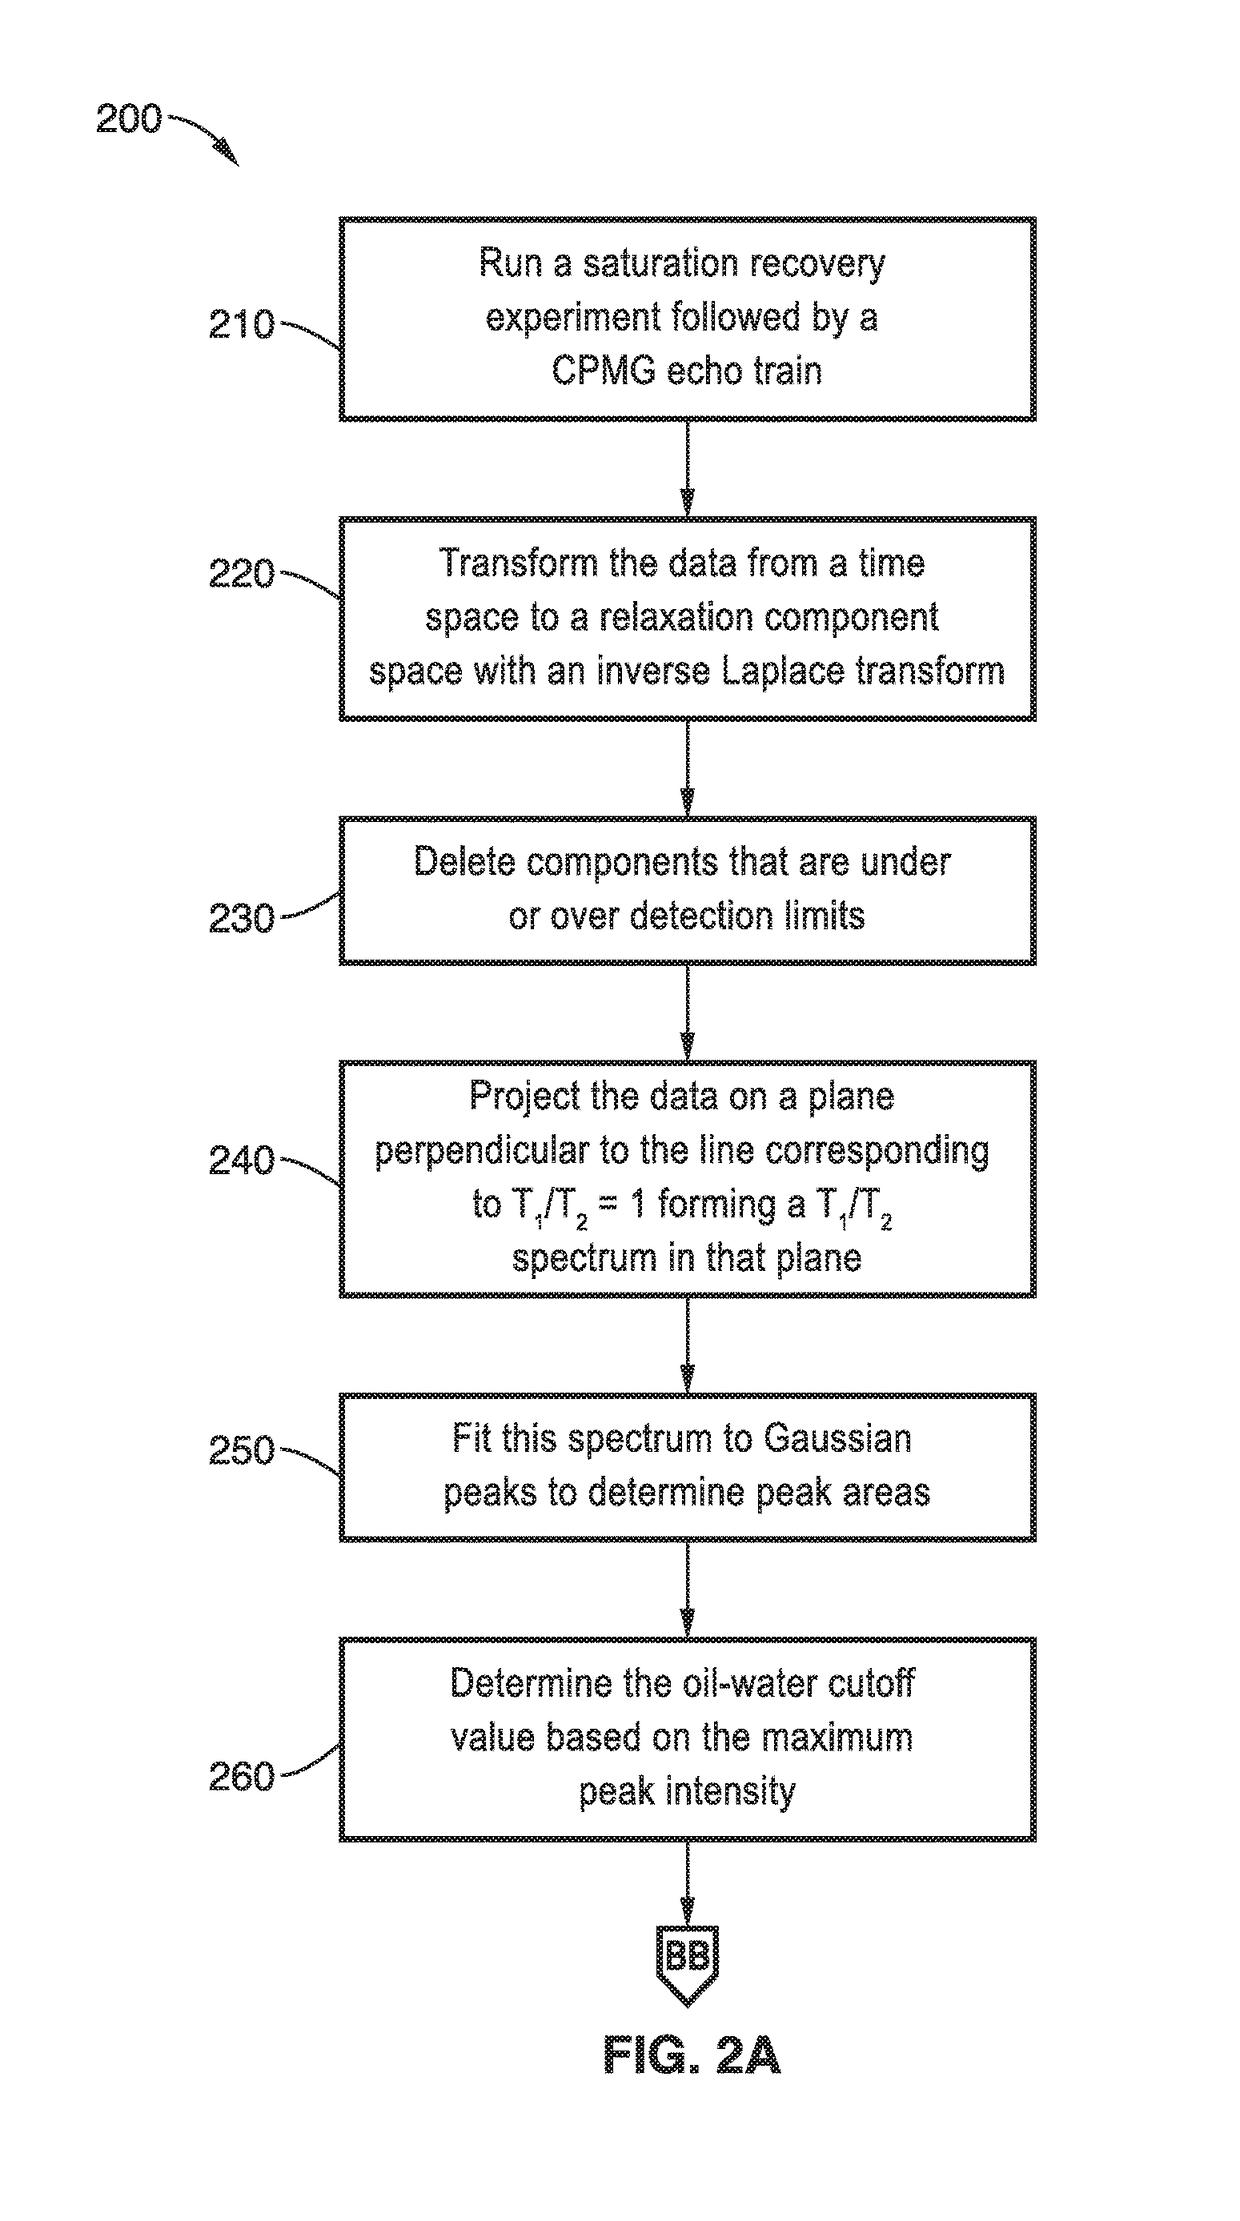
[0044]To further demonstrate the operational principles of the methods, a variety of drilling muds with differing oil and water contents were analyzed using a two-dimensional method. Referring now to FIG. 2A and FIG. 2B, an illustration of the method 200 using a two-dimensional approach is shown schematically. Drilling mud was placed in the NMR spectrometer or pumped to the coil of the spectrometer in a flow setup. The sample was measured using a saturation recovery sequence followed by a CPMG echo train with optimized parameters at block 210 of FIG. 2A.
[0045]The saturation recovery pulse sequence was used to record the T1 relaxation behavior, and the CPMG sequence was used to capture the T2 relaxation behavior for each of the delay or repetition times in the saturation recovery pulse sequence.
[0046]The T1-T2 relaxation data was transformed at block 220 to a two dimensional T1-T2 correlation spectrum using a two dimensional inverse Laplace transformation. The components that were ob...
PUM
 Abstract
Description
Claims
Application Information
 - R&D
- Intellectual Property
- Life Sciences
- Materials
- Tech Scout
- Unparalleled Data Quality
- Higher Quality Content
- 60% Fewer Hallucinations
Browse by: Latest US Patents, China's latest patents, Technical Efficacy Thesaurus, Application Domain, Technology Topic, Popular Technical Reports.
© 2025 PatSnap. All rights reserved.Legal|Privacy policy|Modern Slavery Act Transparency Statement|Sitemap|About US| Contact US: help@patsnap.com


