Mass spectrometry imaging of glycans from tissue sections and improved analyte detection methods

a mass spectrometry and tissue section technology, applied in the field of mass spectrometry imaging of glycans from tissue sections and improving analyte detection methods, can solve the problems of compromising the sensitivity and detectability of low-abundance analytes, few monoclonal antibodies have been developed for glycans, and ineffective analysis of low-abundance molecules from complex mixtures. achieve the effect of improving the limit of detection of one or mor

Active Publication Date: 2018-07-12
THE JOHN HOPKINS UNIV SCHOOL OF MEDICINE
View PDF2 Cites 0 Cited by
  • Summary
  • Abstract
  • Description
  • Claims
  • Application Information

AI Technical Summary

Benefits of technology

[0009]In accordance with still another embodiment, the present invention provide a method for improving the limit of detection of one or more target analytes in a sample, the method comprising: a) obtaining a sample; b) adding to the sample a known concentration of one or more target analytes; c) applying the sample to a matrix; d) analyzing the at least one target analyte using mass spectrometry wherein the limit of detection of the one or more target analytes is calculated using the formula Signal (C+LODc)=Signal (C)+3SDc.

Problems solved by technology

Despite the impact the lectin chemistry has had on the field, it has limitations.
Further, very few monoclonal antibodies have been developed for glycans.
Although MALDI-TOF MS has been successfully applied for detection, identification and validation of many peptides and molecules, it has proven ineffective for analyzing low abundance molecules from complex mixtures.
In addition, background and chemical noise (coming from desorbed matrix cluster) interfere with the MS signal and further compromise the sensitivity and detectability for low-abundance analytes.
Despite the technological advances in MALDI-TOF instrumentation, the suboptimal transmission efficiency of the mass analyzer, and detection efficiency of the detector, also result in some loss of analyte, which is another factor that reduces the detection limit and sensitivity of MALDI-TOF MS with low-abundant analytes.

Method used


Image

  • Mass spectrometry imaging of glycans from tissue sections and improved analyte detection methods
  • Mass spectrometry imaging of glycans from tissue sections and improved analyte detection methods
  • Mass spectrometry imaging of glycans from tissue sections and improved analyte detection methods

Examples


example 1

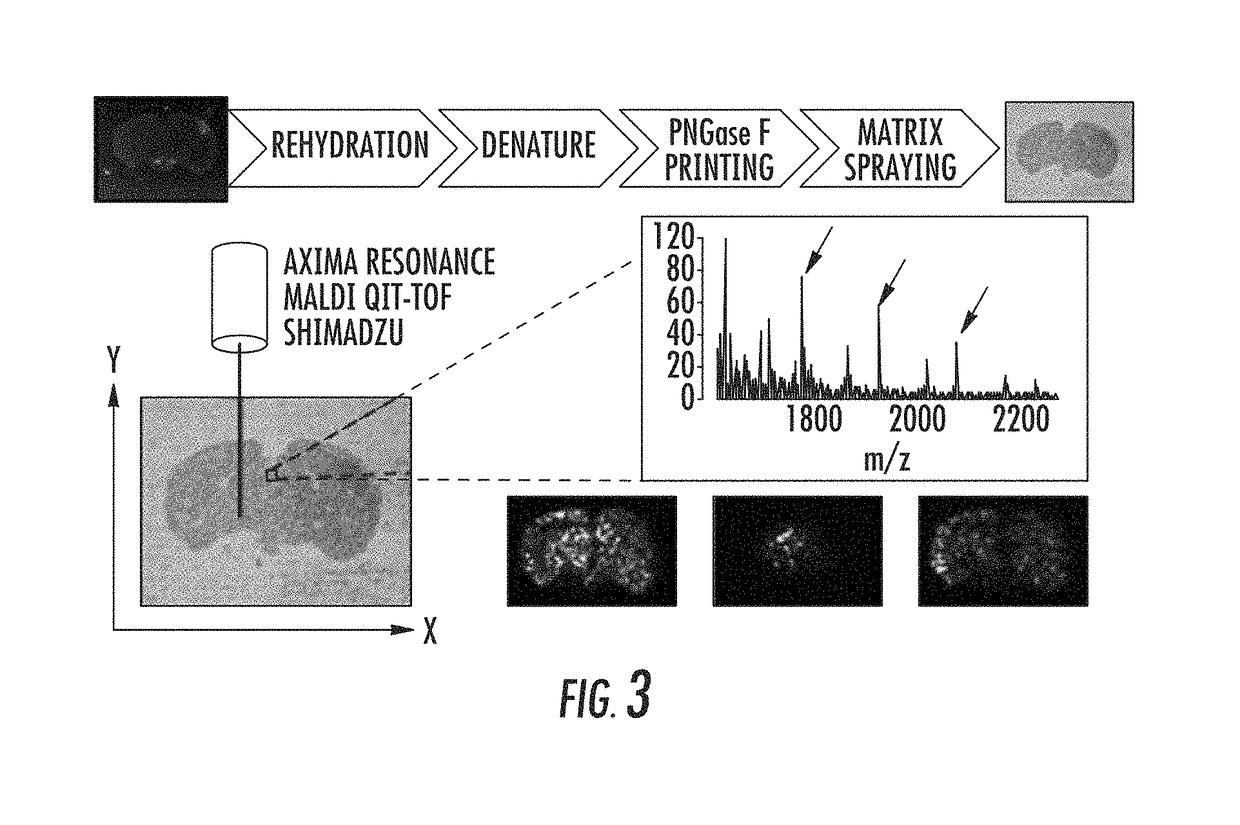
[0080]Mass spectrometry imaging of glycans from tissue section. FIG. 3 shows a representative schematic of an imaging platform using the inventive methods. A FFPE tissue section is rehydrated, the proteins in the tissue section are denatured, and microarray printing using the release agent PNGase F is allowed to occur. PNGase F is the enzyme that cleaves N-linked glycans from their host proteins. To preserve the spatial distribution of the glycans, a microarray printer can be used to apply the PNGase F on the tissue in a grid. Then, a matrix, such as 2,5-dihydroxybenzoic acid (DHB), can be sprayed over the tissue using an airbrush. The tissue can then be analyzed with a mass spectrometer (Axima Resonance MALDI QIT-TOF, Shimadzu). One difference between a conventional MALDI analysis and the methods of the present invention is that the tissue is raster scanned by the laser in the x and y directions and mass spectra are acquired for each pixel on the tissue. At this point, by mapping t...

example 2

[0088]Concentration Dependent Sensitivity and SD. Sensitivity and standard deviation (SD) of an analyte greatly depend on the concentration of the target analyte in the sample. To illustrate the dependence, we calculated the sensitivity and SD versus analyte concentration using Angiotensin II as an example and the results are shown in (FIG. 13). The calibration curve of Angiotensin II was generated by analyzing sequential dilutions of this peptide with the mass spectrometer. The sensitivity was calculated from the calibration curve by dividing the signal difference by the concentration difference for two adjacent data points at each concentration. The standard deviation was computed from ten normalized mass spectral signals and is denoted as SD. Due to the sigmoidal shape of the calibration curve (FIG. 11 and FIG. 13A), the sensitivity, i.e. the slope of this curve stays stable at its maximum value over the linear range of the assay, and decreases as the concentration falls below th...

example 3

[0089]Determining LODs of Target Analytes in Simple Mixture. To determine whether the LOD could be lower with the target analytes spiked in TAD solution, we analyzed the target peptides in different dilutions in control solution (which did not have any spiking target peptides added) and in various TAD solutions (which had a different amount of target peptides spiked in the solution). The mass spectral peaks of Angiotensin I is depicted in FIG. 14 for the control and the TAD solution group. For this peptide, the measured LODorig was 64.5 fmol / μL. Therefore, the mass spectral peak of Angiotensin I (ma=1296.685), averaged over the ten measurements, is not distinguishable from the background at concentration of 31.25 fmol / μL (FIG. 14A). By spiking the target analyte with a concentration C=50 fmol / μL, the spectral signal is boosted and the LOD reduces to 22.5 fmol / μL. Consequently, as shown in FIG. 14B, the averaged mass spectral peak of Angiotensin I at the endogenous concentration of 3...


PUM

PropertyMeasurementUnit
concentrationsaaaaaaaaaa
massaaaaaaaaaa

Abstract

The presently disclosed subject matter provides methods using mass spectrometry for direct profiling of N-linked glycans from a biological sample. In addition, the embodiments of the present invention also disclose novel methods, known as targeted analyte detection (TAD), for improving the detection limit of MALDI-MS. These methods take advantage of the carrier effect of the added standard analytes, which occurs due to the generic sigmoidal shape of the calibration curve. The functionality of TAD depends on the relative enhancement of sensitivity over the increase of the standard deviation at the analysis of target analytes with spiking in exogenous concentration. At certain ranges of exogenous concentration, the increment in the sensitivity overcomes the standard deviation, resulting in an improved LOD. Theoretically, exogenous concentrations approximately at 1 LODorig would generate the optimum LOD improvement. TAD is a cost-effective LOD improvement method, which is not limited to a certain group of analytes, or detection methods or instruments. It can be applied to enhance the detection of any analyte with different detection methods, provided that the analyte of interest can be extracted or is available in synthetic form.

Description

REFERENCE TO RELATED APPLICATIONS[0001]This application is a Continuation of U.S. patent application Ser. No. 14 / 402,478, filed Nov. 20, 2014, which is a 35 U.S.C. § 371 U.S. national entry of International Application PCT / US2013 / 042408, having an international filing date of May 23, 2013, which claims the benefit of U.S. Provisional Patent Application Nos. 61 / 650,646, filed on May 23, 2012, and 61 / 681,417, filed on Aug. 9, 2012, and 61 / 776,534, filed Mar. 11, 2013, which are hereby incorporated by reference for all purposes as if fully set forth herein.FEDERALLY SPONSORED RESEARCH OR DEVELOPMENT[0002]This invention was made with government support under U01CA152813 awarded by the National Institutes of Health (NIH). The government has certain rights in the invention.BACKGROUND OF THE INVENTION[0003]Glycans play multi-faceted roles in many biological processes and aberrant glycosylation is associated with most of the diseases that affect mankind. Glycans are post-translation modific...

Claims


Application Information

Patent Timeline
Patent Type & Authority Applications(United States)
IPC IPC(8): G01N33/68
CPCG01N2570/00G01N33/6851G01N2400/12G01N33/6842
Inventor ZHANG, HUILI, XINGDETOGHI ESHGHI, SHADI
Owner THE JOHN HOPKINS UNIV SCHOOL OF MEDICINE
Why Eureka
Try Eureka