

Therapeutic hydrogel device
a hydrogel and treatment technology, applied in the field of therapeutic hydrogel devices, can solve the problems of limited long-term function of encapsulated islets, poor viability, and associated tissue death at the islet core, and achieve the effects of improving metabolic activity, improving metabolism, and improving metabolic activity
- Summary
- Abstract
- Description
- Claims
- Application Information
AI Technical Summary
Benefits of technology
Problems solved by technology
Method used
Image

Examples
example 1
or Fabrication, Characterization of Microtissues and their Encapsulation in Alginate Microcapsules
1.1. Fabrication of Micromolded Agarose Hydrogels
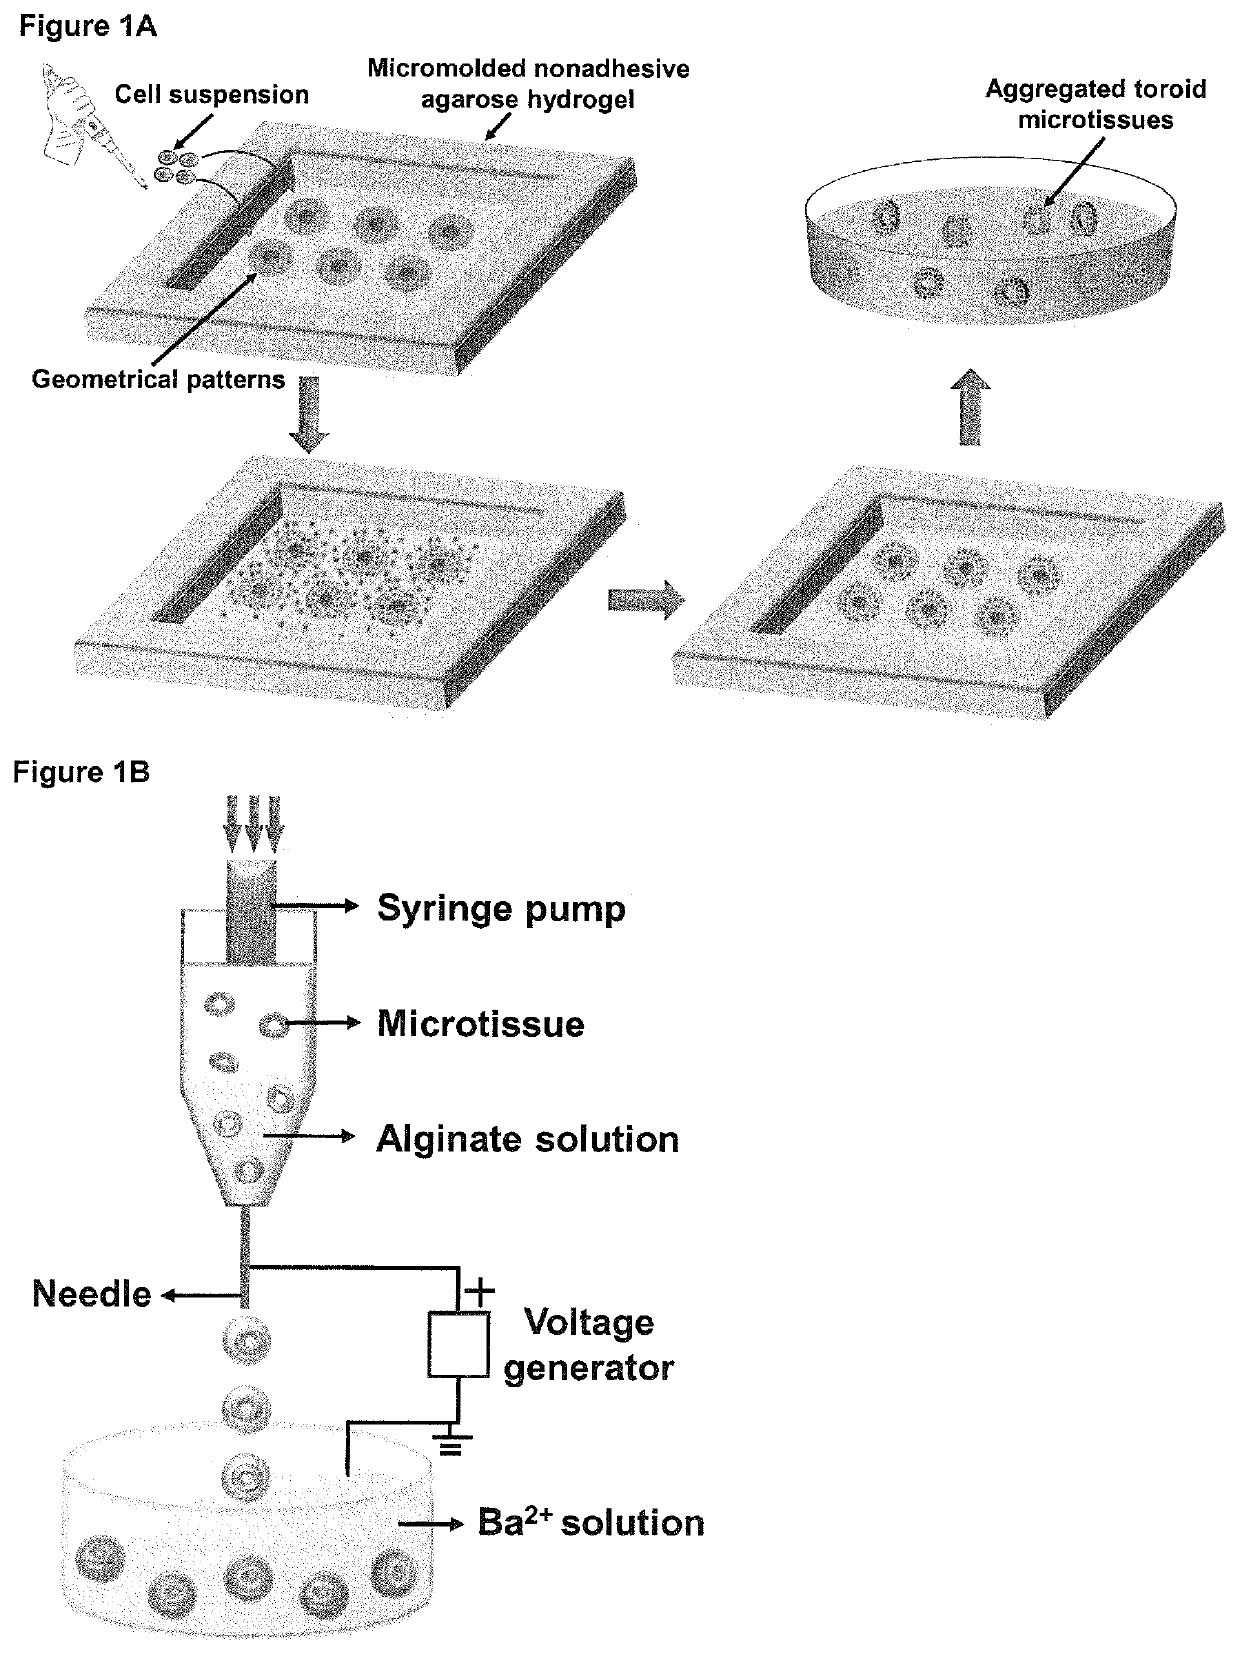
[0124]As illustrated in FIG. 1A, sSilicone templates 3D Petri Dish® (Sigma-Aldrich, USA) were utilized to prepare micropatterned agarose hydrogels consisting of multiple recesses with desired geometries [Napolitano, A. P. et al., Biotechniques, 43: 494, 496-500 (2007)]. Ultrapure© Agarose (Invitrogen, Carlsbad, USA) powder was autoclaved and dissolved by heating in sterile Mili-Q water to form a 2.3% (w / w) solution which was subsequently added into each silicon template and allowed to solidify at room temperature for 25 min. Afterwards, solidified micromolded agarose hydrogels were detached from the silicone template using a spatula and transferred to a sterilized 6-well tissue culture plate. Each micromolded agarose hydrogel was equilibrated with 3 mL of culture medium overnight before cell seeding. Toroid-fabricating recesses, arranged ...
example 2
Formation of Islet-Like Toroidal Microtissues on Hydrogel Micromold
[0134]Microtissues with controlled geometries were fabricated using micromolded nonadhesive agarose hydrogel as shown in the schematic diagram of FIG. 1A. Agarose hydrogels have been used to produce three-dimensional (3D) multi-cellular aggregates due to its cytocompatibility, nonadherent property and ease of physical crosslinking at room temperature [Napolitano, A. P. et al., Biotechniques 43 (4): 494-500 (2007)]. In this example, agarose solution (2.3% w / w) was brought into contact with autoclaved silicone templates containing arrays of features with desired geometries and were left to solidify at room temperature to form micromolded agarose hydrogel. Upon removal, the agarose hydrogels contained precise negative replicates of the geometrical patterns on their corresponding silicone templates. Previous studies reported that dispersed rat hepatoma, human fibroblasts and human umbilical vein endothelial cells were ab...
example 3
Effect of Initial Cell Seeding Density on Microtissue Size and Viability
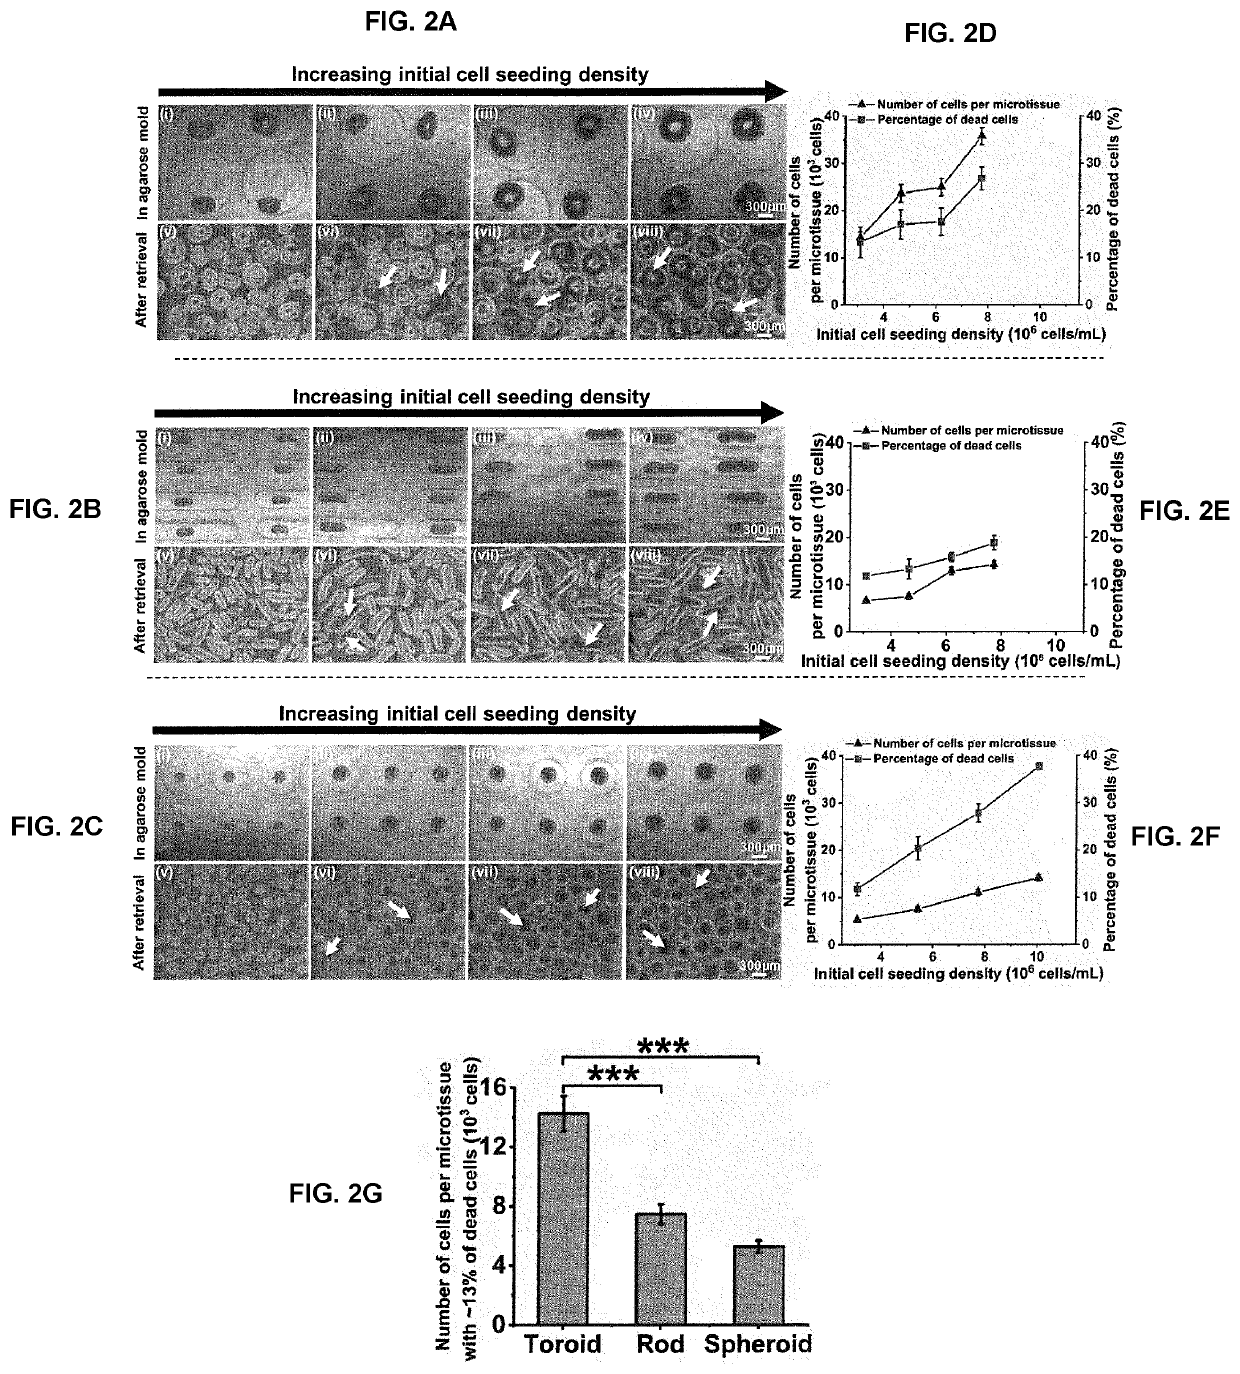
[0135]The inventors evaluated the feasibility of fabricating INS-1E islet-like microtissues with different geometries and the ability to tune microtissue size by varying initial cell seeding density. The optical images in FIGS. 2A(i-iv), B(i-iv) and C(i-iv) showed the formation of microtissues with toroid, rod and spheroid geometries in the micromolded agarose hydrogels as dictated by the shapes of the recesses. FIG. 2A(v-viii), B(v-viii), C(v-viii) are bright-field images of these microtissues after their retrieval from the agarose hydrogels by pipetting. The similar morphologies of the microtissues before and after retrieval confirmed that the structural integrity of most microtissues was not compromised by this process.
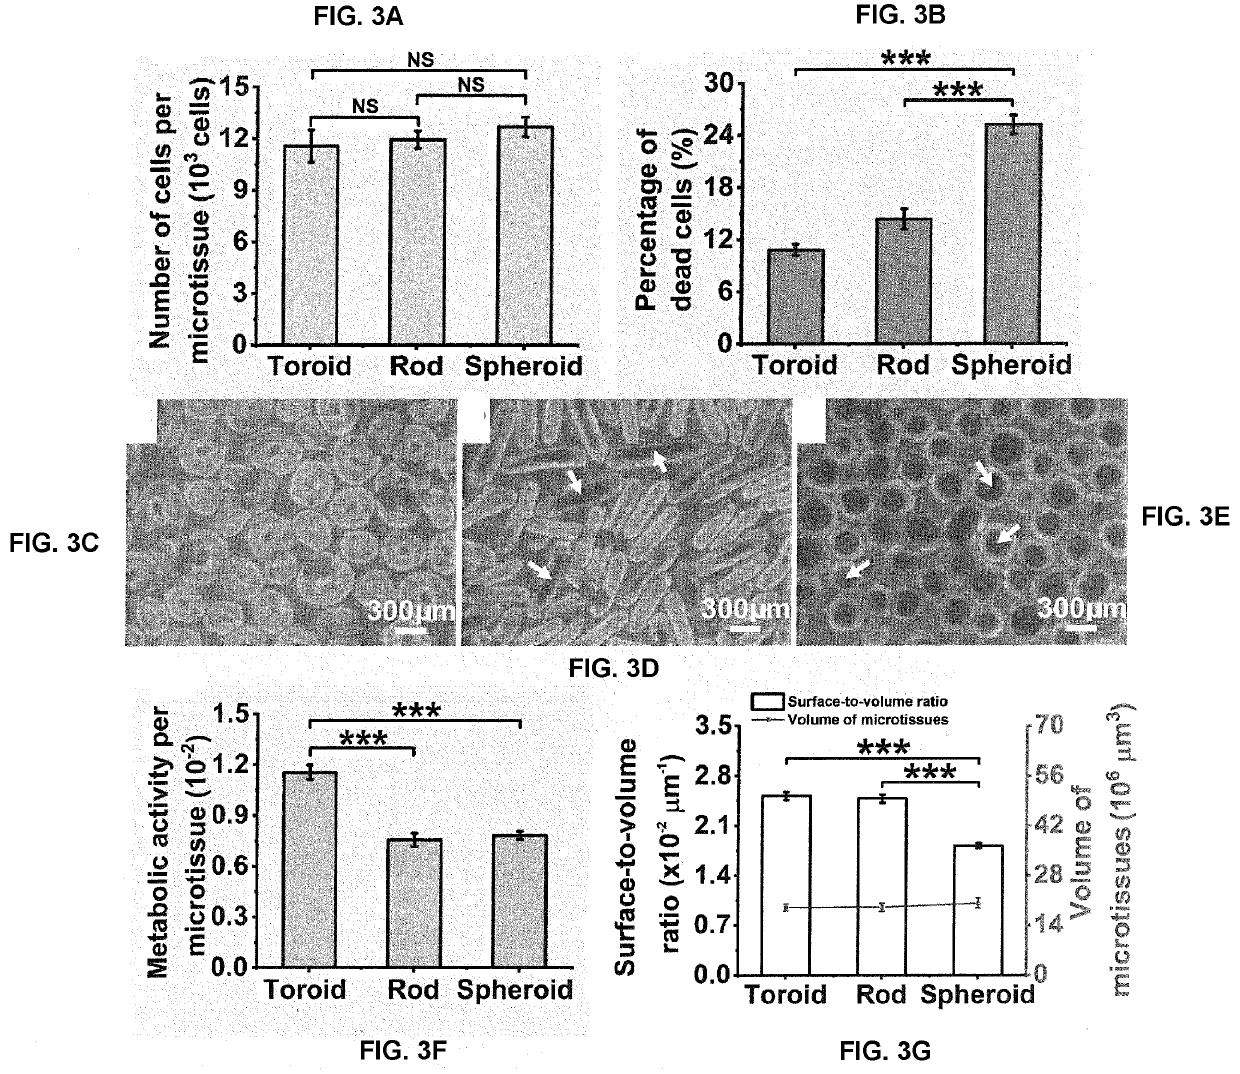
[0136]It was previously reported that cell viability decreased with increasing size of human islets [Komatsu, H. et al., PloS one 12 (8): e0183780 (2017)]. To quantitatively explore the relatio...
PUM
| Property | Measurement | Unit |
|---|---|---|
| width | aaaaa | aaaaa |
| width | aaaaa | aaaaa |
| width | aaaaa | aaaaa |
Abstract
Description
Claims
Application Information