

Method for Detecting Analyte and System for Detecting Analyte
a technology for detecting analyte and system, applied in the field of detecting analyte and system for detecting analyte, can solve the problem of taking several hours to detect analyte by any method
- Summary
- Abstract
- Description
- Claims
- Application Information
AI Technical Summary
Benefits of technology
Problems solved by technology
Method used
Image

Examples
first embodiment
[0088]
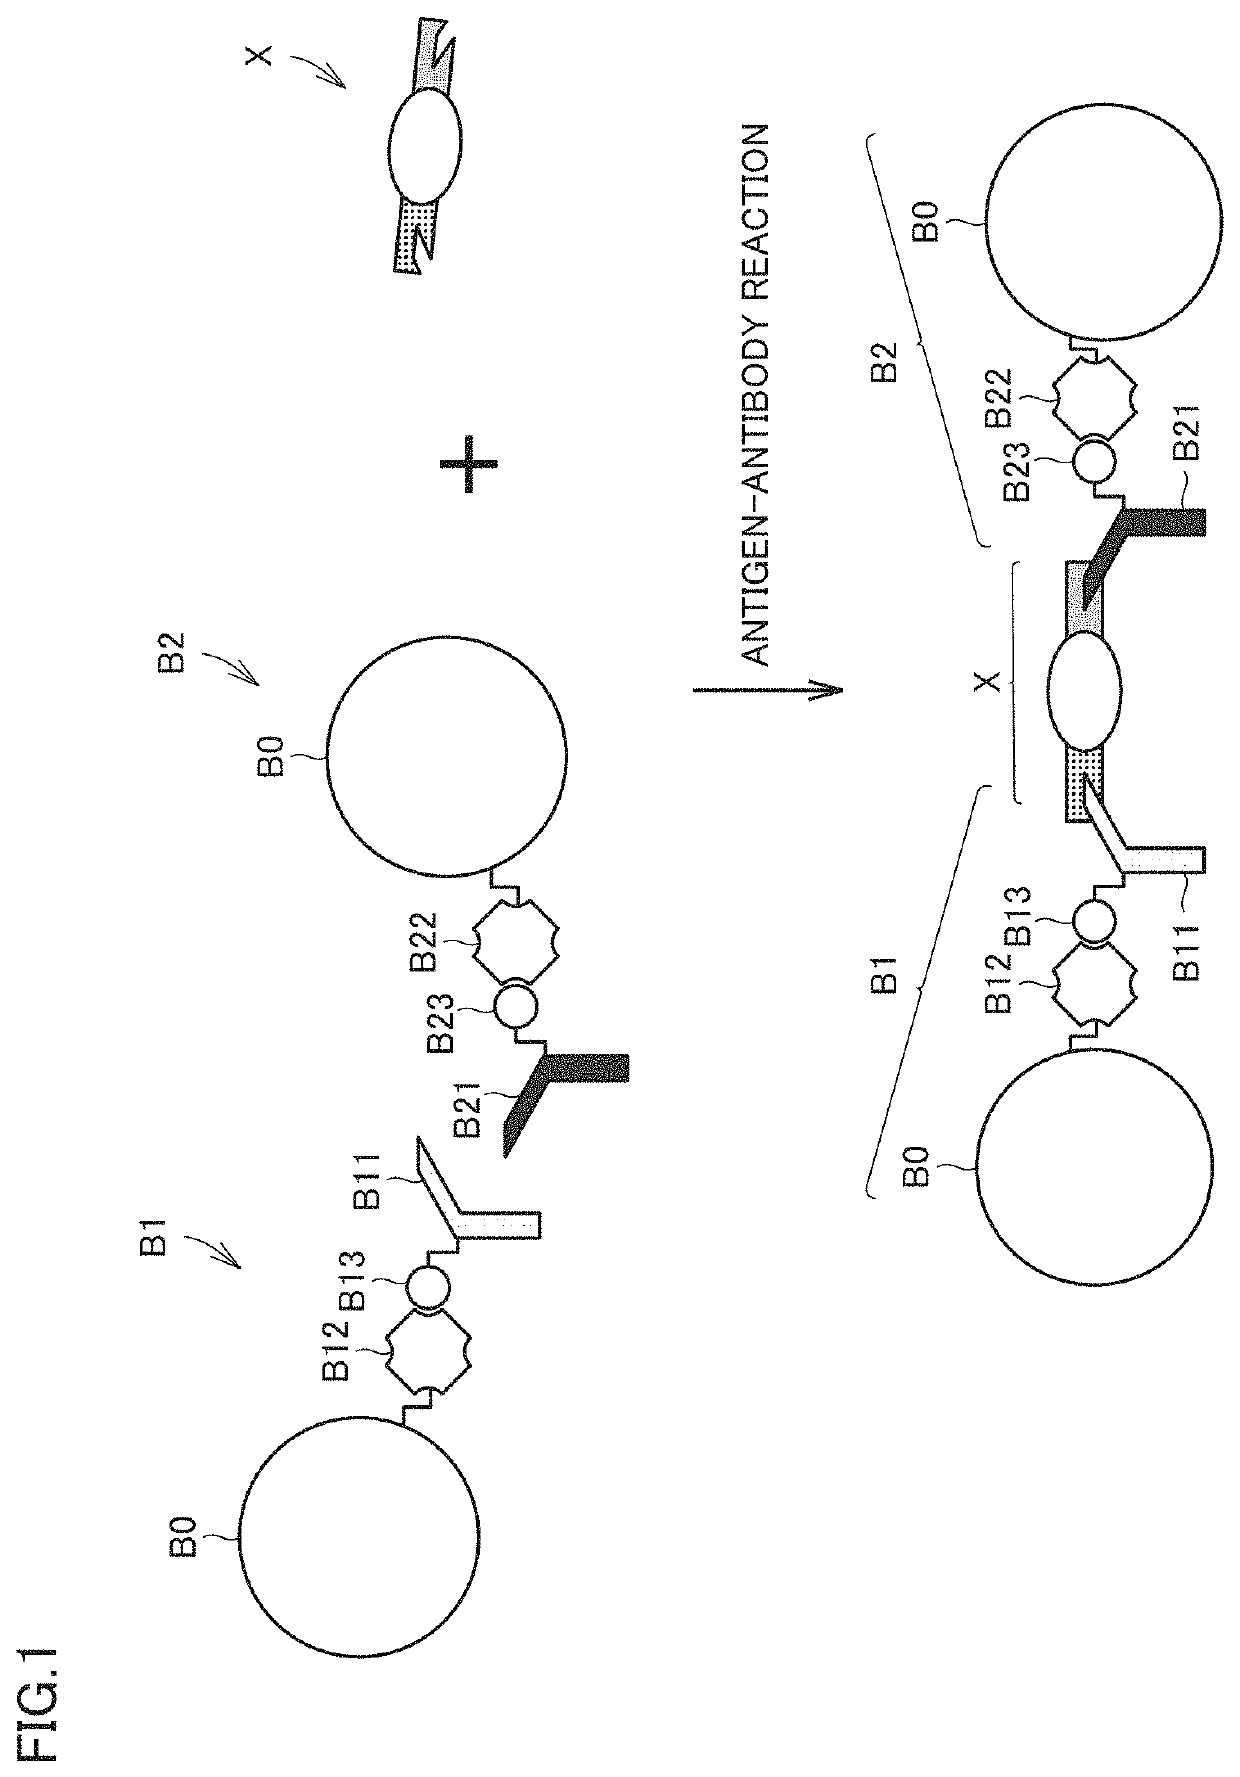
[0089]FIG. 1 is a conceptual diagram illustrating a detection principle of a certain analyte. In the first embodiment, the analyte is detected using what is called a latex aggregation method. More particularly, in the example of FIG. 1, two types of beads B1, B2 are prepared.
[0090]Each of beads B1, B2 includes a common bead body B0. Bead body B0 is a resin bead (latex bead) made of polystyrene. Bead body B0 has a size in micrometer order (typically, a size of about 1 μm to about 5 μm in diameter) similarly to a general latex bead. A material of bead body B0 may be another resin such as acrylic, polyolefin, polyethylene, or polypropylene.
[0091]In bead B1, bead body B0 is modified with a first antibody B11. Avidin B12 and biotin B13 are used for modification of first antibody B11. Avidin B12 is fixed to the surface of bead body B0 by interaction between avidin B12 and bead body B0. Biotin B13 labels first antibody B11 by binding to first antibody B11. First antibody B11 is modif...
example 1
[0160]
[0161]FIG. 15 is a view illustrating the measurement results of the relationship between the target concentration and aggregation area A of beads B1, B2 when analyte X is CD80. FIG. 15 illustrates measurement results when position zbtm of the beam waist of laser beam L1 from the bottom surface of microchannel 92 in the downward irradiation is set to two ways (zbtm=0 μm, 50 μm) and when flow velocity V of sample SP is set to two ways (V=47.6 [μm / s], 476 [μm / s]) (that is, there are four measurement conditions depending on the combination of position zbtm and flow velocity V).
[0162]In FIG. 15 and FIG. 18 described later and the like, an error bar represents a measurement error of a result of performing the measurement a plurality of times at each target concentration, specifically, a standard deviation of aggregation area A of beads B1, B2. In FIG. 15, error bars of four measurement results are illustrated in the case of flow velocity V=47.6 [μm / s], and error bars of three measur...
example 2
[0165]
[0166]FIG. 16 is a conceptual diagram illustrating an influence of flow velocity V of sample SP on the aggregation of beads B1, B2. Whether beads B1, B2 and analyte X are encountered and bound is a stochastic event. However, when flow velocity V is slow (for example, when V=47.6 [μm / s]), the supply amounts of beads B1, B2 and analyte X per unit time to the beam waist of laser beam L1 are relatively small, so that the encounter probability between beads B1, B2 and analyte X is low. Consequently, there may be the case where beads B1, B2 are bound through analyte X until the light irradiation time of several minutes elapses and the growth of the aggregate proceeds to some extent, or there may be the case where beads B1, B2 cannot be bound much without encountering analyte X and the growth of the aggregate is difficult to proceed (see the upper drawing in FIG. 16). Accordingly, it is considered that the error bar becomes large when flow velocity V is excessively low (V=47.6 [μm / s]...
PUM
| Property | Measurement | Unit |
|---|---|---|
| concentration | aaaaa | aaaaa |
| concentration | aaaaa | aaaaa |
| wavelength range | aaaaa | aaaaa |
Abstract
Description
Claims
Application Information