

Analysis of carbohydrates derivatized with visible dye by high-resolution polyacrylamide gel electrophoresis
- Summary
- Abstract
- Description
- Claims
- Application Information
AI Technical Summary
Benefits of technology
Problems solved by technology
Method used
Image

Examples
example 1
5.1 Example 1
Materials and Methods
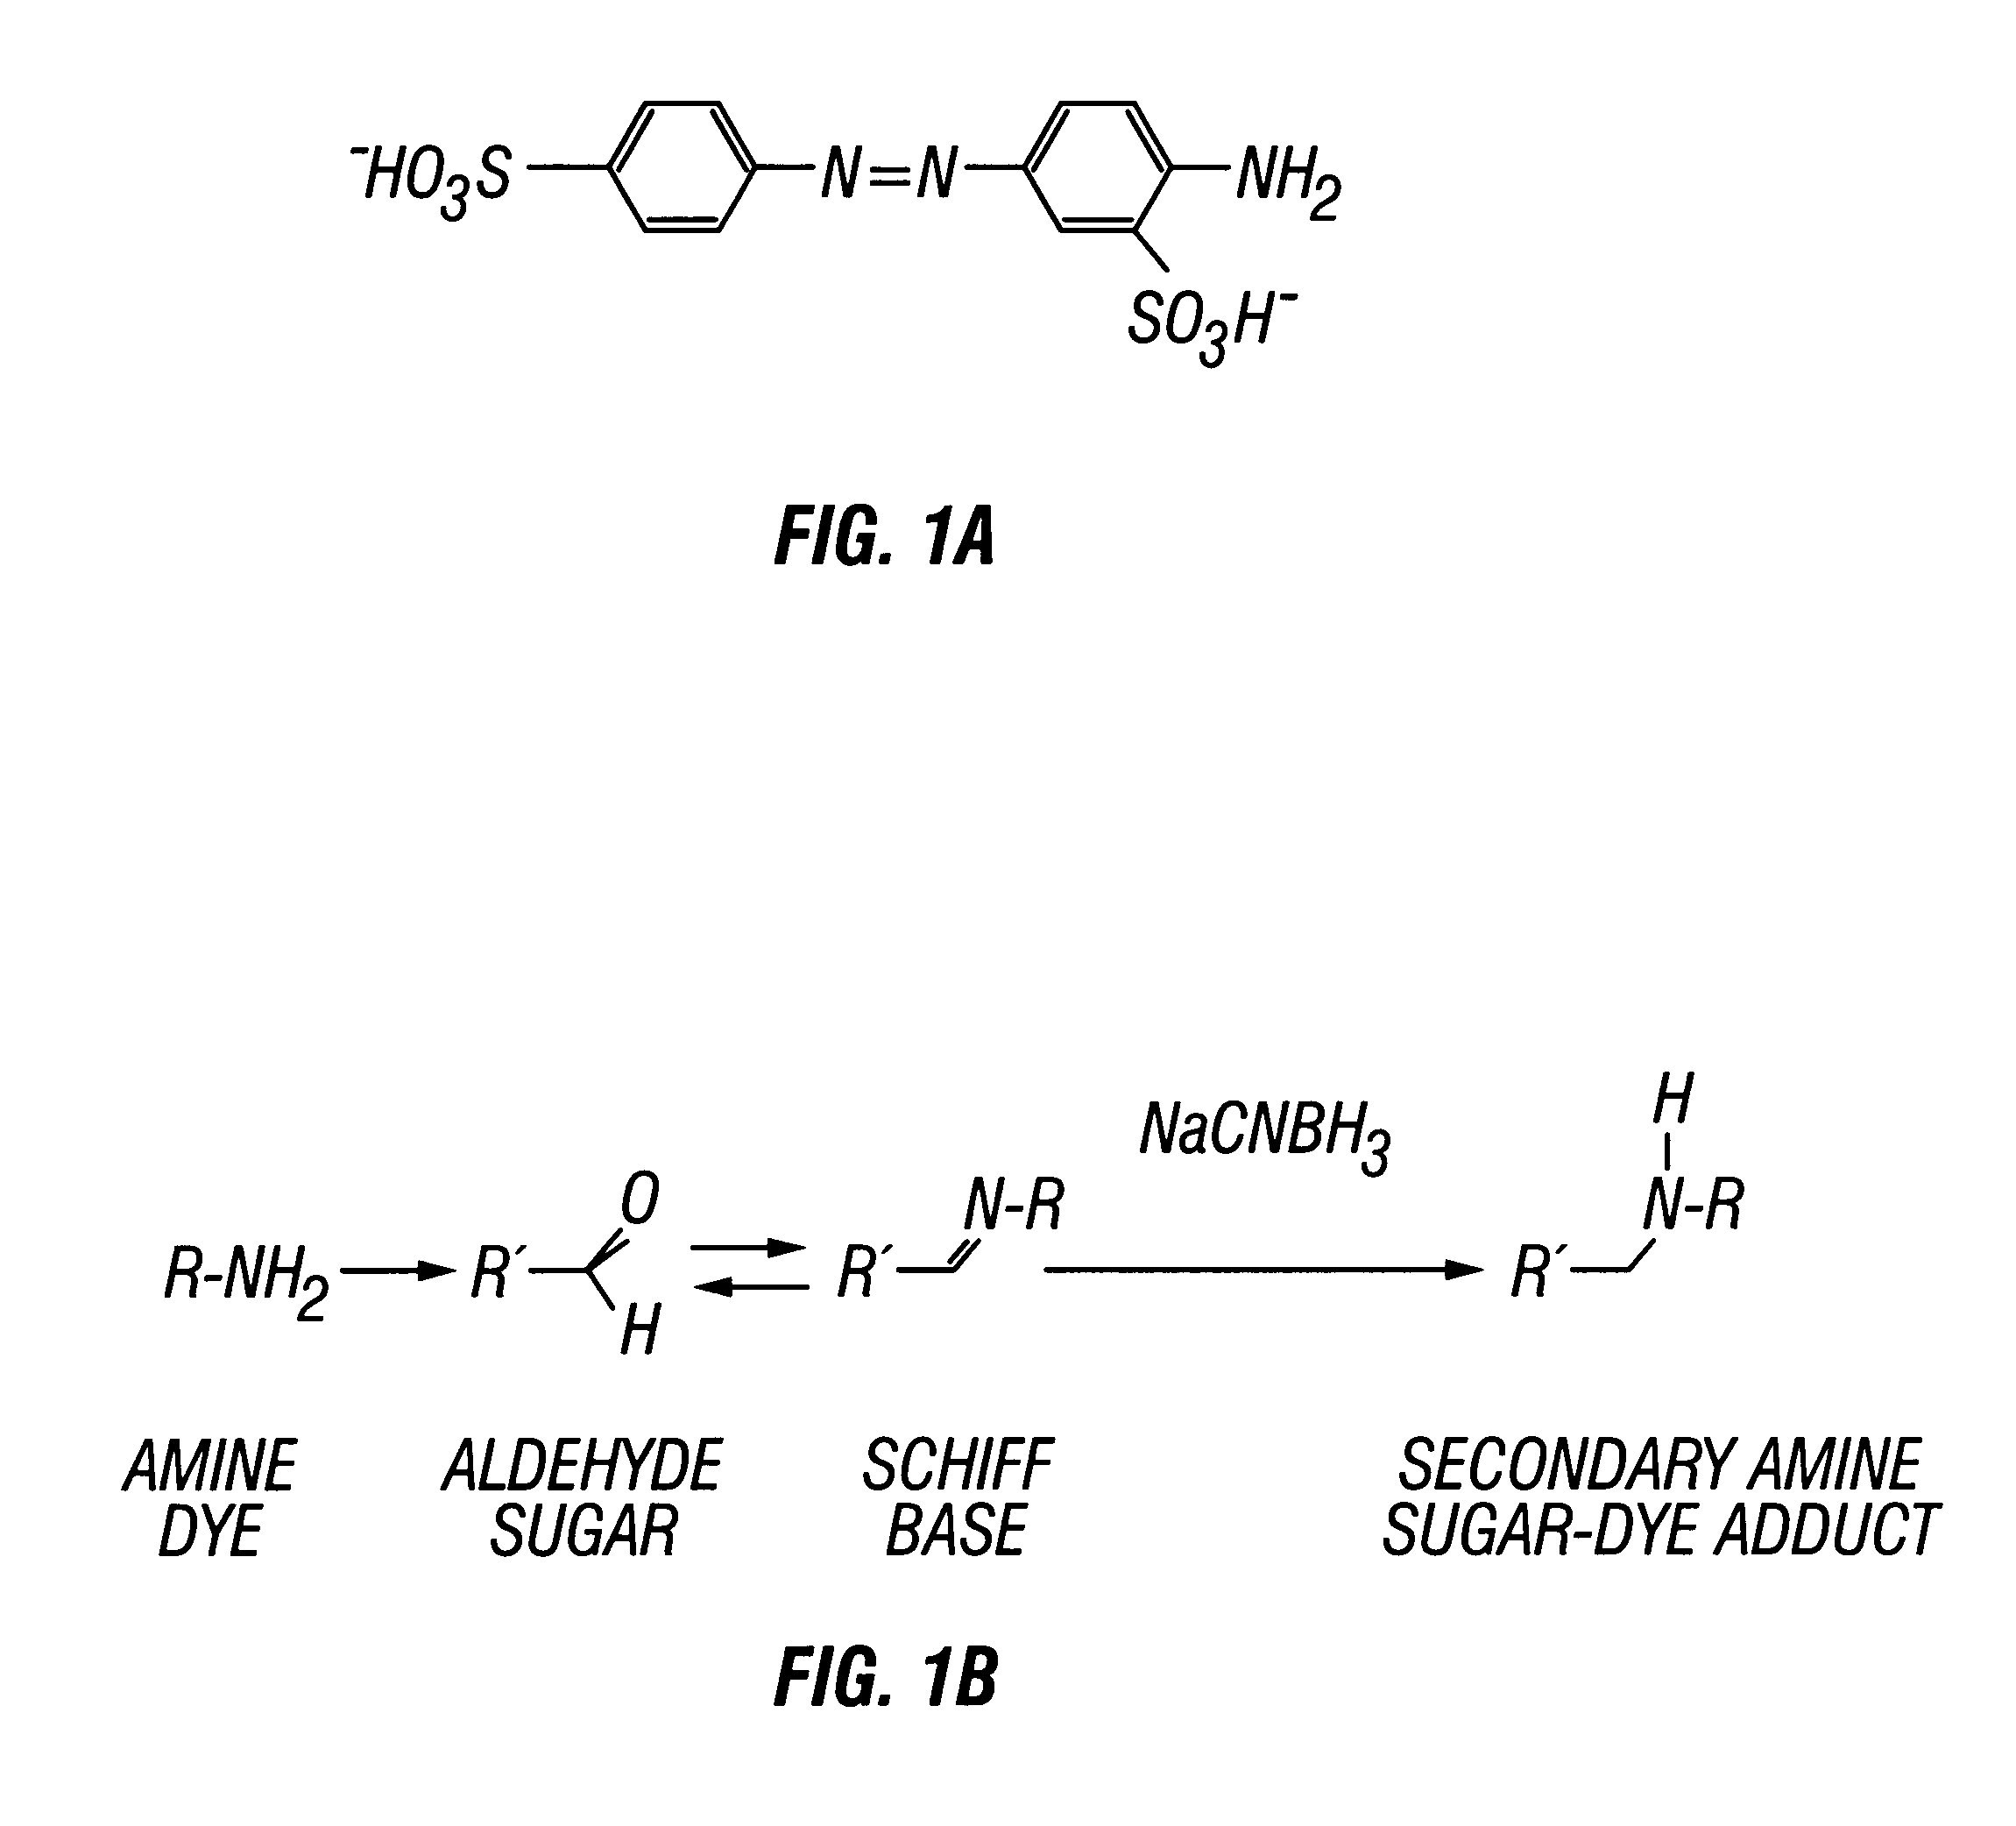
All carbohydrate sugars were purchased from Sigma Chemical Company (St. Louis, Mo.). The sugars used include were Glc 2, Man, Gal, Mel, 3-O-Glc, dGlc, Fuc, Mt, Mh, 6-dGlc, GlcNAc, and Glc6. Acrylamide and N,N'-methylenebisacrylamide were purchased from Sigma. The visible chromophore, AABA, shown in FIG. 1A, was obtained from Aldrich Chemical Company (Milwaukee, Wis.). A BIO-RAD Protean II Cell with plates allowing for 16 cm long gels was used for polyacrylamide gel electrophoresis. All components of the Tris-borate buffer system were purchased from EM Science.
example 2
5.2 Example 2
Reductive Amination of Sugars
The reductive amination of carbohydrates, FIG. 1B, was performed generally as described (Jackson, 1994b), with slight modifications to accommodate aqueous preparations. Dilutions of 1.0 M stock aqueous saccharide solutions were made to provide various concentrations of sugars for the reductive amination reactions. AABA was diluted in acetic acid-water (3:17, v / v) to a concentration of 0.15 M. Five microliters of dye solution were combined with 5 .mu.l of 1.0 M NaCNBH.sub.3 (in dimethyl sulfoxide) and 10 .mu.l of a saccharide solution in siliconized microcentrifuge tubes. After incubation at 37.degree. C. for various times, the samples were heated (45.degree. C.) in a dry bath incubator for 15 min to evaporate the solvent. Forty microliters of a glycerol-water (1:4, v / v) solution was added to each sample, which was then stored at 4.degree. C. until analysis by polyacrylamide gel electrophoresis.
example 3
5.3 Example 3
A Tris-borate buffer system was used to electrophorese the labeled (derivatized) carbohydrates through a polyacrylamide matrix as previously described (Jackson, 1994b), with modifications. The electrophoretic separation system consisted of three components:
1) a resolving gel comprised of 30% (w / v) acrylamide, 1.6% (w / v) N,N'-methylenebisacrylamide, 0.1 M Tris-borate buffer, pH 8.3;
2) a sample gel comprised of 3.9% (w / v) acrylamide, 0.21% (w / v) N,N'-methylenebisacrylamide, 0.1 M Tris-borate buffer, pH 8.3; and
3) an electrode buffer solution comprised of 0.1 M Tris-borate, pH 8.3 which was degassed before use.
After polymerization of the polyacrylamide gels, 4 .mu.l of derivatized sugar samples was loaded into each well and electrophoresed at a constant current of 15 mA per gel and kept at a constant temperature of 4.degree. C. with a refrigerated water bath. After the dye front reached the bottom of the gels (about 6 h), the electrophoresis was terminat...
PUM
| Property | Measurement | Unit |
|---|---|---|
| Length | aaaaa | aaaaa |
| Fraction | aaaaa | aaaaa |
| Fraction | aaaaa | aaaaa |
Abstract
Description
Claims
Application Information