All-fiber photon-pair source for quantum communications
- Summary
- Abstract
- Description
- Claims
- Application Information
AI Technical Summary
Benefits of technology
Problems solved by technology
Method used
Image
Examples
example 1
[0080]FIG. 3 shows a plot of the quantum efficiency versus the dark-count probability for the two avalanche photodiodes APD1 and APD2 used in the system 20. A figure-of-merit for the APDs can be introduced through the noise-equivalent power (NEP)=(hv / η)(2RD)1 / 2, where h is the Planck constant, v is the frequency of light, η is the detector quantum efficiency, and RD is the dark-count rate measured during the gate time. The best values of NEP obtained by optimizing VB are 1.0×10⁻¹⁵ W / Hz−1 / 2 for APD1 and 1.6×10⁻¹⁵ W / Hz−1 / 2 for APD2. These values are comparable to those reported for cryogenically-cooled APDs. Under the optimized conditions, the efficiency of APD1 (APD2) is 25% (20%) and the corresponding dark-count probability is 2.2×10⁻³ / pulse (2.7×10⁻³ / pulse).
example 2
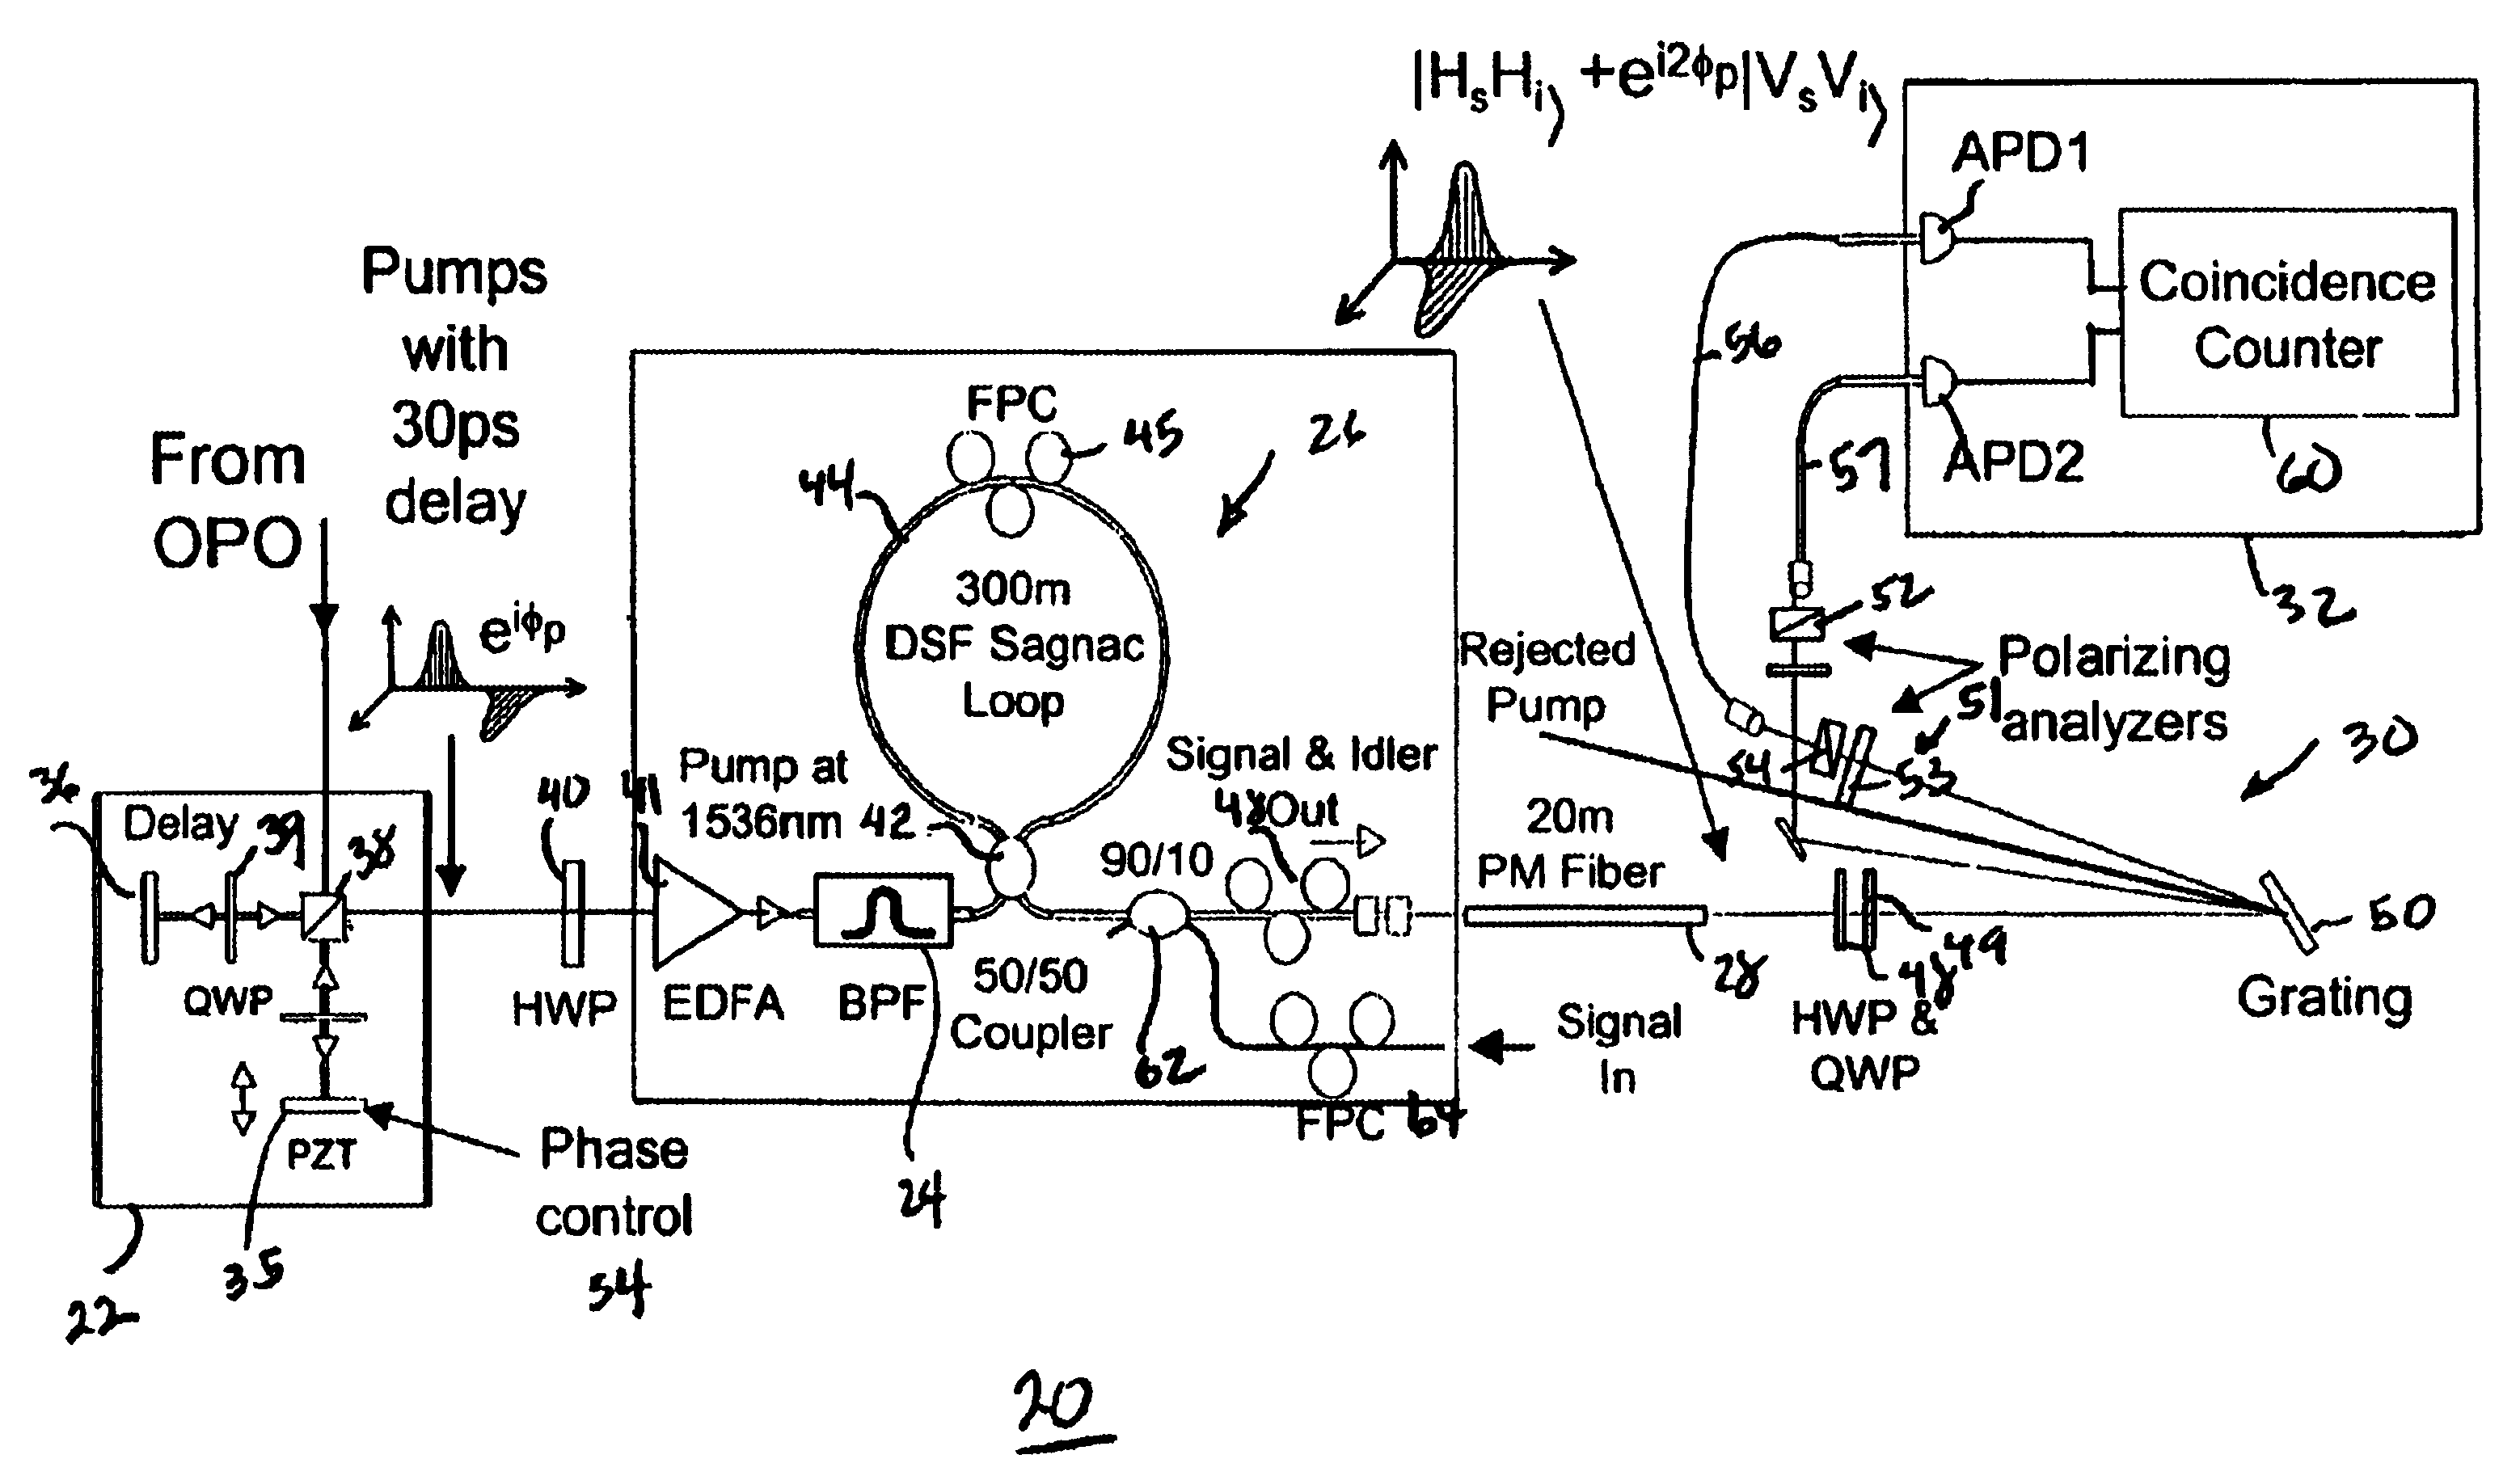
[0081]As a first test of the inventive photon-pair source, and of the filtering process, the number of scattered photons detected in the signal (idler) channel, N5 (NI), were measured as a function of the number of pump photons, Np, injected into the NFSI. The results for the idler channel are shown in FIG. 5. With the pre-filtering provided by bandpass filter 24, the single photon scattering rate can be made to depend quadratically on the input pump photon number Np. The experimental data fits with Ns=ND+S1Np+S2N2p, where ND is the number of dark counts during the gate interval, and S1 and S2 are the linear and quadratic scattering coefficients, respectively. The fit clearly shows that the quadratic scattering owing to FWM in the fiber can dominate over the residual linear scattering of the pump due to imperfect filtering. Without pre-filtering, the single photon scattering rate cannot be made to depend quadratically on the input pump photon number Np as shown in FIG. 6.
example 3
[0082]FIG. 4 is a plot of coincidence rates as a function the single-photon rates in two different cases; for signal-idler fluorescence produced by a pump pulse (for which the data points are shown as diamonds) and signal-idler fluorescence produced by two consecutive pump pulses (for which the data points are shown as triangles). The line represents the calculated “accidental” counts.
[0083]The diamonds represent the rate of coincidence counts as a function of the rate of the signal and idler photons generated during the same pump pulse. For convenience, the coincidence rate is plotted as a function of the geometric mean of the signal and idler count rates. In fact, since the efficiency of the two detectors is different, different single-photon count rates in the two channels are measured. Dark counts have been subtracted from the plotted count rates. For the coincidence rates, both dark-dark and photon-dark coincidences have to be taken in account, but for the counting rates in our...
PUM
 Abstract
Description
Claims
Application Information
 - R&D
- Intellectual Property
- Life Sciences
- Materials
- Tech Scout
- Unparalleled Data Quality
- Higher Quality Content
- 60% Fewer Hallucinations
Browse by: Latest US Patents, China's latest patents, Technical Efficacy Thesaurus, Application Domain, Technology Topic, Popular Technical Reports.
© 2025 PatSnap. All rights reserved.Legal|Privacy policy|Modern Slavery Act Transparency Statement|Sitemap|About US| Contact US: help@patsnap.com


