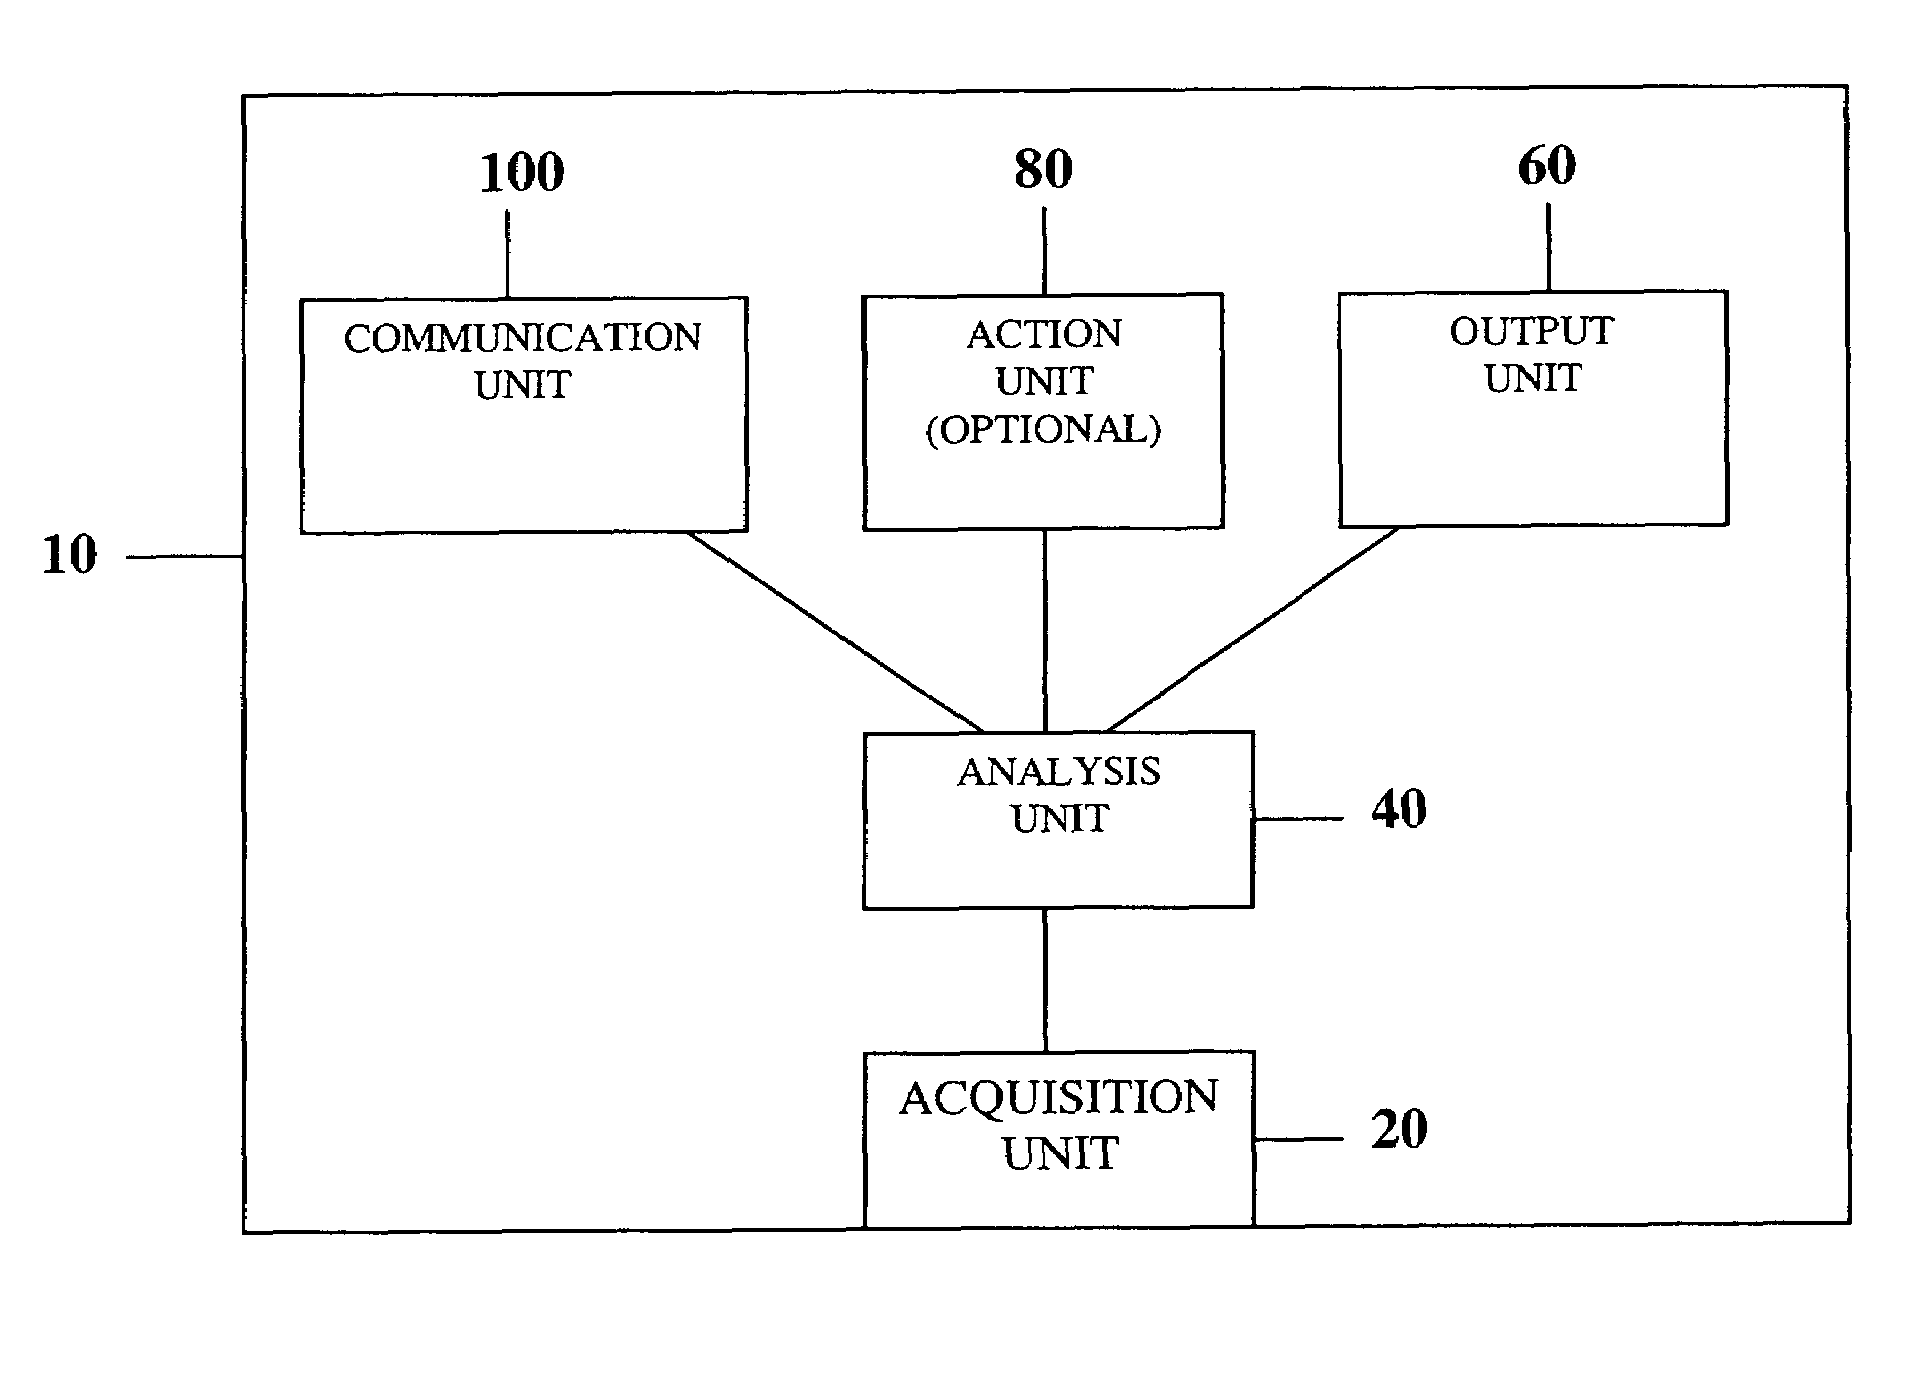
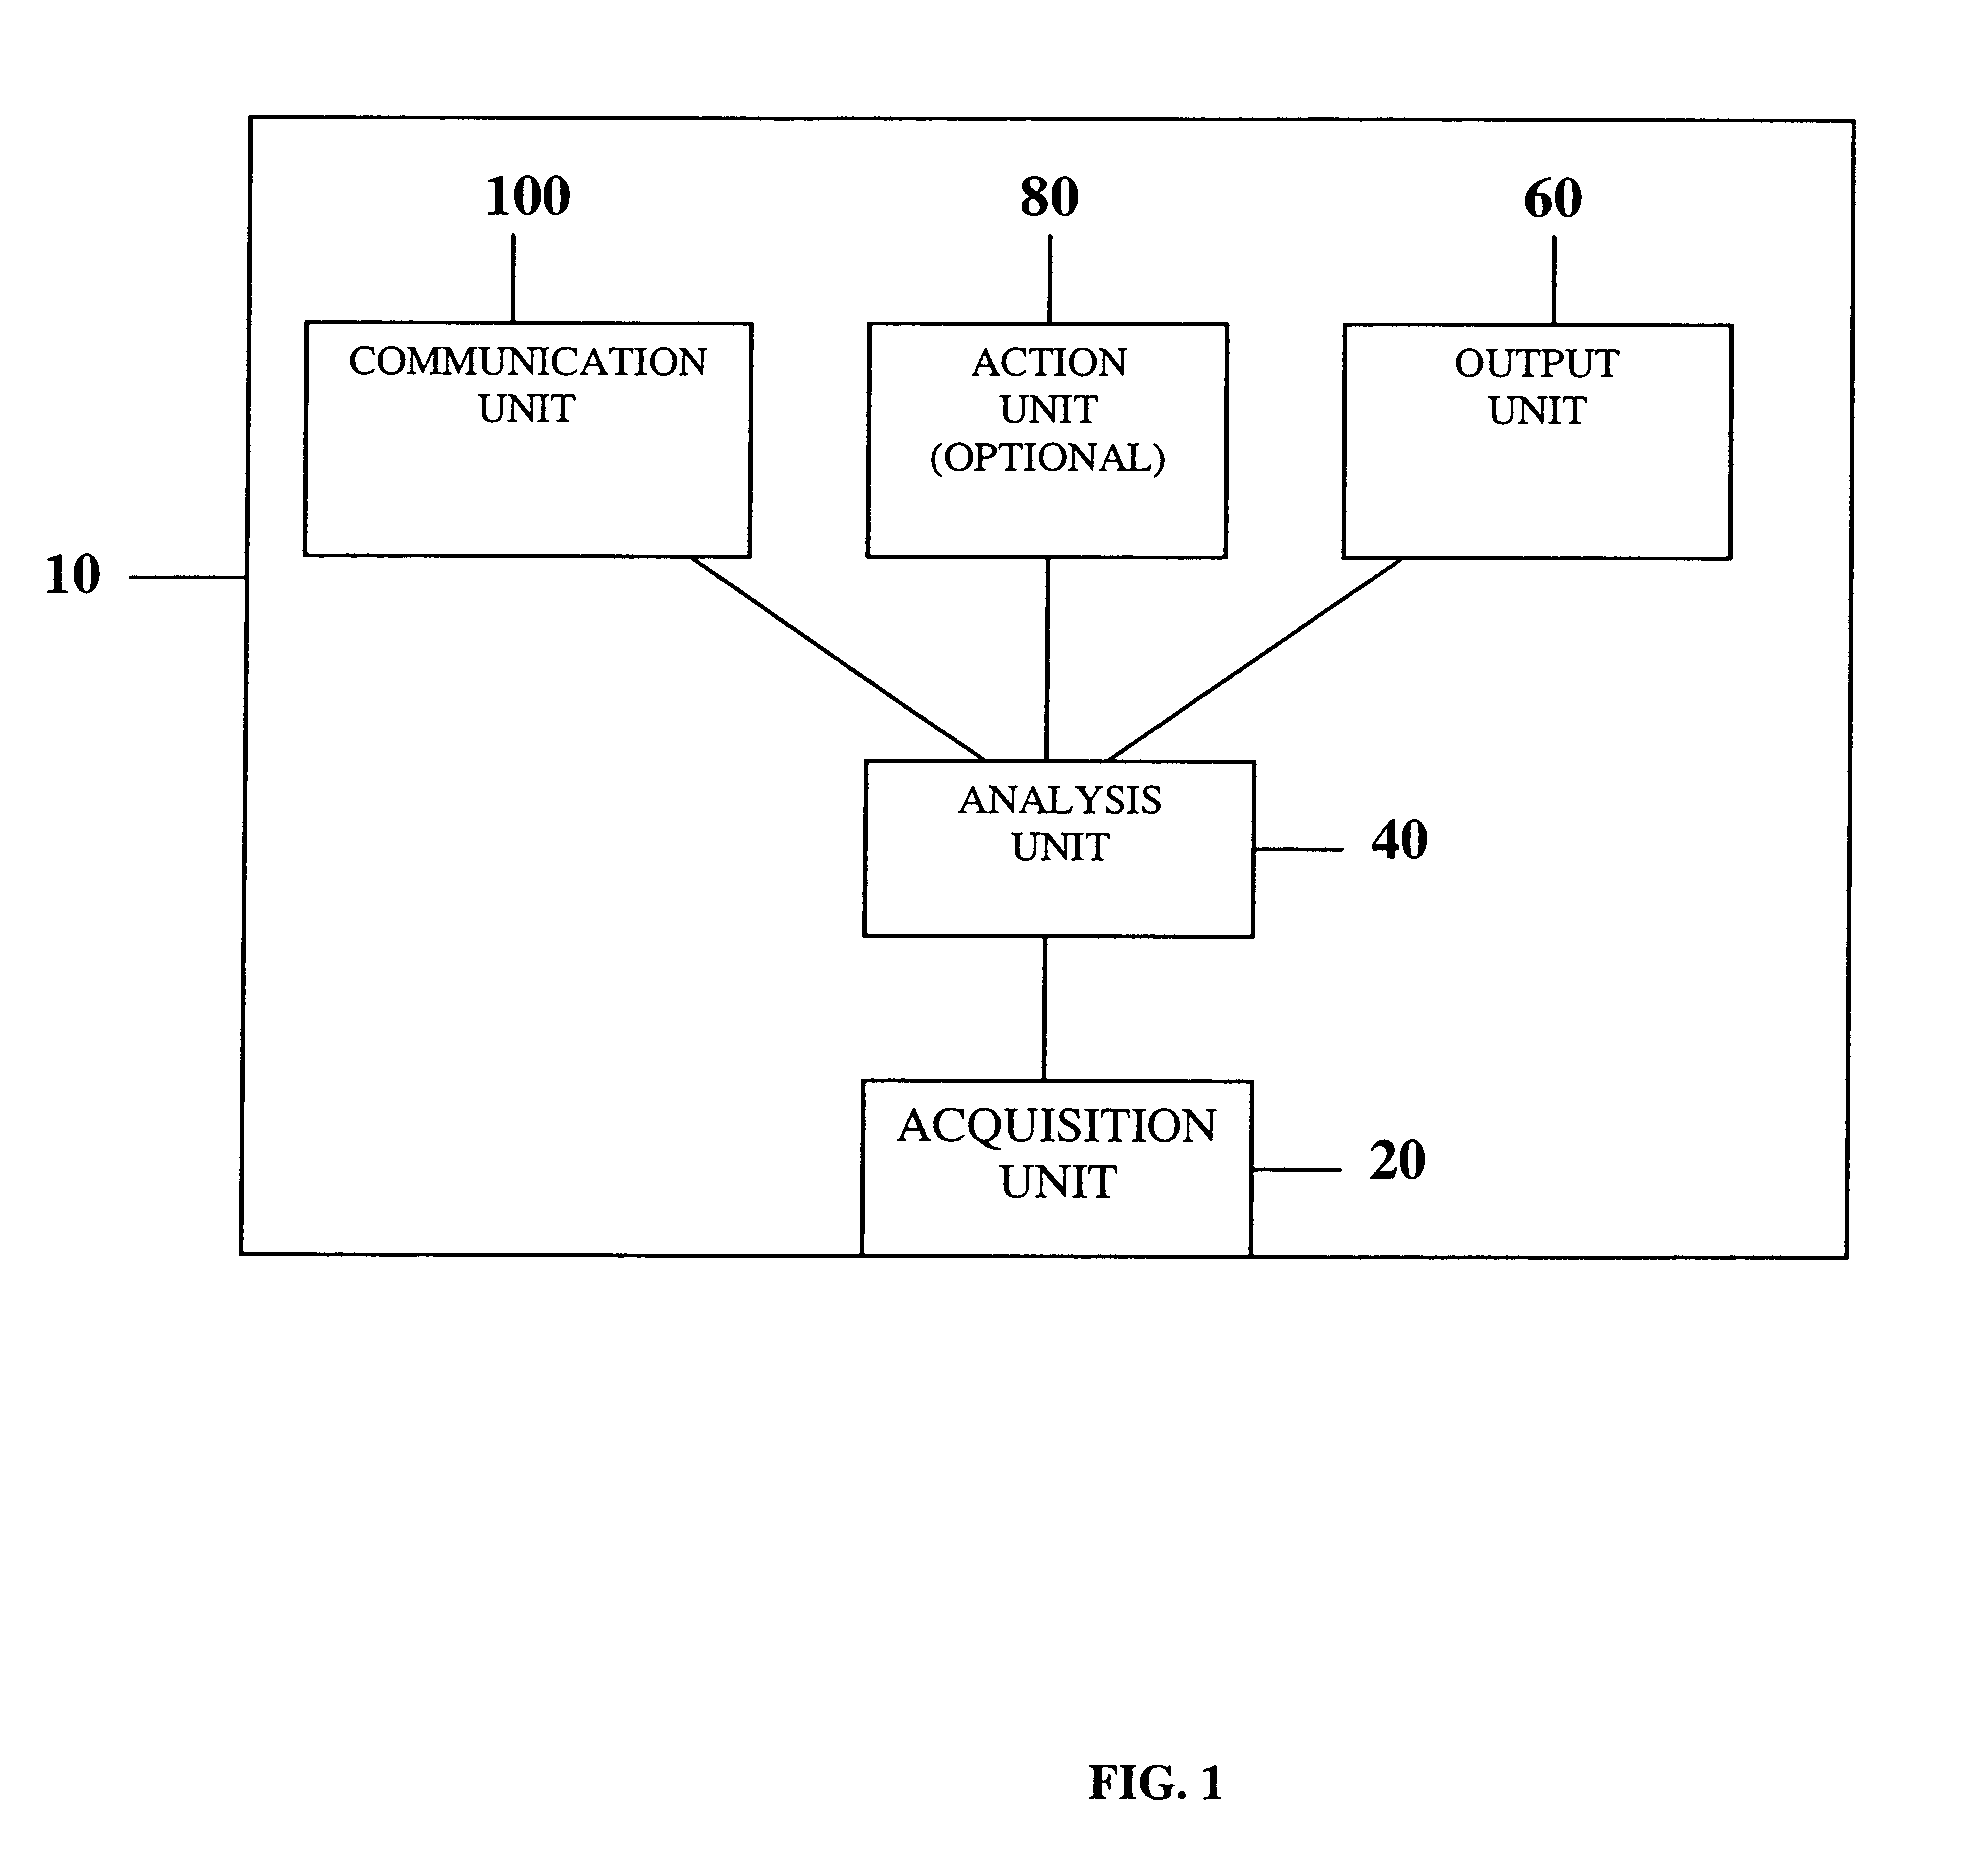
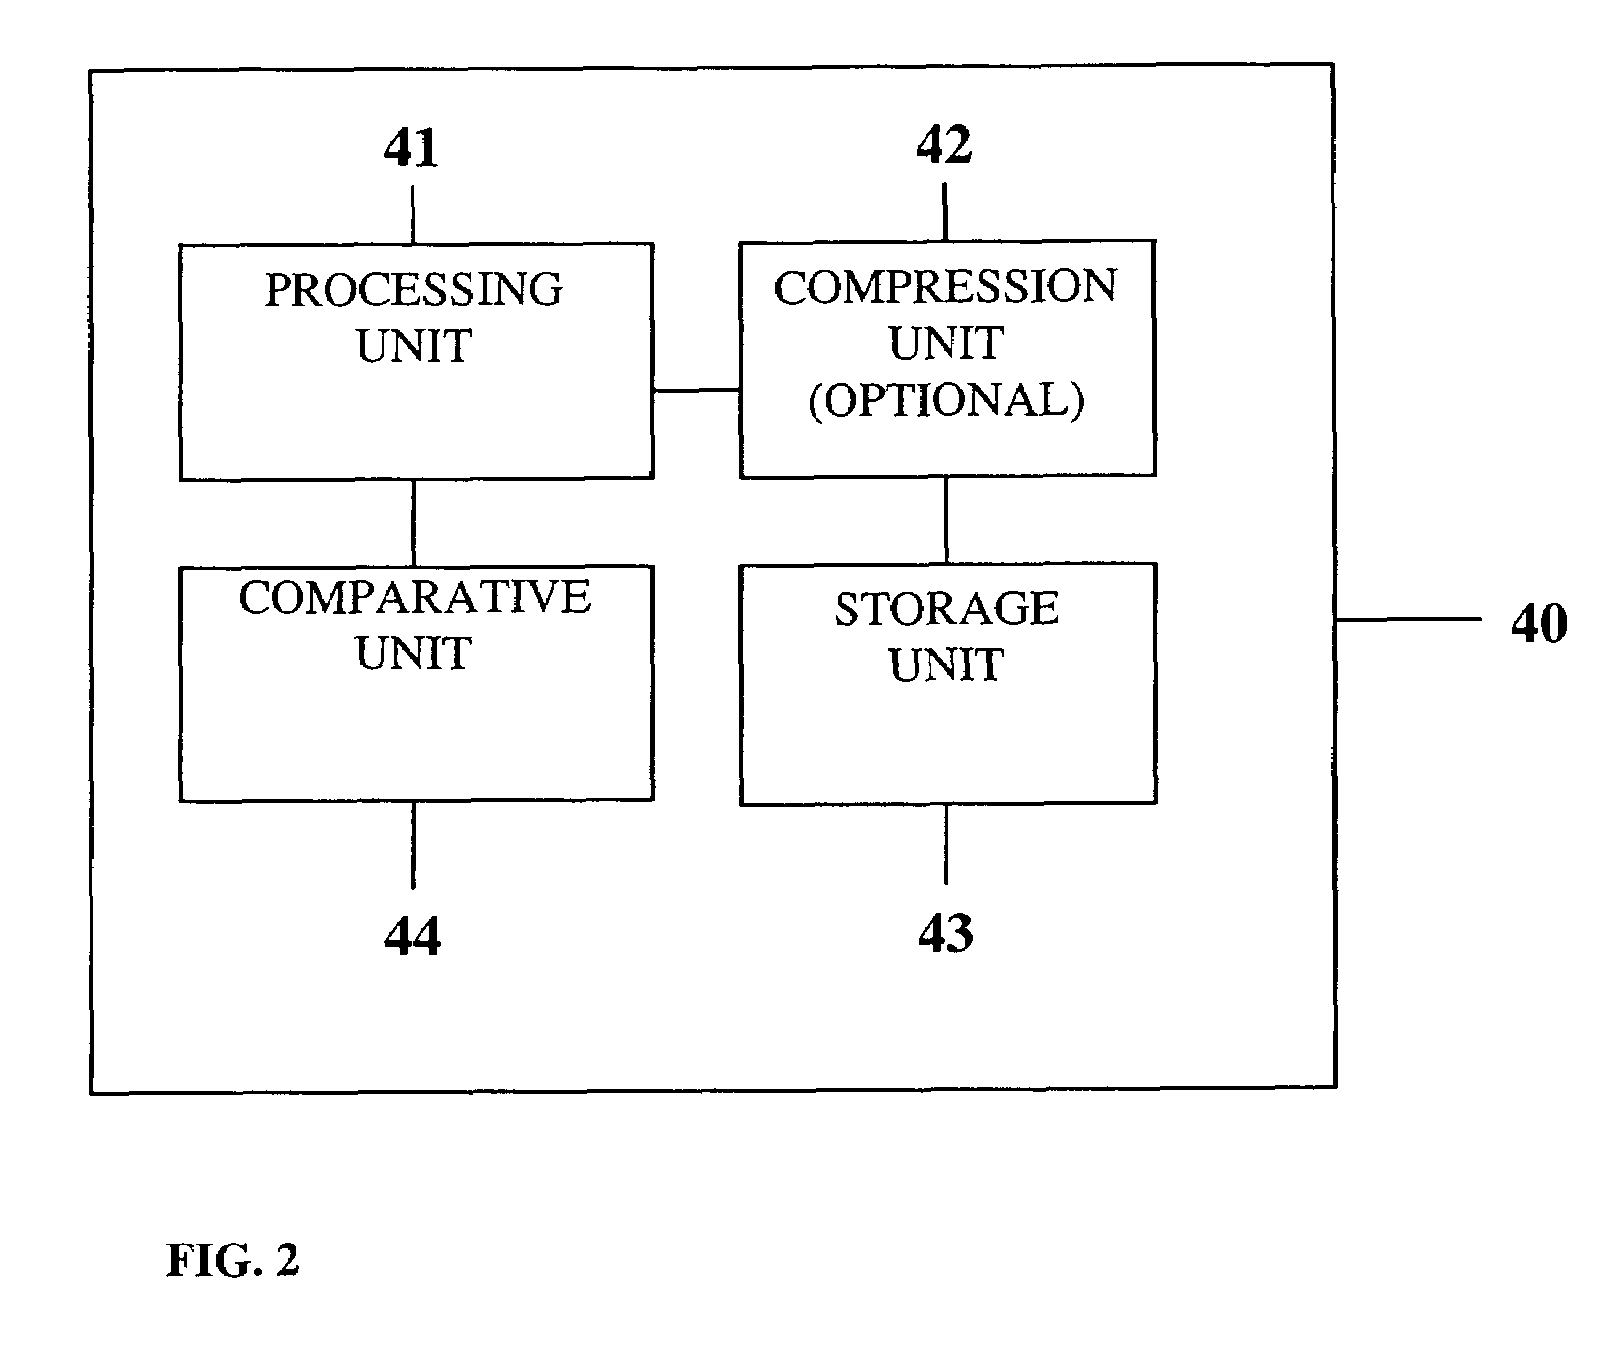
Measurement and analysis of trends in physiological and/or health data

a trend and physiological and health data technology, applied in the field of noncontact measurements of physiological and health data, can solve the problems of biasing data, one-time examination does not provide sufficient information for conclusion or diagnosis, and modifies cardiovascular disease, so as to achieve the effect of higher computational resources and higher computational resources

Inactive Publication Date: 2009-02-03
SHUSTERMAN VLADIMIR
View PDF20 Cites 255 Cited by
  • Summary
  • Abstract
  • Description
  • Claims
  • Application Information

AI Technical Summary

Benefits of technology

[0012]Usage of simple and miniature sensors usually yields a low signal-to-noise ratio (SNR). This invention compensates the low SNR by collecting the data over relatively long time windows and applying mathematical transformations, such as the averaging, to process collected data, decrease the amount of noise, and extract typical patterns despite the low SNR. This invention achieves the desired increased sensitivity (signal-to-noise ratio) which permits miniaturization and reliable performance in a variety of real-life settings and environments by collecting the data over a period of at least several cardiac beats, extracting typical patterns from these data, and analyzing the trends in the data. The trends for analysis may use different time intervals, from several seconds to minutes to hours, days, weeks, months, or years. For athletes and people monitoring their cardiovascular fitness response to exercises, the time interval might be minutes-to-hours. For patients with acute cardiovascular disease, the interval might be days-to-weeks. For patients with chronic diseases, the interval might be months-to-years.
[0035]High-resolution Scale III is used to analyze individual and combined changes in the primary elements; at this scale, the number of the primary variables is increased to include the entire waveform of the cardiac complexes. This allows the most sensitive and accurate detection of the small changes in the individual electrocardiographic pattern. The same PCA approach is used at this scale to expose small serial changes in the ECG or MCG recordings. Scale III requires higher computational resources compared to Scale I and Scale II; it may be implemented in a powerful processing unit such as a personal or specialized computer or a distributed network of computers or the Internet.

Problems solved by technology

First, a one-time examination does not provide sufficient information for a conclusion or a diagnosis.
Second, a one-time ECG, MCG, and other physiological and health data may not be a “typical”, characteristic data representing the dynamics over the course of 24-hours or several days.
It is well-known that a white-coat syndrome (a psychological reaction of a patient to a medical professional / environment) significantly modifies cardiovascular functions and may bias the data.

Method used


Image

  • Measurement and analysis of trends in physiological and/or health data
  • Measurement and analysis of trends in physiological and/or health data
  • Measurement and analysis of trends in physiological and/or health data

Examples


example i

[0078]The following example illustrates the sequence of ECG or MCG analysis at the system's Scales I, II and III. Serial ECG or MCG recordings from a patient A who had a structural heart disease and dynamic changes in the electrocardiogram were processed at each Scale with a different degree of detail. Scale I revealed the changes in a small number of important, primary elements using minimum computational resources. Scale II exposed changes in the primary elements that occurred in serial recordings over time. Scale III provided complete description of the serial ECG or MCG changes using a complete set of primary elements and their combinations.

[0079]System initialization. When the system is used for the first time, initialization is required for verification and individual adjustment of the analysis criteria including identification of the primary elements and their search criteria. System initialization is performed using the hardware and software resources of the intermediate res...

example ii

[0087]This theoretical example has been selected to show how the present invention could be implemented using a distributed network of computers with parallel processing and how it can be efficiently integrated with such methods of artificial intelligence as neural networks and expert systems to process different types of serial information obtained from a patient with chronic congestive heart failure. Patients with chronic illnesses often have a number of chronically or intermittently abnormal indicators, whose dynamics are difficult to discern. A network of computers allows fast and accurate processing of the patient's information obtained using different diagnostic techniques (such as biochemical, electrocardiographic, nuclear magnetic resonance, stress-test, and other modalities).

[0088]In a hypothetical patient B. with chronic congestive heart failure (Class II) and a three-year-old myocardial infarction, the above-described high-resolution analysis of serial ECG or MCG recordin...

example iii

[0090]This theoretical example is provided to show implementation of the present invention on a specialized computer network, which could be setup for individuals working in the high-demand professional environments, such as airplane pilots.

[0091]During a late-spring commercial flight, a hypothetical 46-year-old pilot suddenly developed dizziness and shortness of breath. A Scale I ECG or MCG examination showed sinus tachycardia (fast heart rates) and increased amplitude of the P-wave. The Scale I analysis is performed using a portable ECG or MCG acquisition unit, which transmitted the information wirelessly (using a Bluetooth radiofrequency communication technology to an integrated airplane health network (implemented using Wi-Fi wireless technology). A second Scale-I-device (also connected to the network) is used to examine changes in blood pressure and detected moderate increase in diastolic pressure.

[0092]The airplane integrated health system, which includes a diagnostic expert s...


PUM


Abstract

System comprised of a portable medical device and method for registering at least one of electrocardiographic (ECG), magnetocardiographic (MCG), physical activity, body position, respiration, temperature, blood pressure, vasomotor activity, blood flow, neural activity, and other physiological, and health data, extracting and representing the most significant parameters from time series (trends) of said data. The system achieves the necessary sensitivity (signal-to-noise ratio) in order to miniaturize the device by collecting data of at least one fiducial point in a cardiac complex over a period of at least one, and preferably, several seconds, and extracting the underlying typical patterns from these data. Due to the miniaturization (pocket-size), the system can be implemented in a shape of a pen (or another miniature shape) that can be worn in a pocket.

Description

CROSS-REFERENCE TO RELATED APPLICATIONS[0001]This application is a continuation-in-part of application Ser. No. 10 / 816,638, filed Apr. 2, 2004, now U.S. Pat. No. 7,343,197, which is a continuation-in-part of application Ser. No. 10 / 124,651, filed Apr. 17, 2002, now U.S. Pat. No. 6,925,324, which was a continuation-in-part of application Ser. No. 09 / 583,668, filed May 30, 2000, now U.S. Pat. No. 6,389,308. The present application also claims the benefit of Provisional application Ser. No. 60 / 646,928,filed Jan. 24, 2005.FIELD OF THE INVENTION[0002]This invention relates to the field of non-contact measurements of physiological and health data, including electrocardiographic, magnetocardiographic, mechanocardiographic, ballistocardiographic data, physical activity, body position, blood pressure, vasomotor activity, temperature, and respiration, and more specifically to a method and apparatus, which can be miniaturized and adapted to wear in a pocket or attached to the clothes of a subj...

Claims


Application Information

Patent Timeline
Patent Type & Authority Patents(United States)
IPC IPC(8): A61B5/0402
CPCA61B5/04007A61B5/0452A61B5/411A61B5/6822A61B5/726A61B5/7232A61B5/0022A61B5/243A61B5/349
Inventor SHUSTERMAN, VLADIMIR
Owner SHUSTERMAN VLADIMIR
Why Eureka
Try Eureka