Three-dimensional sub-wavelength metal cavity structure spectrum multi-tape light perfect absorption plasmon sensor as well as preparation method and application thereof
A metal cavity and perfect absorption technology, applied in the fields of optics, materials and biology, can solve difficult and difficult to apply multi-band sensing detection and other problems, achieve high quality factor, easy multi-functional integration, and simplify the preparation process.
- Summary
- Abstract
- Description
- Claims
- Application Information
AI Technical Summary
Problems solved by technology
Method used
Image
Examples
Embodiment 1
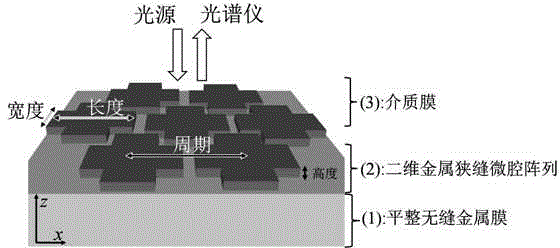
[0047] The metal subwavelength microcavity plasmon sensor in this embodiment is composed of a metal film (1), a two-dimensional non-close-packed periodic array (2) and a dielectric film (3) sequentially from bottom to top. The schematic diagram of the structure of the two-dimensional non-close-packed periodic array in this embodiment is as follows figure 1 shown. The metal subwavelength microcavity plasmon sensor in this embodiment can be widely used in the analysis and detection of low-concentration organic molecules, biomolecules, and changes in the dielectric constant of the environment.
Embodiment 2
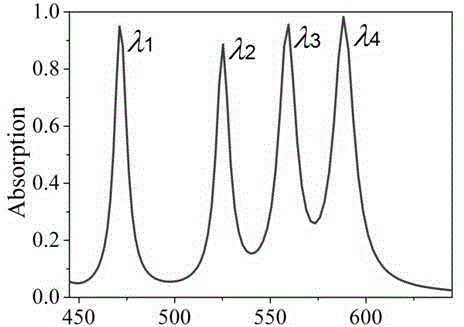
[0049] This embodiment adopts two materials of silver and silicon dioxide. First, a silver film with a thickness of 100 nm is deposited on the glass slide by physical vacuum coating method; secondly, electron beam etching technology is used on the silver film substrate A two-dimensional hexagonal non-close-packed periodic array composed of cross-shaped silver nanosquares was prepared. The array period, square length, width, and height were 110 nm, 104 nm, 52 nm, and 14 nm, respectively. The upper medium layer is air. adopted as figure 1 The optical reflectance spectrum test shown, can be obtained as figure 2 Four narrow-band absorption spectra are shown.
Embodiment 3
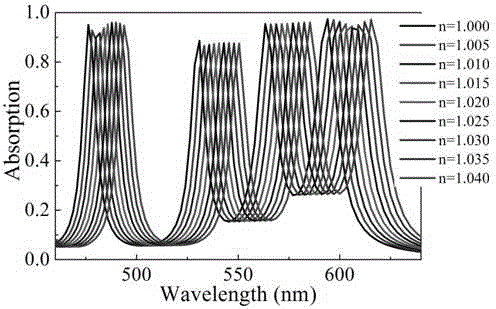
[0051] In this embodiment, the metal subwavelength microcavity plasmon sensor obtained in the above-mentioned Example 2 is placed in an atmospheric environment mixed with toxic gases, such as toluene, etc., and then its spectral reflection light signal is directly measured, and the obtained absorption spectrum is as follows image 3 shown. Depend on image 3 It can be seen that with the increase of the toluene gas content in the air and the increase of the refractive index of the mixed gas, the four absorption spectrum peaks all present obvious spectral shifts, reflecting high spectral frequency shift sensitivity and high quality factor FOM (such as Figure 4 ).
PUM
| Property | Measurement | Unit |
|---|---|---|
| thickness | aaaaa | aaaaa |
| thickness | aaaaa | aaaaa |
| length | aaaaa | aaaaa |
Abstract
Description
Claims
Application Information
 - R&D
- Intellectual Property
- Life Sciences
- Materials
- Tech Scout
- Unparalleled Data Quality
- Higher Quality Content
- 60% Fewer Hallucinations
Browse by: Latest US Patents, China's latest patents, Technical Efficacy Thesaurus, Application Domain, Technology Topic, Popular Technical Reports.
© 2025 PatSnap. All rights reserved.Legal|Privacy policy|Modern Slavery Act Transparency Statement|Sitemap|About US| Contact US: help@patsnap.com


