Method for measuring content of alloy elements in ferrosilicon and silicon-aluminum-barium-calcium by X-ray fluorescent spectrometry
A technology of ray fluorescence spectroscopy and silicon aluminum barium calcium, which is applied in the field of physical and chemical detection, can solve problems such as corrosion, achieve good accuracy, good promotion and application prospects, and eliminate the effect of corroding platinum crucibles
- Summary
- Abstract
- Description
- Claims
- Application Information
AI Technical Summary
Problems solved by technology
Method used
Image
Examples
Embodiment 1
[0014] Embodiment 1: adopt the inventive method to measure the content of silicon, manganese, phosphorus, aluminum, chromium in ferrosilicon:
[0015] Take by weight unit the ferrosilicon standard sample and sample 0.15g whose particle size is less than 0.125 mm, potassium nitrate, boric acid, anhydrous sodium carbonate mixed according to the weight ratio of 1:2:3 mixed flux 4.0g; test procedure is : (1) Oxidative melting of the sample: mix the ferrosilicon standard sample and the sample with the mixed flux, wrap it with quantitative filter paper, put it into a 50ml porcelain crucible nest filled with graphite carbon powder with a purity of 99.85%, and heat it at 800°C Burn in a muffler furnace for 25 minutes, take it out and cool it; (2) Melt the sample: weigh 6.0 g of anhydrous lithium tetraborate in a clean platinum crucible, add 0.2 g of ammonium iodide solid, mix with Tweezers put the iron alloy oxidized pellets in the graphite carbon powder into the platinum crucible, me...
Embodiment 2~3
[0029] Embodiment 2~3: adopt the inventive method to measure the content of silicon, manganese, phosphorus, aluminum, chromium in ferrosilicon:
[0030] The test steps (1) to (2) are the same as in Example 1. The weights of samples and standard samples and the selection of parameters during the test are shown in Table 5 below, and other parameters are the same as in Example 1;
[0031] Table 5 Sample melting conditions
[0032]
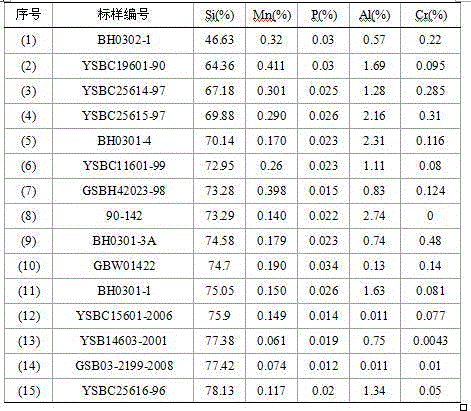
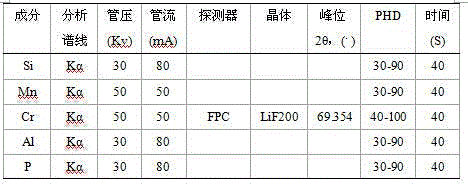
[0033] (3) Draw the working curve: select 15 ferrosilicon standard samples same as those in Example 1 to make glass frits, and the numbers and contents of the standard samples are shown in Table 1. The working curve was drawn according to the instrument measurement conditions in Table 2, and a curve with better linearity was obtained. The correlation coefficient of the working curve is shown in Table 6.
[0034] Table 6 Correlation coefficients of working curves under different conditions
[0035]
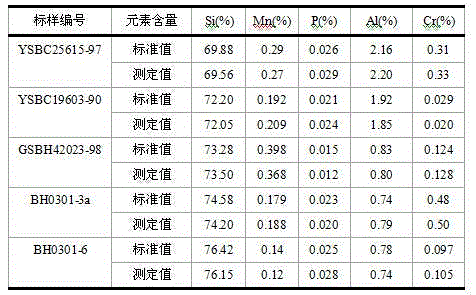
[0036] (4) Determine the content of silicon...
Embodiment 4
[0047] Embodiment 4, adopt the inventive method to measure the content of silicon, aluminum, barium, calcium in silicon aluminum barium calcium:
[0048]Weigh silicon aluminum barium calcium standard sample and sample 0.15g with particle size less than 0.125 mm by weight unit, potassium nitrate, boric acid, anhydrous sodium carbonate mixed according to the weight ratio of 1:2:3 mixed flux 4.0g; test The steps are: (1) Oxidation and melting of the sample: mix the silicon aluminum barium calcium standard sample and the sample with the mixed flux, wrap it with quantitative filter paper, and put it into a 50ml porcelain crucible nest filled with graphite carbon powder with a purity of 99.85% , burn in a muffler furnace at 800°C for 25 minutes, take it out and cool it; (2) Sample melting production: Weigh 6.0 g of anhydrous lithium tetraborate in a clean platinum crucible according to the weight unit, add 0.2 g of ammonium iodide solid Mix well, use tweezers to put iron alloy oxidi...
PUM
 Abstract
Description
Claims
Application Information
 - R&D
- Intellectual Property
- Life Sciences
- Materials
- Tech Scout
- Unparalleled Data Quality
- Higher Quality Content
- 60% Fewer Hallucinations
Browse by: Latest US Patents, China's latest patents, Technical Efficacy Thesaurus, Application Domain, Technology Topic, Popular Technical Reports.
© 2025 PatSnap. All rights reserved.Legal|Privacy policy|Modern Slavery Act Transparency Statement|Sitemap|About US| Contact US: help@patsnap.com


