
Gradient light interference microscopy for 3D imaging of unlabeled specimens

a technology of light interference and microscopy, applied in the field of unlabeled cells, can solve the problems of difficult challenges, difficult to solve, and the current requirements for 3d imaging are new, and achieve the effect of improving the depth of sectioning

Active Publication Date: 2018-11-20
THE BOARD OF TRUSTEES OF THE UNIV OF ILLINOIS
View PDF3 Cites 7 Cited by
  • Summary
  • Abstract
  • Description
  • Claims
  • Application Information

AI Technical Summary

Problems solved by technology

While the light microscope has been the main tool of investigation in biomedicine for four centuries, the current requirements for 3D imaging pose new, difficult challenges.
However, fluorescence imaging is subject to several limitations.
The excitation light is typically toxic to cells, a phenomenon referred to as phototoxicity.
While specificity granted by external markers is crucial for certain applications, quantifying cell growth over longer time scales remains a grand challenge.
More recent methods using vibrating hollow cantilevers to weigh cell passing through are limited to non-adherent cells.
However, to date, neither of them has provided a quantitative measure of wavefront deformation in three dimensions.
However, imaging optically thick, multiple scattering specimens is challenging for any optical method, including QPI.
The fundamental obstacle is that multiple scattering generates an incoherent background, which ultimately degrades the image contrast.

Method used


Image

  • Gradient light interference microscopy for 3D imaging of unlabeled specimens
  • Gradient light interference microscopy for 3D imaging of unlabeled specimens
  • Gradient light interference microscopy for 3D imaging of unlabeled specimens

Examples


example 1

ne Micro-Beads

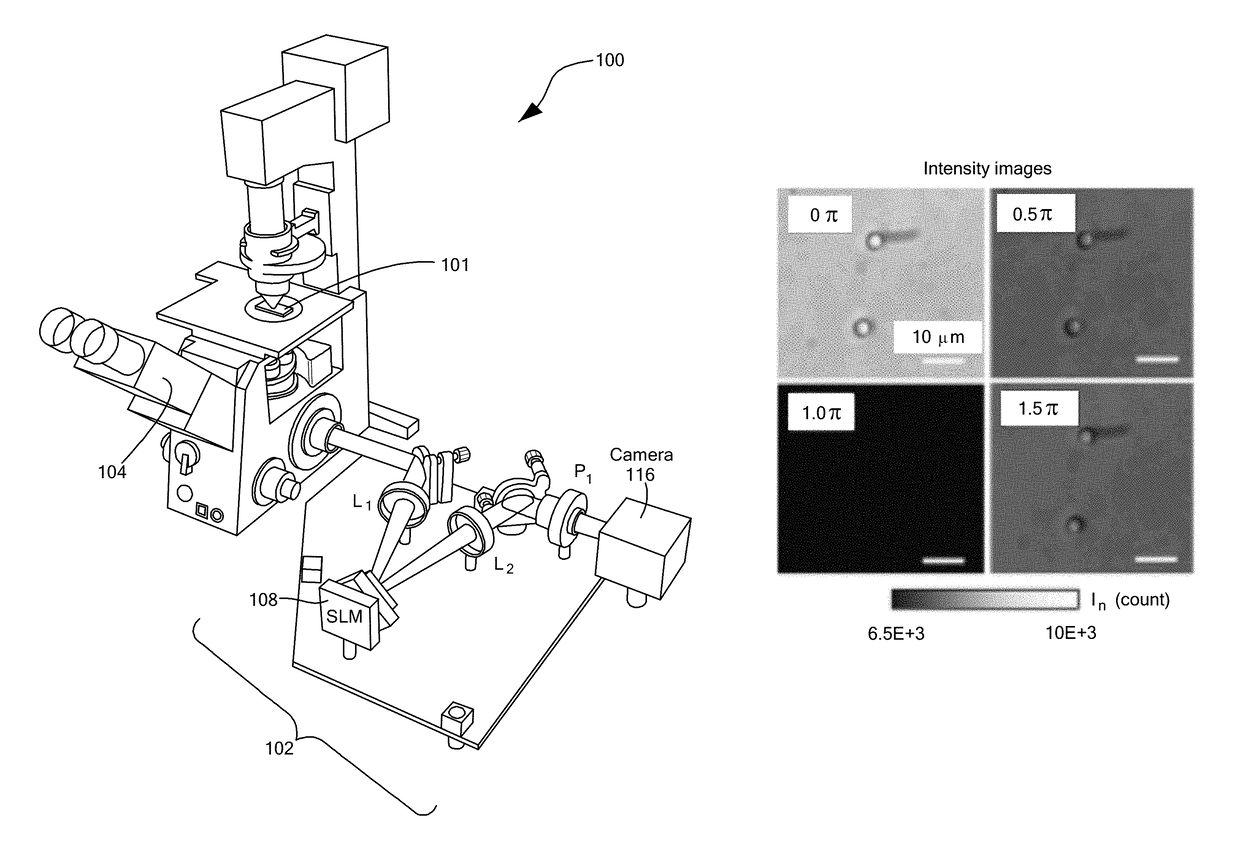
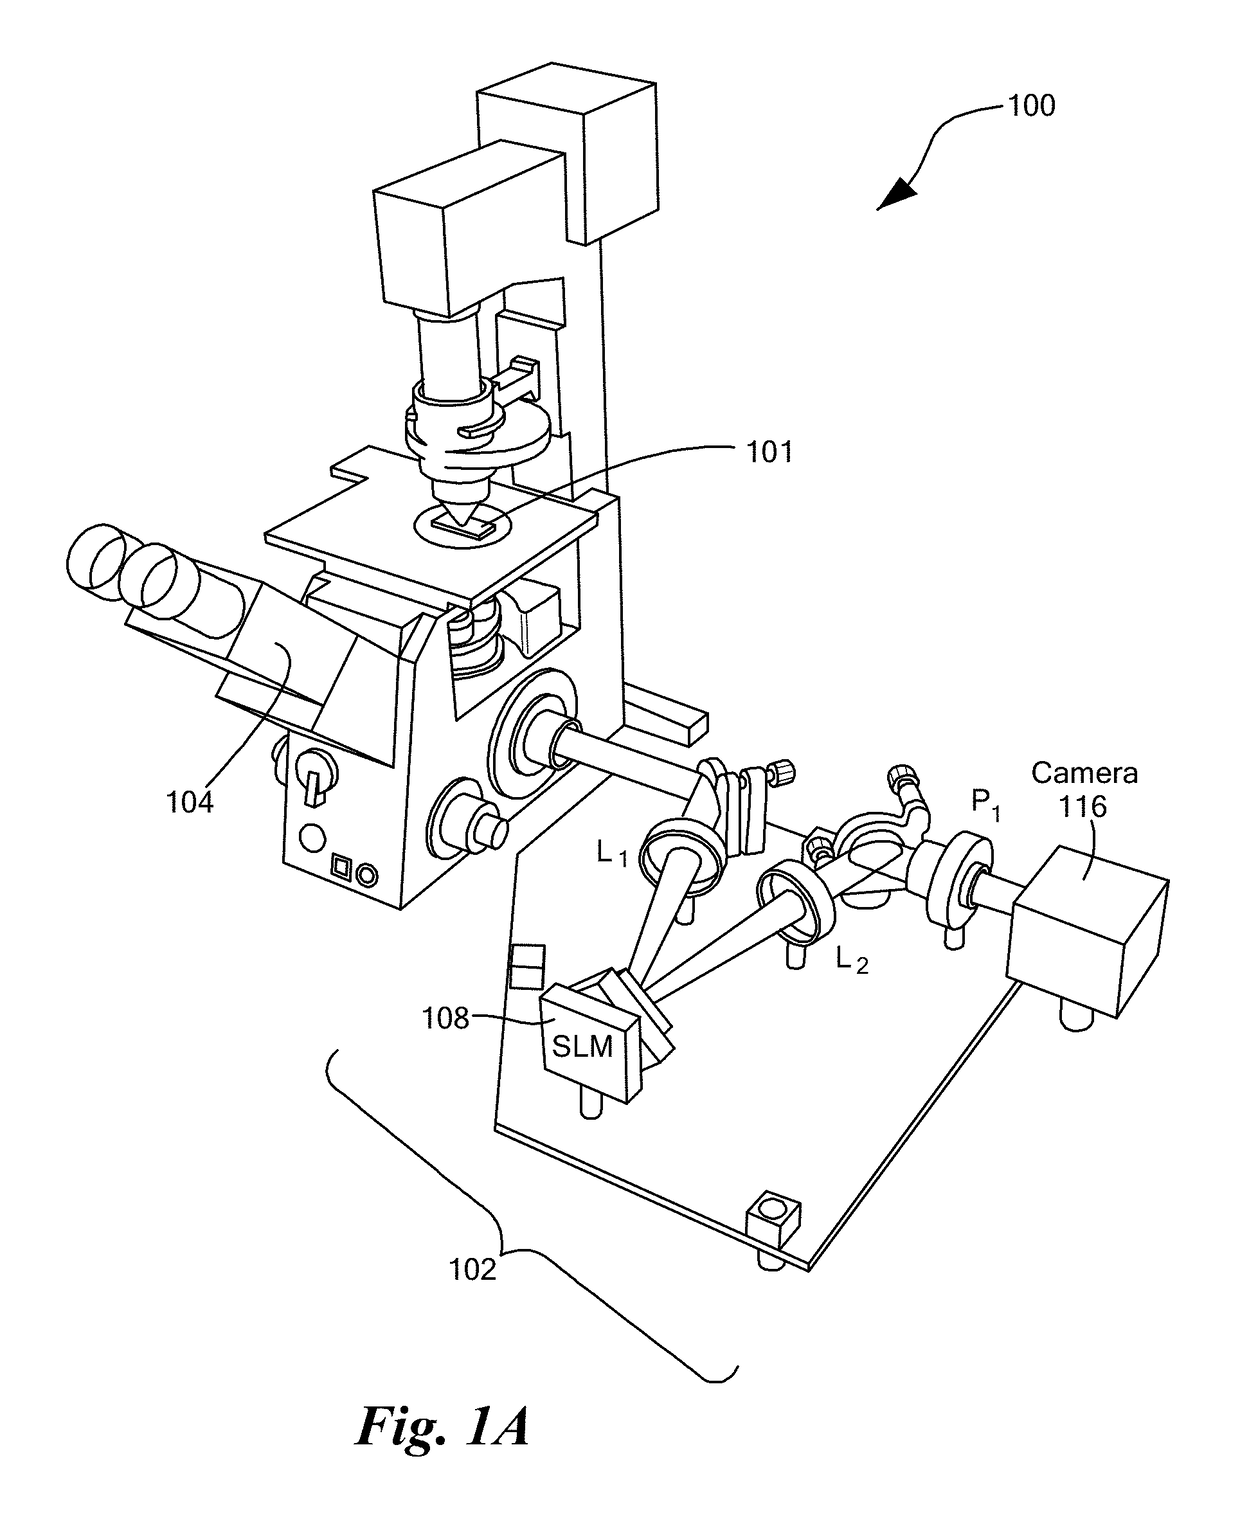
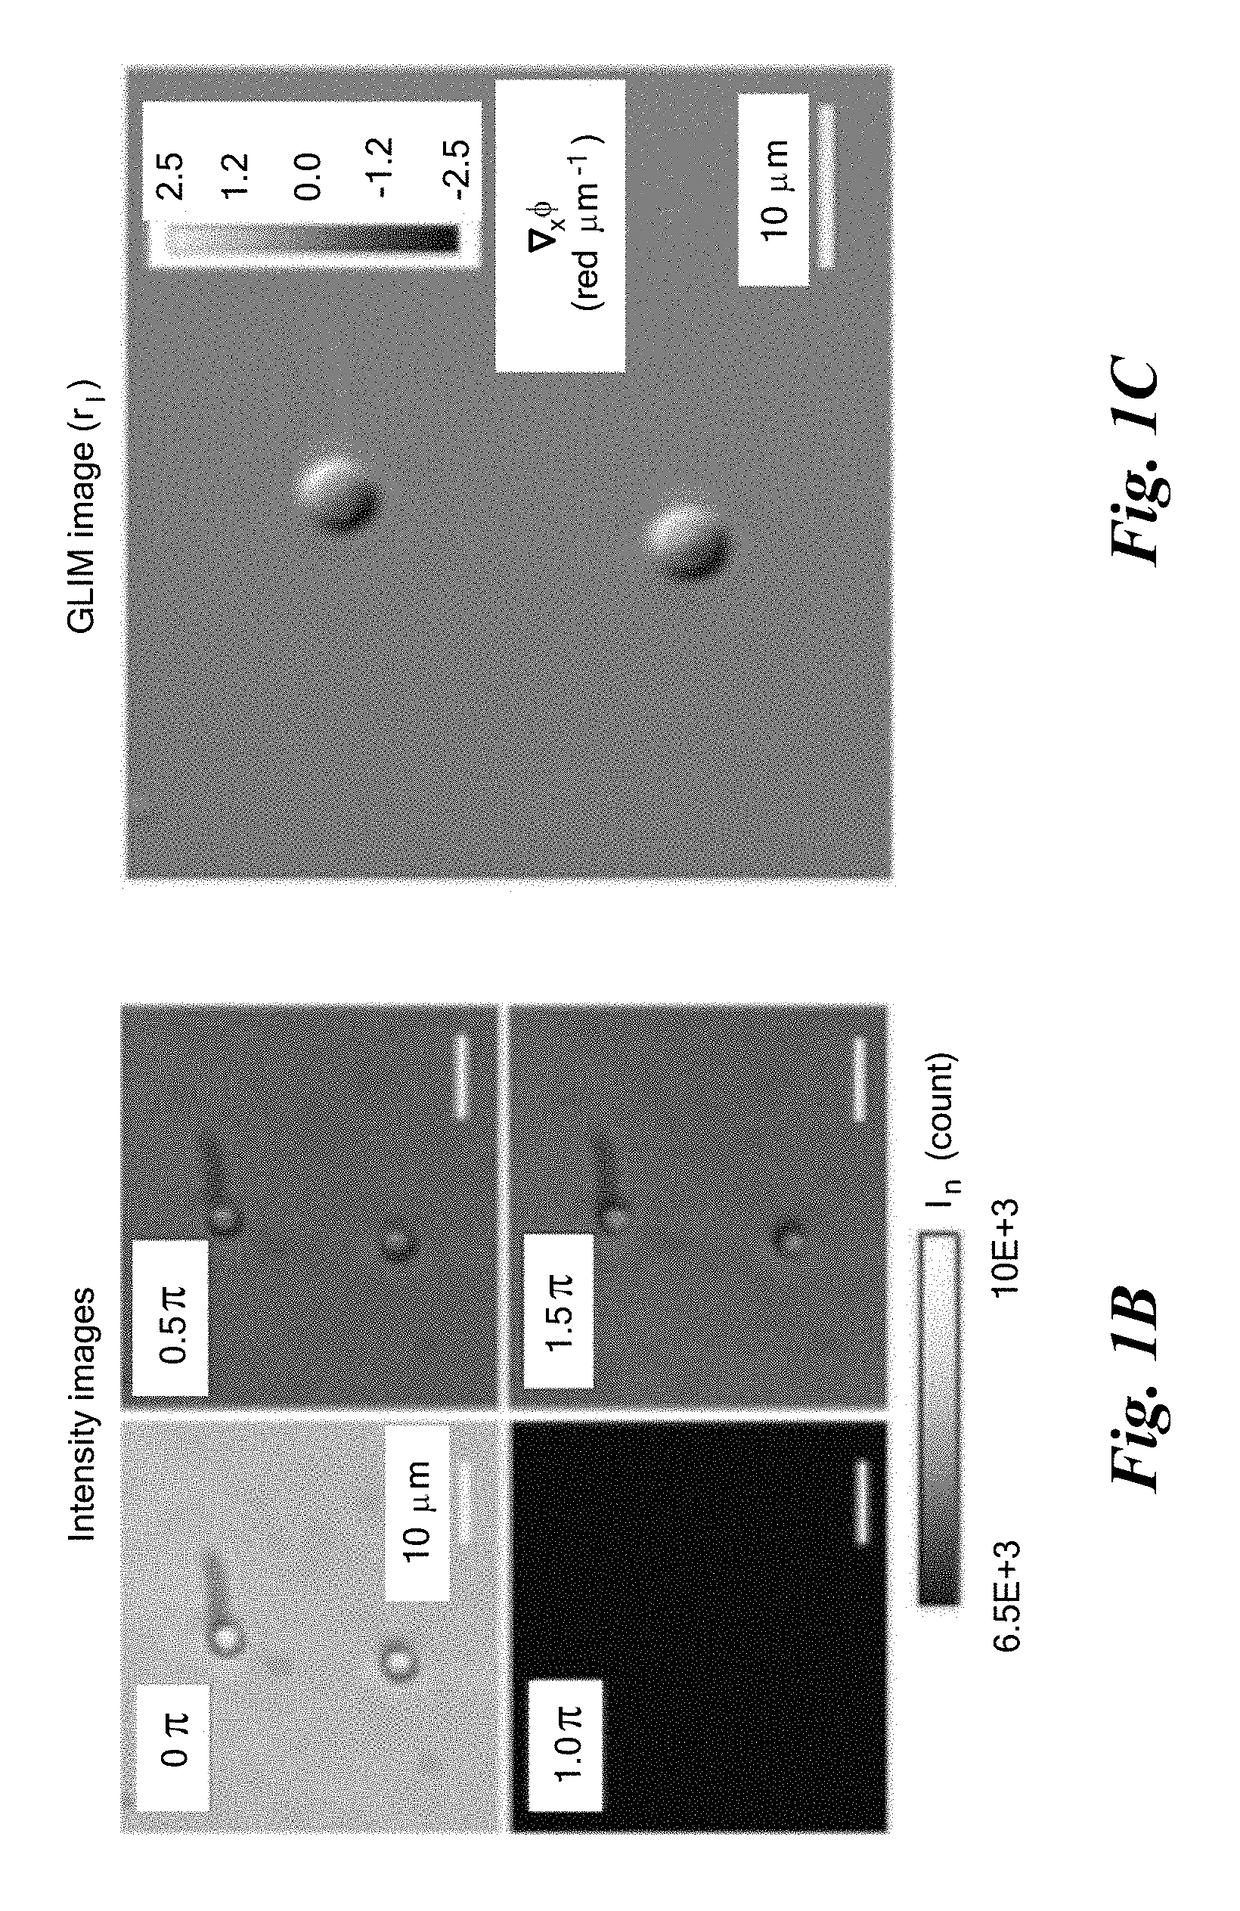
[0055]FIG. 1D demonstrates the capability of GLIM to extract quantitatively the phase gradient, where a 4.5±5% μm polystyrene micro-bead (Polysciences Inc.), with a refractive index value of 1.59 at the central wavelength, is imaged. The beads are immersed in oil (Zeiss Inc.) with a refractive index value of 1.518 to generate a total phase shift of 3.87 radians. FIG. 1D shows the measured phase gradient at NAcon=0.09. FIG. 1D shows the quantitative phase map, ϕ(r), and FIG. 1E displays a line profile through the center of the bead.

example 2

s

[0056]Growth and proliferation of large populations of adherent cells over extended periods of time is demonstrated with reference to FIGS. 2A-2C. Specifically, the culture may be characterized by extracting parameters such as single cell mass, volume, surface area, while simultaneously measuring the intracellular transport on timescales associated with the cell cycle. FIG. 2A shows scanning GLIM data of Hela cells in culture over a 4.48×5.54 mm2 field of view. This image is a mosaic consisting of 16×20 individual frames, imaged by a 40× / 0.75 NA objective, and a condenser aperture (NAcon) adjusted to NAcon=0.32. FIGS. 2B & 2C show magnified views at different scales for a region denoted by the white box in FIG. 2A. The acquisition took approximately 3 minutes for each 16×20 frame, which was assembled into a time-lapse mosaic following the procedure outlined method section. The GLIM image 210 (shown in FIG. 2C) provides a quantitative phase gradient map at the spatial resolution of ...

example 3

y of Single Cells Using GLIM

[0058]Due to the high numerical aperture of the illumination, excellent sectioning capabilities may be advantageously achieved in accordance with embodiments of the present invention, yielding tomographic imaging of both thin and thick samples. Referring now to FIGS. 3A-3M, GLIM tomography was applied to a 30% confluence HeLa cell culture over 21 hours. Seven fields of view (FOVs) were imaged using a 63× / 1.4 NA objective with a spatial sampling rate of 10.8 pixels / μm.

[0059]Each FOV was scanned every 22 minutes. For each time point, the sample was scanned over a total depth of 28 μm with a step size of Δz=0.07 μm. FIGS. 3A and 3B show the x-y and x-z cross-sections of the GLIM measurement, i.e., the quantitative phase gradient. In order to remove the background due to weak sectioning at small scattering angles, a spatial filtering operation was performed. FIGS. 3C and 3D shows the corresponding x-y and x-z cross-sections of the filtering, with yellow arrow...


PUM


Abstract

A system and methods for quantitative optical phase imaging of a sample. First second replica field of an image field are generated, characterized by a respective optical phase, cross-polarized and shifted in a shift direction transverse to a normal to the surface of the sample. The replica fields are Fourier transformed, the second replica field is retarded by four successive phase shifts, and, after inverse Fourier transforming, the first and second replica fields pass through an analyzer polarizer and superposing the first and second replica fields on a detector array to create four successive detector signals. The four successive detector signals are solved to derive a gradient of the optical phase of the image field, which may be integrated to obtain a quantitative phase image.

Description

[0001]The present application claims the priority of U.S. Provisional Patent Application 62 / 425,268, filed Nov. 22, 2016, and incorporated herein by reference.[0002]This invention was made with government support under CBET-0939511 STC and IIP-1353368, awarded by the National Science Foundation. The Government has certain rights in the invention.TECHNICAL FIELD[0003]The present invention relates to systems and methods for quantitative measurement of phase in low-light microscopy of optically thick media, particularly unlabeled cells.BACKGROUND ART[0004]It has become increasingly clear that understanding morphogenesis and disease requires three-dimensional tissue cultures and models. Effective 3D imaging techniques, capable of reporting on subcellular as well as multicellular scales, in a time-resolved manner, are crucial for achieving this goal. While the light microscope has been the main tool of investigation in biomedicine for four centuries, the current requirements for 3D imagi...

Claims


Application Information

Patent Timeline
Patent Type & Authority Patents(United States)
IPC IPC(8): G01B9/02G01B11/24G01B9/04
CPCG01B9/02041G01B11/2441G01B11/24G01B9/04G02B21/0076G02B21/008
Inventor POPESCU, GABRIELKANDEL, MIKHAIL EUGENENGUYEN, TAN HUU
Owner THE BOARD OF TRUSTEES OF THE UNIV OF ILLINOIS
Learn More