Three-dimensional (3D) seismic surveys in the exploration industry can cost tens to hundreds of million dollars.
3D survey data are expensive to acquire because of the necessary short
receiver and source intervals, which are primarily driven by
signal and
noise issues, and the wide range of offsets and azimuths that are required by imaging methods.
No matter how sophisticated the methods used to process the data are, the
processing cannot compensate for a poorly planned 3D survey and inadequate sampling, which can end up making the survey a waste of time and resources if it does not meet its objectives.
Wave-equation methods are more accurate for complex media but are much more computer intensive.
There are a number of limitations to the brute-force methods (full
simulation and comparison) in addition to the cost and time required.
Developing a metric for quantifying the difference between the two imaged volumes from different design scenarios is difficult and often comes down to a “beauty contest.” An
interpreter may look at the images and pick one as being more “geological”.
A second problem is that the geological model is uncertain, and there is no way to validate the sensitivity to changes in the model.
It is prohibitively expensive to compare two full 3D surveys for two or more models.
A third problem with this approach is that this and other approaches do not interrogate the crucial and fundamental need to obtain an accurate velocity model for the imaging.
The method does not evaluate whether or not one survey design is better than another survey design for velocity determination.
Conventional velocity determination is a tedious process that requires subjective input and parameterization, and thus, it is difficult to compare the results of two designs because there can be differences from having two different people doing the determination or from one person doing it twice having learned from the first set.
Rekdal assumes a velocity model for imaging and does not solve for a velocity model or use a
quantitative measure related to the model for evaluation.
A fourth example does test the two geometries for velocity determination, but only in 2D because of the cost and time required.
They
restrict the test to 2D because of speed issues.
Because of the cost and time associated with simulating and
processing 3D data, it is more common to compute and display attributes related to illumination qualities of the acquisition geometry instead of fully processing and imaging the
simulated data.
In the latter case, it is more common to compute only attributes for one target location because of the increase in cost.
The problem with all the attribute methods is that it is not clear how the attributes are linked to the survey objectives and the ability to image a specific area of the subsurface.
It can be difficult to evaluate cost / benefit tradeoffs between different geometries for the purposes of reservoir delineation and characterization.
All of these optimization methods
pose the survey design as an
optimization problem, and it is well recognized that such approaches are extremely nonlinear and difficult to solve.
Moreover, such optimization methods can rarely be applied to large scale experiments such as
full scale 3D seismic surveys.
[1] state that most survey design algorithms are computationally expensive, which imposes severe constraints on applications to realistic design problems.
Even with such advances, the method is unlikely to be fast or robust enough to be used for realistic large scale 3D survey design problems commonly encountered in seismic industry.
Full-wavefield inversion of surface seismic data is an emerging technology for processing seismic surveys; however, even with modern computing power, seismic full wavefield inversion is still a computationally expensive endeavor.
Iterative inversion usually produces a more accurate model than non-iterative inversion, but is much more expensive to compute.
Unfortunately, iterative inversion is so computationally expensive that it is impractical to apply it to many problems of interest.
This high computational expense is the result of the fact that all inversion techniques require many computationally intensive simulations.
The problem is exacerbated for iterative inversion, because the number of simulations that must be computed is proportional to the number of iterations in the inversion, and the number of iterations required is typically on the order of hundreds to thousands.
Since for geophysical problems N is usually very large (usually more than one million), this computation can be extremely
time consuming if it had to be performed for each individual
model parameter.
While computation of the gradients using the adjoint method is efficient relative to other methods, it is still very costly.
In particular, the adjoint method requires two simulations, one forward in time and one backward in time, and for geophysical problems these simulations are usually very compute intensive.
Also, as discussed above, this adjoint method computation must be performed for each measured data gather individually, increasing the compute cost by a factor of Ng.
The compute cost reduction gained by inverting combined sources is at least partly offset by the fact that inversion of the combined data usually produces a less accurate inverted model.
This loss in accuracy is due to the fact that information is lost when the individual sources are summed, and therefore the summed data does not constrain the inverted model as strongly as the unsummed data.
However, for the seismic data case, it is rare that both the source and
receiver for the data to be inverted are within the
region of interest.
Therefore, this improvement has very limited applicability to the
seismic inversion problem.
A problem with this method is that coherent summation of the source gathers necessarily reduces the amount of information in the data.
This information is critical for updating the slowly varying background velocity model, and therefore Berkhout's method is not well constrained.
To overcome this problem, many different coherent sums of the data (e.g. many plane
waves with different propagation directions) could be inverted, but then efficiency is lost since the cost of inversion is proportional to the number of different sums inverted.
Since the compute time is proportional to the area of this aperture, Mora's method does not produce as much efficiency
gain as could be achieved if the summed sources were near each other.
Thus, when summing more than 16 shots, the quality of the inversion was unsatisfactory.
Since non-iterative inversion is not very costly to begin with, and since high
signal-to-
noise ratio inversion is desired, this technique is not widely practiced in the geophysical industry.
A problem with Ikelle's method is that the proposed decoding method will produce separated data having noise levels proportional to the difference between data from adjacent sources.
This noise will become significant for subsurface models that are not laterally constant, for example from models containing dipping reflectors.
Furthermore, this noise will grow in proportion to the number of simultaneous sources.
Due to these difficulties, Ikelle's simultaneous source approach may result in unacceptable levels of noise if used in inverting a subsurface that is not laterally constant.
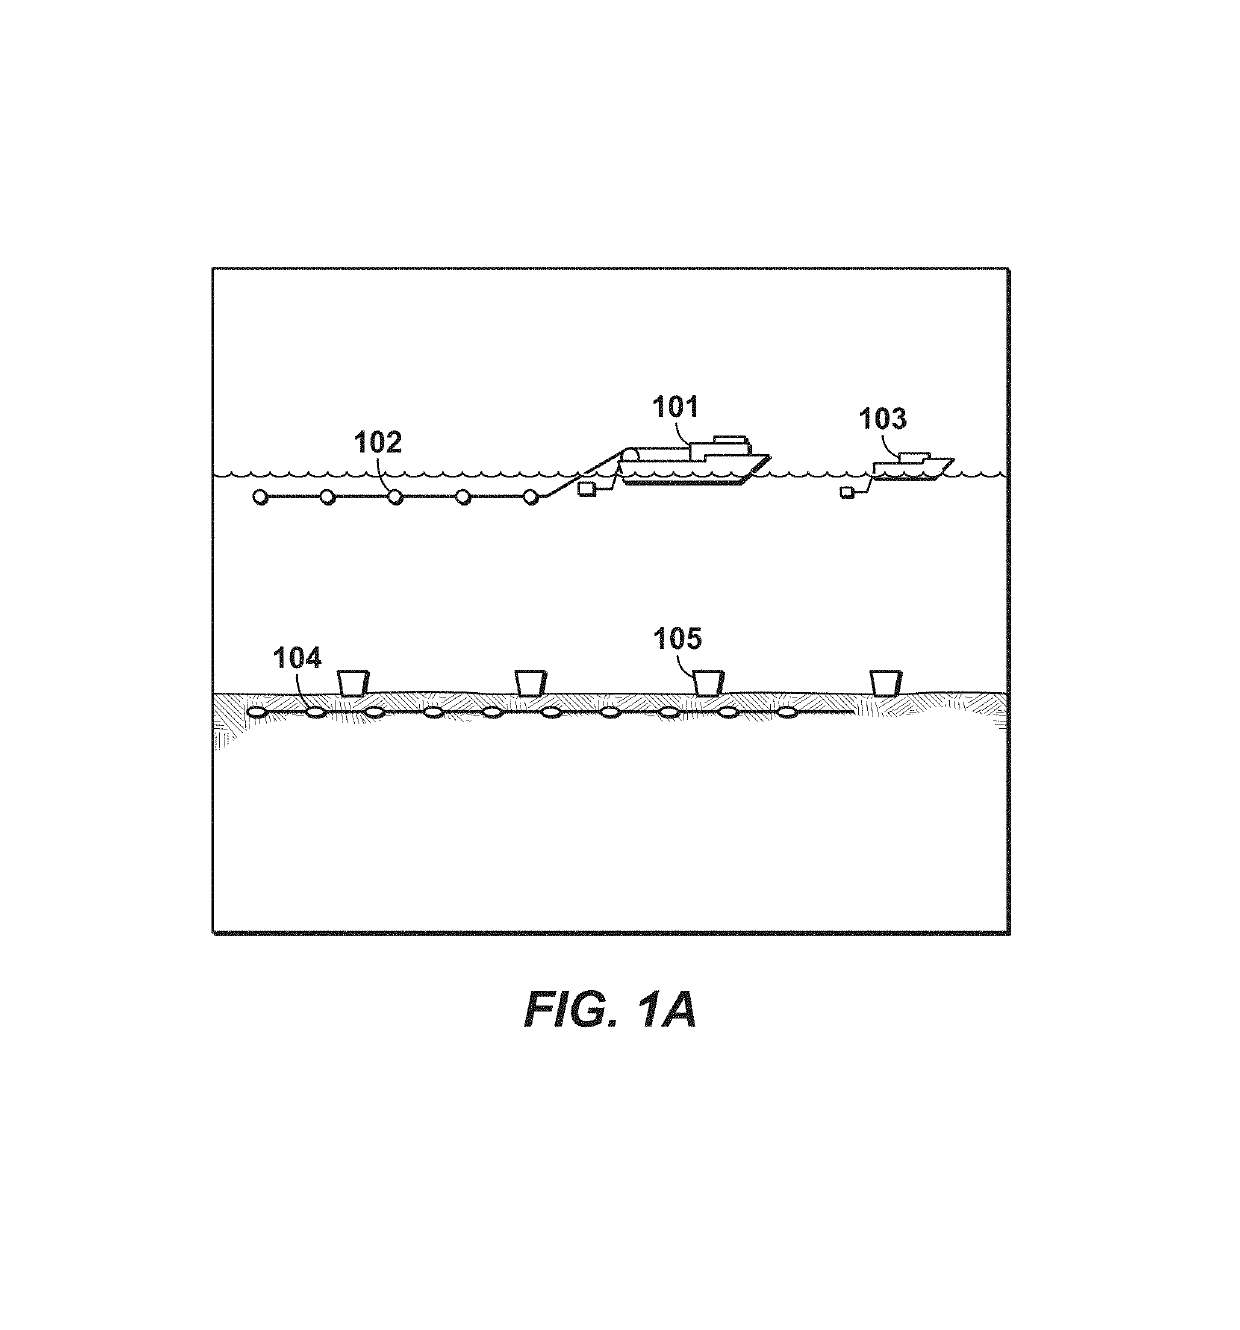
In practice, a fixed-receiver assumption is not strictly valid for most common
field data acquisition geometries.
This also violates the “fixed-receiver assumption.” In addition, due to logistical problems, it is difficult to
record data close to the source, and this means that near-offset data are typically missing.
Both of these factors mean that for a simultaneous source gather, every receiver location will be
missing data for some source shots.

