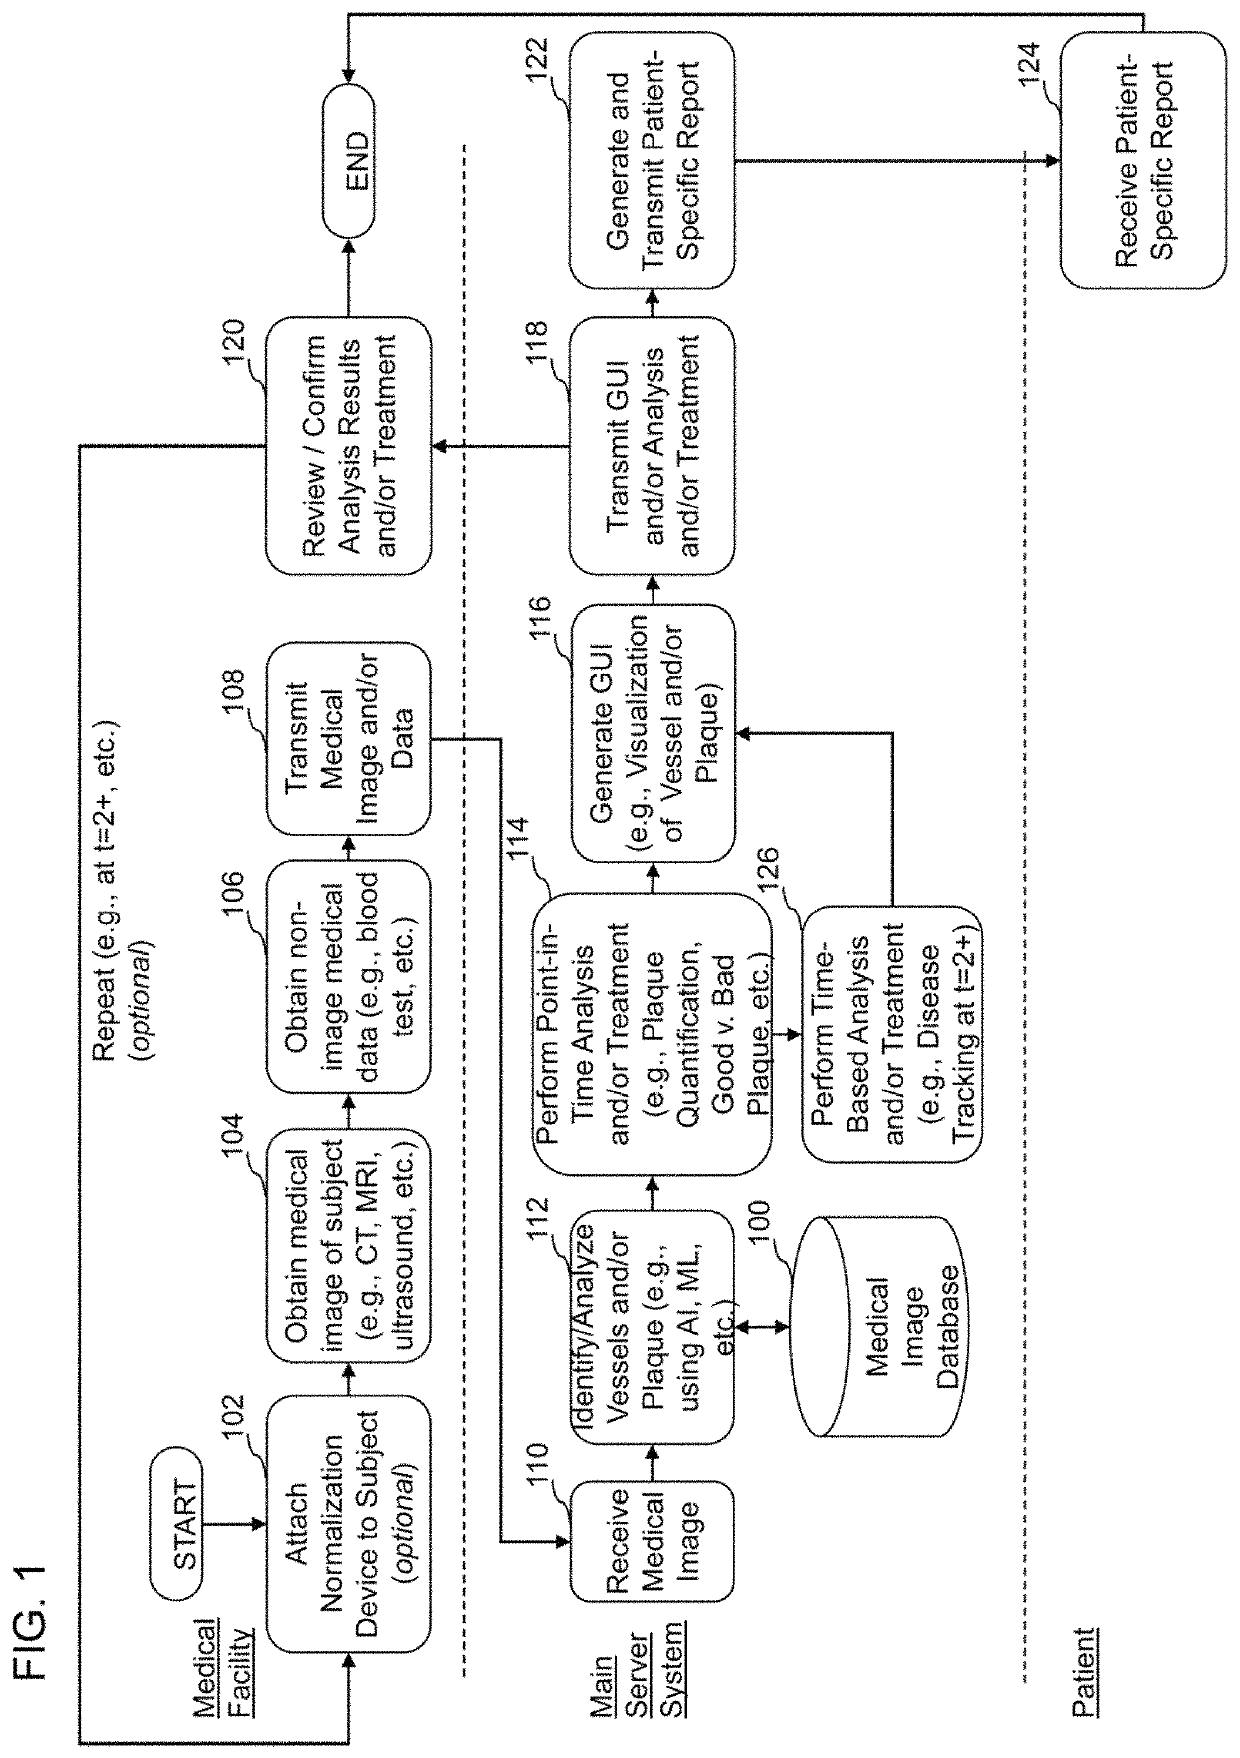
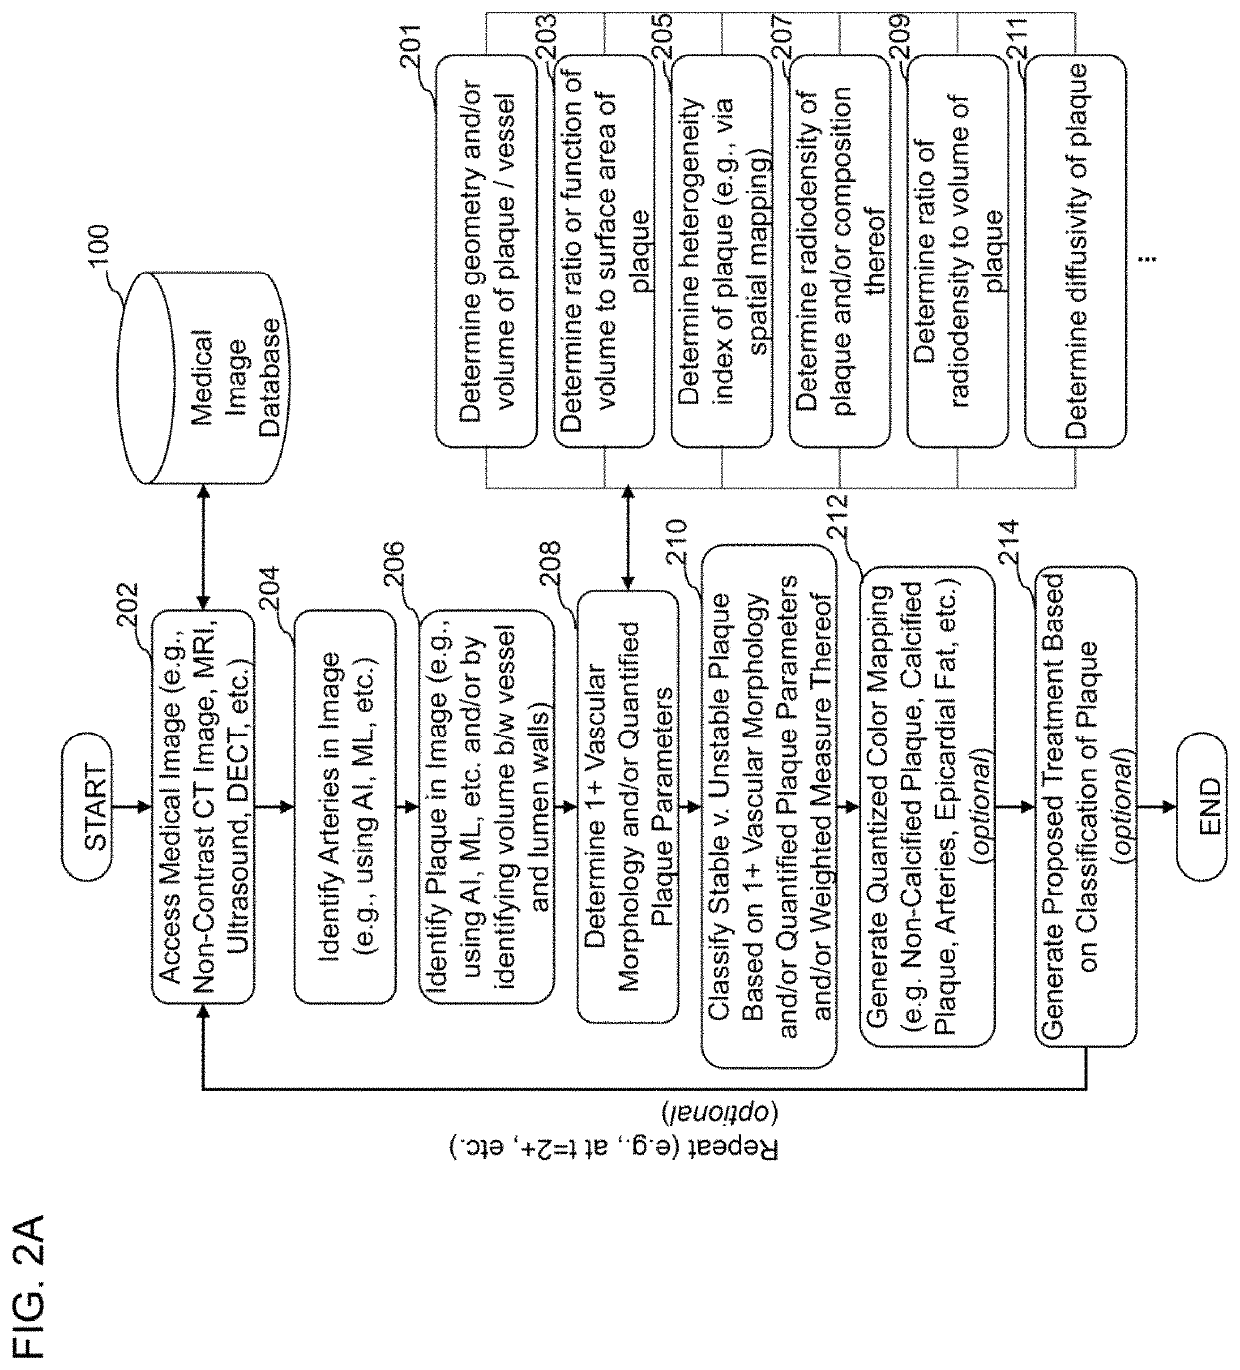
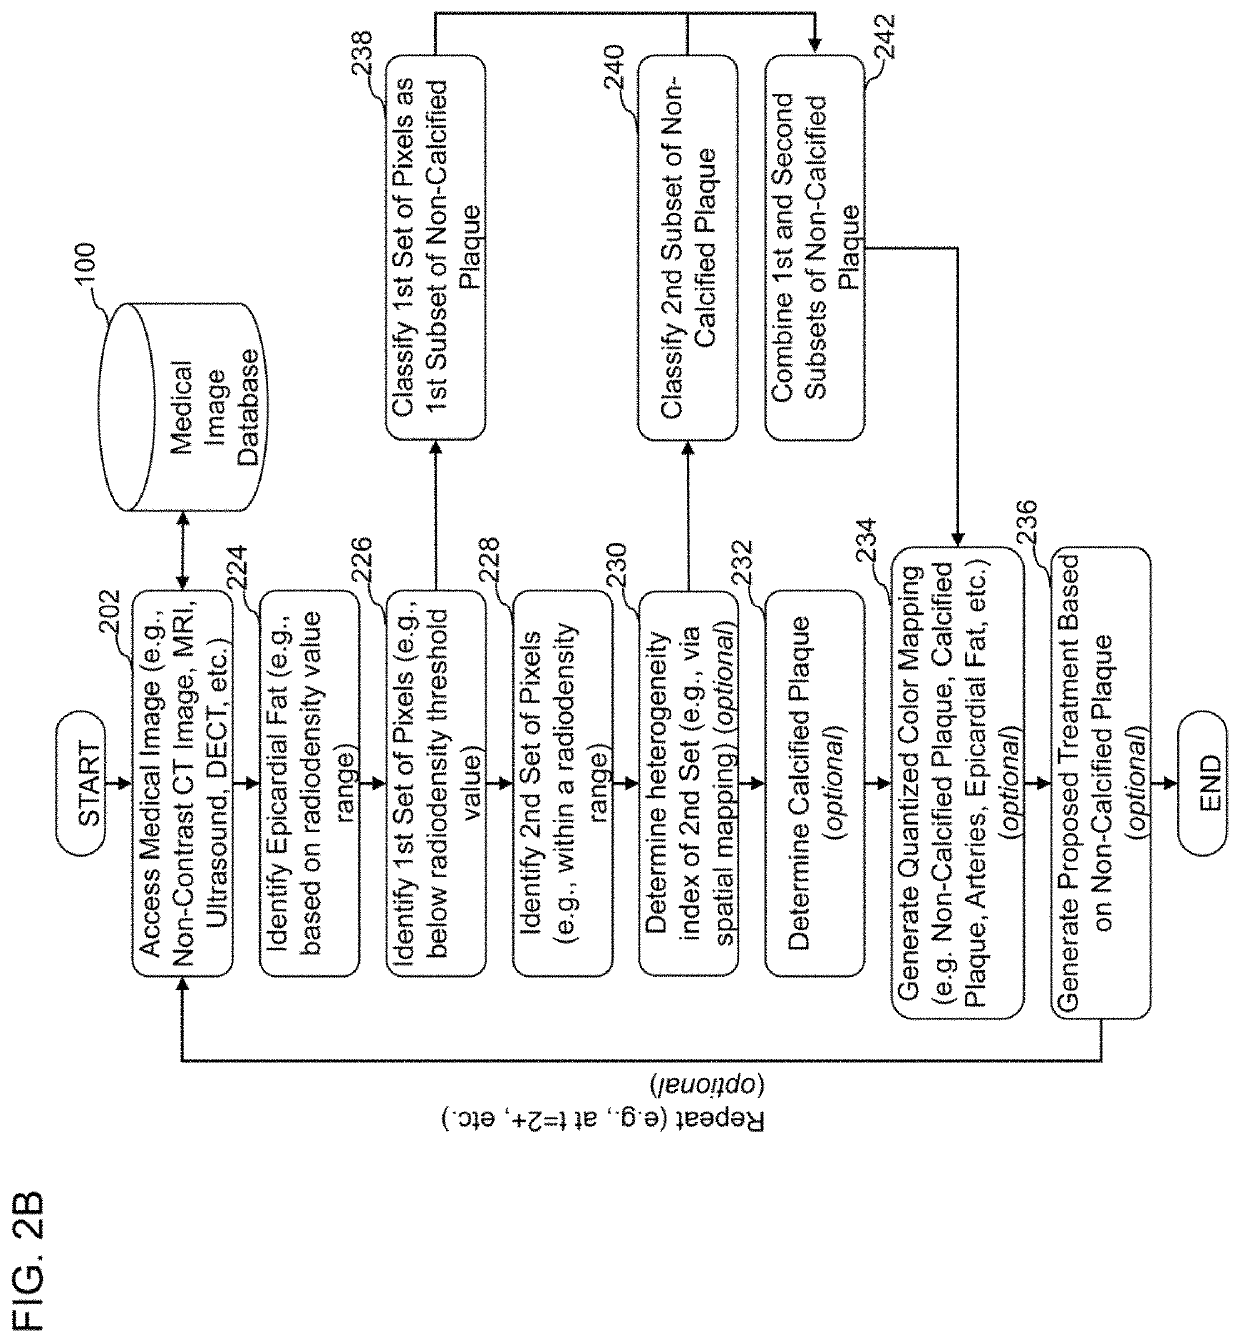
However, a recent federally funded $100 million study calls into question whether the current trends in treating cardiovascular
disease are the most
effective treatment for all types of patients.
For example, in some embodiments of systems, devices, and methods disclosed herein, arteries with “good” or stable plaque or plaque comprising hardened calcified content are considered non-life threatening to patients whereas arteries containing “bad” or unstable plaque or plaque comprising fatty material are considered more life threatening because such bad plaque may rupture within arteries thereby releasing such fatty material into the arteries.
Further, in some instances, it is generally more difficult for blood to flow through fatty plaque buildup than it is for blood to flow through calcified plaque build-up.
Further, while blood tests and
drug treatment regimens are helpful in reducing
cardiovascular health issues and mitigating against cardiovascular events (for example, heart attacks), such treatment methodologies are not complete or perfect in that such treatments can misidentify and / or fail to pinpoint or diagnose significant cardiovascular risk areas.
For example, the mere analysis of the
blood chemistry of a patient will not likely identify that a patient has
artery vessels having significant amounts of fatty deposit material bad plaque buildup along a vessel wall.
Similarly, an angiogram, while helpful in identifying areas of
stenosis or vessel narrowing, may not be able to clearly identify areas of the
artery vessel wall where there is significant buildup of bad plaque.
In certain circumstances, areas where there exist areas of bad plaque can lead to a rupture wherein there is a release of the fatty materials into the bloodstream of the
artery, which in turn can cause a clot to develop in the artery.
A blood clot in the artery can cause a stoppage of
blood flow to the heart tissue, which can result in a heart
attack.
This is stark contrast to existing measures today which do not produce reproducible prognosis or assessment, take extensive amounts of time, and / or require invasive procedures.
As a result, even if two different scans were taken of the same subject, the brightness and / or
darkness of the resulting medical image may be different, which can result in less than accurate analysis results processed from that image.
However, in some embodiments, such CT image can comprise a non-contrast CT image, in which case it can be more difficult to identify and / or determine non-calcified plaque due to its low radiodensity value and overlap with other low radiodensity values components, such as blood for example.
For example, even if analyzing a DECT or spectral CT image, in some embodiments, the distinction between certain areas of blood and / or low-attenuated or non-calcified plaque may not be complete and / or accurate.
For example, based on the comparison, the
system may increase or decrease the previously generated
risk assessment.
For example, based on the comparison, the
system may increase or decrease the previously generated
risk assessment.
For example, based on the comparison, the
system may increase or decrease the previously generated
risk assessment.
Prior to the embodiments described herein, it was not feasible to quantify the
primary disease due to the lengthy manual process and manpower needed to do so, which could take anywhere from 4 to 8 or more hours.
This is in contrast to preexisting methods of determining a CAD-RADS based on eyeballing or general assessment of a medical image by a physician, which can result in unreproducible results.
As a non-limiting example, if a
calcium plaque increases in density, this may represent a stabilization of plaque by treatment or lifestyle, whereas if a new
calcium plaque forms where one was not there before (particularly with a lower attenuation density), this may represent an adverse finding of
disease progression rather than stabilization.
However, as discussed above, this alone typically does not provide insight as to the cause of the change in
calcium score, if any.
In some embodiments, by determining one or more patient-specific
stent parameters that are best suited for a particular artery area, the system can reduce the risk of patient complications and / or insurance risks because if too large of a stent is implanted, then the artery wall can be stretched too thin resulting in a possible rupture, or undesirable high flow, or other issues.
On the other hand, if too small of a stent is implanted, then the artery wall might not be stretched open enough resulting in too little
blood flow or other issues.
The plaque can burst, triggering a blood clot.
Although atherosclerosis is often considered a heart problem, it can affect arteries anywhere in the body.
However, determining information about plaque in
coronary arteries can be difficult due in part to imperfect
imaging data, aberrations that can be present in coronary artery images (e.g., due to movement of the patient), and differences in the manifestation of plaque in different patients.
Without using the present system and methods of the disclosure, quickly selecting, displaying, and analyzing CT images and coronary artery information, can be cumbersome and inefficient, and may lead to analyst missing critical information in their analysis of a patient's
coronary arteries, which may lead to inaccurate evaluation of a patient's condition.
Although some systems may allow an analyst to view the CT images associated with a patient, they lack the ability to display all of the necessary views, in real or near real-time, with correspondence between 3-D artery tree views of
coronary arteries specific to a patient, multiple SMPR views, and a cross-sectional, as well as an axial view, a sagittal view, and / or the coronal view.
As an example, in CT, partial volume artifacts from calcium are a known artifact of CT that results in overestimation of the volume of calcium and the narrowing of an artery.
As a result, even if two different scans were taken of the same subject, the brightness and / or
darkness of the resulting medical image may be different, which can result in less than accurate analysis results processed from that image.
Varying any of these parameters, may produce slight differences in the resulting medical images, even if the same subject is scanned.
Additionally, the type of reconstruction used to prepare the image after the scan may provide differences in medical images.
Use of different or emerging
medical imaging technologies can also cause slight differences between images.
These slight differences can, in some instances, negatively
impact analysis of the image, especially where analysis of the image is performed by
artificial intelligence or
machine learning algorithms that were trained or developed using medical images captured under different conditions.
Notably, however, the conventional phantoms do not provide a normalization function that allows for normalization of the resulting medical images across different machines, different parameters, different patients, etc.
In some embodiments, the normalization of medical scanning data can be necessary for the AI
processing methods disclosed herein because in some instances AI
processing methods can only properly process medical scanning data when the medical scanning data is consistent across all medical scanning data being processed.
This can be even more problematic as the relationship of specific material densities may not be not constant, and even may change in an non linear way depending on the material and on the scanning parameters.


