

Method for deconvolution of impedance spectra
a technology of impedance spectra and impedance spectra, which is applied in the direction of resistance/reactance/impedence, material impedance, instruments, etc., can solve the problems of affecting the mechanical system using the fluid, affecting the performance characteristics of the fluid, and contaminated fluids
- Summary
- Abstract
- Description
- Claims
- Application Information
AI Technical Summary
Benefits of technology
Problems solved by technology
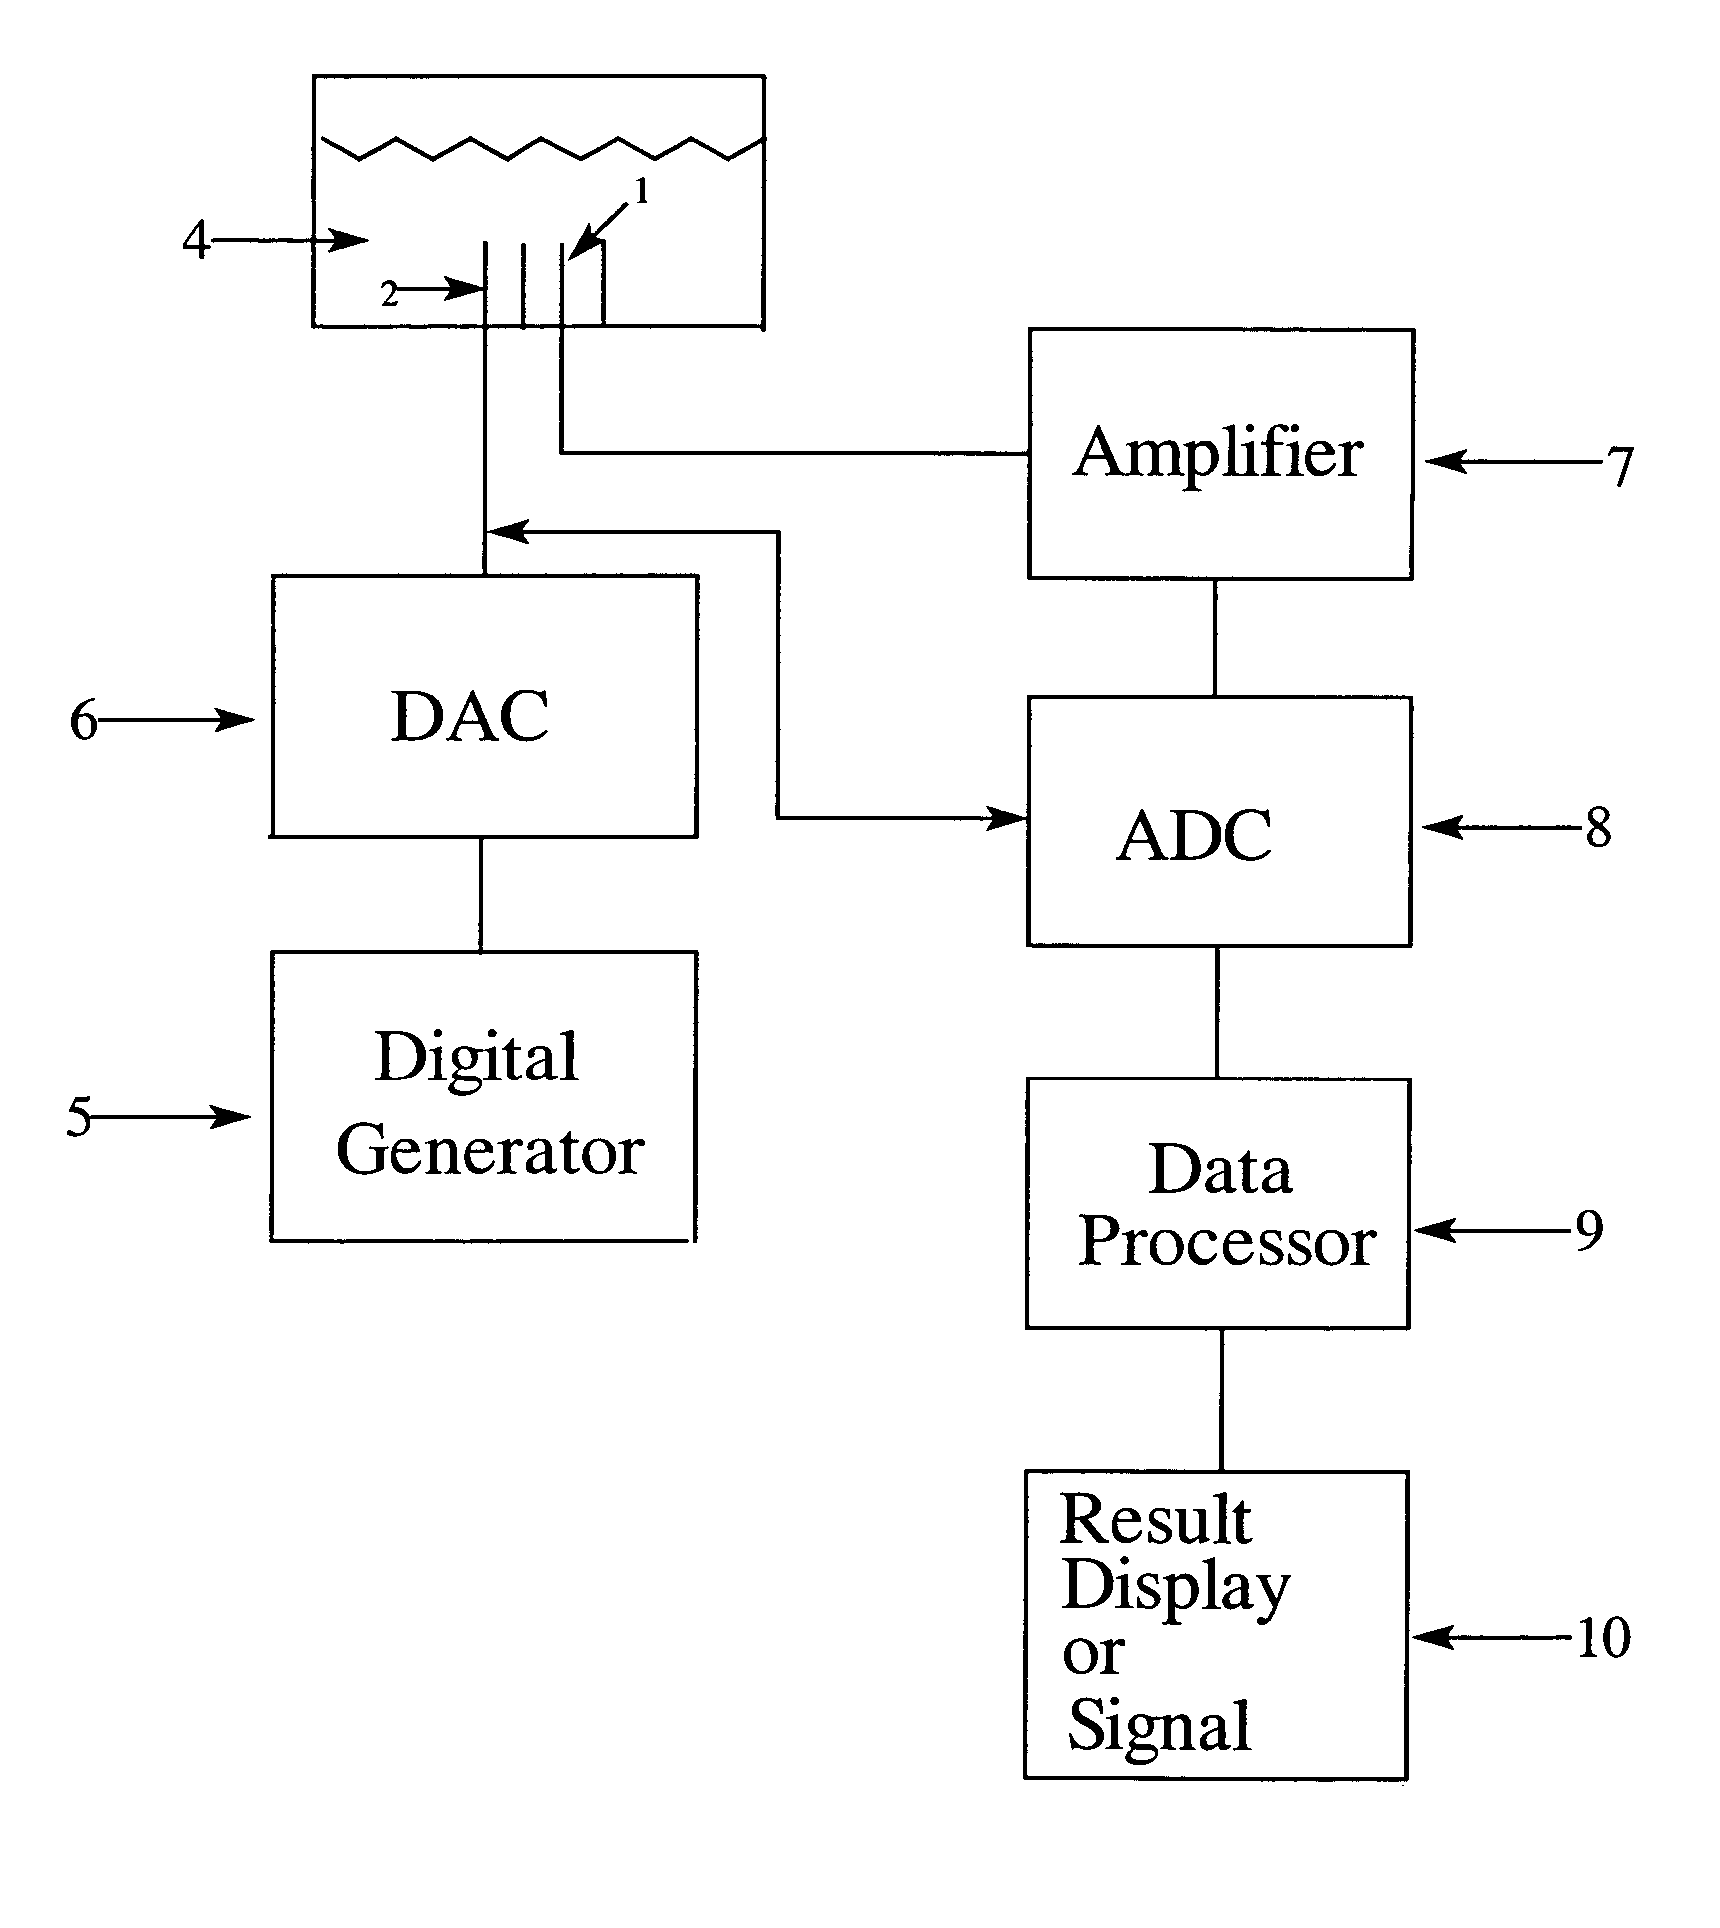
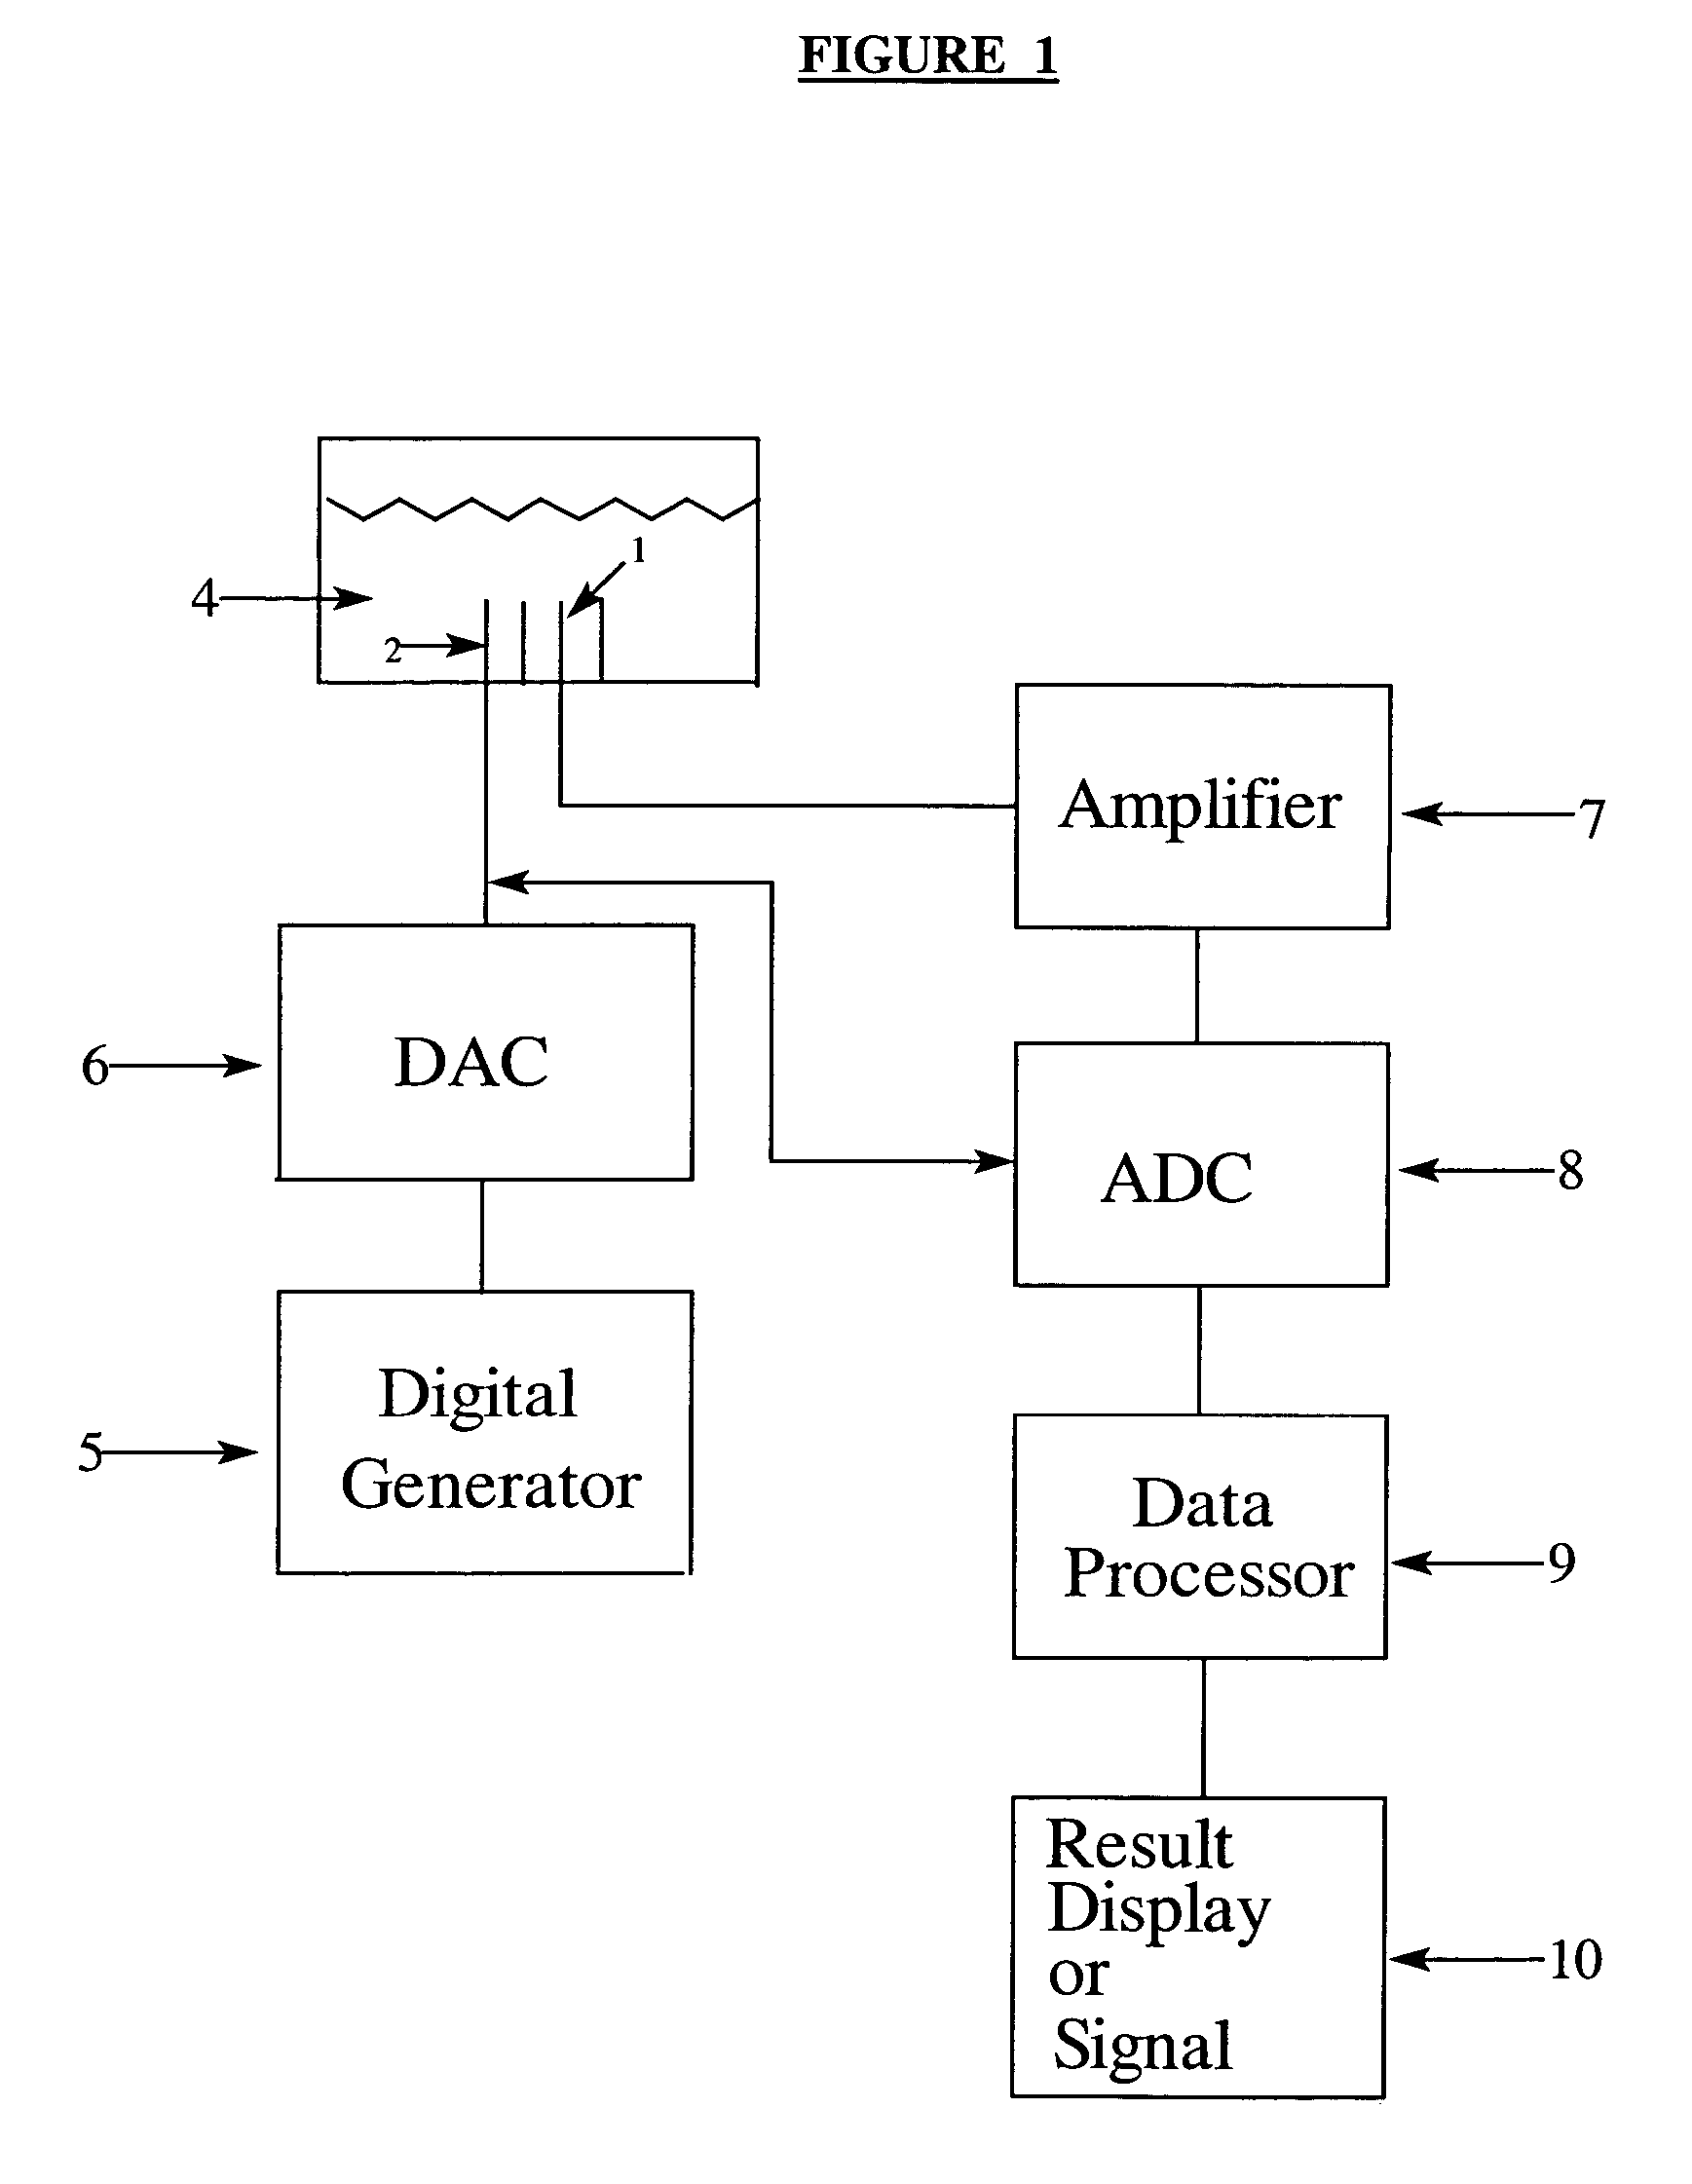
Method used
Image

Examples
example 1
Dielectric constant, relative humidity, and temperature measurements were made for an industrial oil X over a 500 hour time period in a lubricant rig test. Results of this test are shown in FIG. 3 and are represented as curves A, B and C corresponding to dielectric constant, water and temperature respectively. Curve-A shows two distinct changes or peaks. It is to be noted the peaks are negative peaks on the dielectric spectrum (Curve-A). The first change in the dielectric signal corresponding to the first peak is contamination, in this case water. The next observable change is the second peak. This peak can be assigned to a temperature decrease. By combining the two lubricant property sensors in this experimental set these distinctions are made and result in deconvolution of the impedance spectrum. Further, interpretation of the deconvoluted impedance spectrum provides information that the lubricant oil has gradually reduced performance over the course of 500 hour time period.
example 2
Six different paper machine oils were oxidized by heating them in an oven at 140 C for 12 days with copper and steel rods, which served as catalysts to increase oxidation rate. Periodically samples were withdrawn from the containers and analyzed by measuring their optical absorbance (A) at 800 nm through a 1 cm thick liquid sample. Samples were also analyzed using AC impedance spectroscopy at multiple frequencies and resistance, R, was calculated. Kinematic viscosity was measured for each sample by the ASTM D 455 method. FIG. 4 shows a plot of measured viscosity ratio (viscosity of sample / viscosity of fresh oil ie., oil before commencement of oxidation) determined by the ASTM D 455 method versus the viscosity ratio calculated using the expression: VR={RR+C1+C2(A−C3)} / C4 where C1, C2, C3 and C4 are 5.481, 0.559, 0.221 and 6.439 respectively. The observed linearity of the plot is an illustration of one embodiment of the instant invention ie., method to determine viscosity ratio of a ...
PUM
 Abstract
Description
Claims
Application Information