
Mass spectrometry with selective ion filtration by digital thresholding

Inactive Publication Date: 2005-12-08
IBIS BIOSCI
View PDF81 Cites 43 Cited by
  • Summary
  • Abstract
  • Description
  • Claims
  • Application Information

AI Technical Summary

Benefits of technology

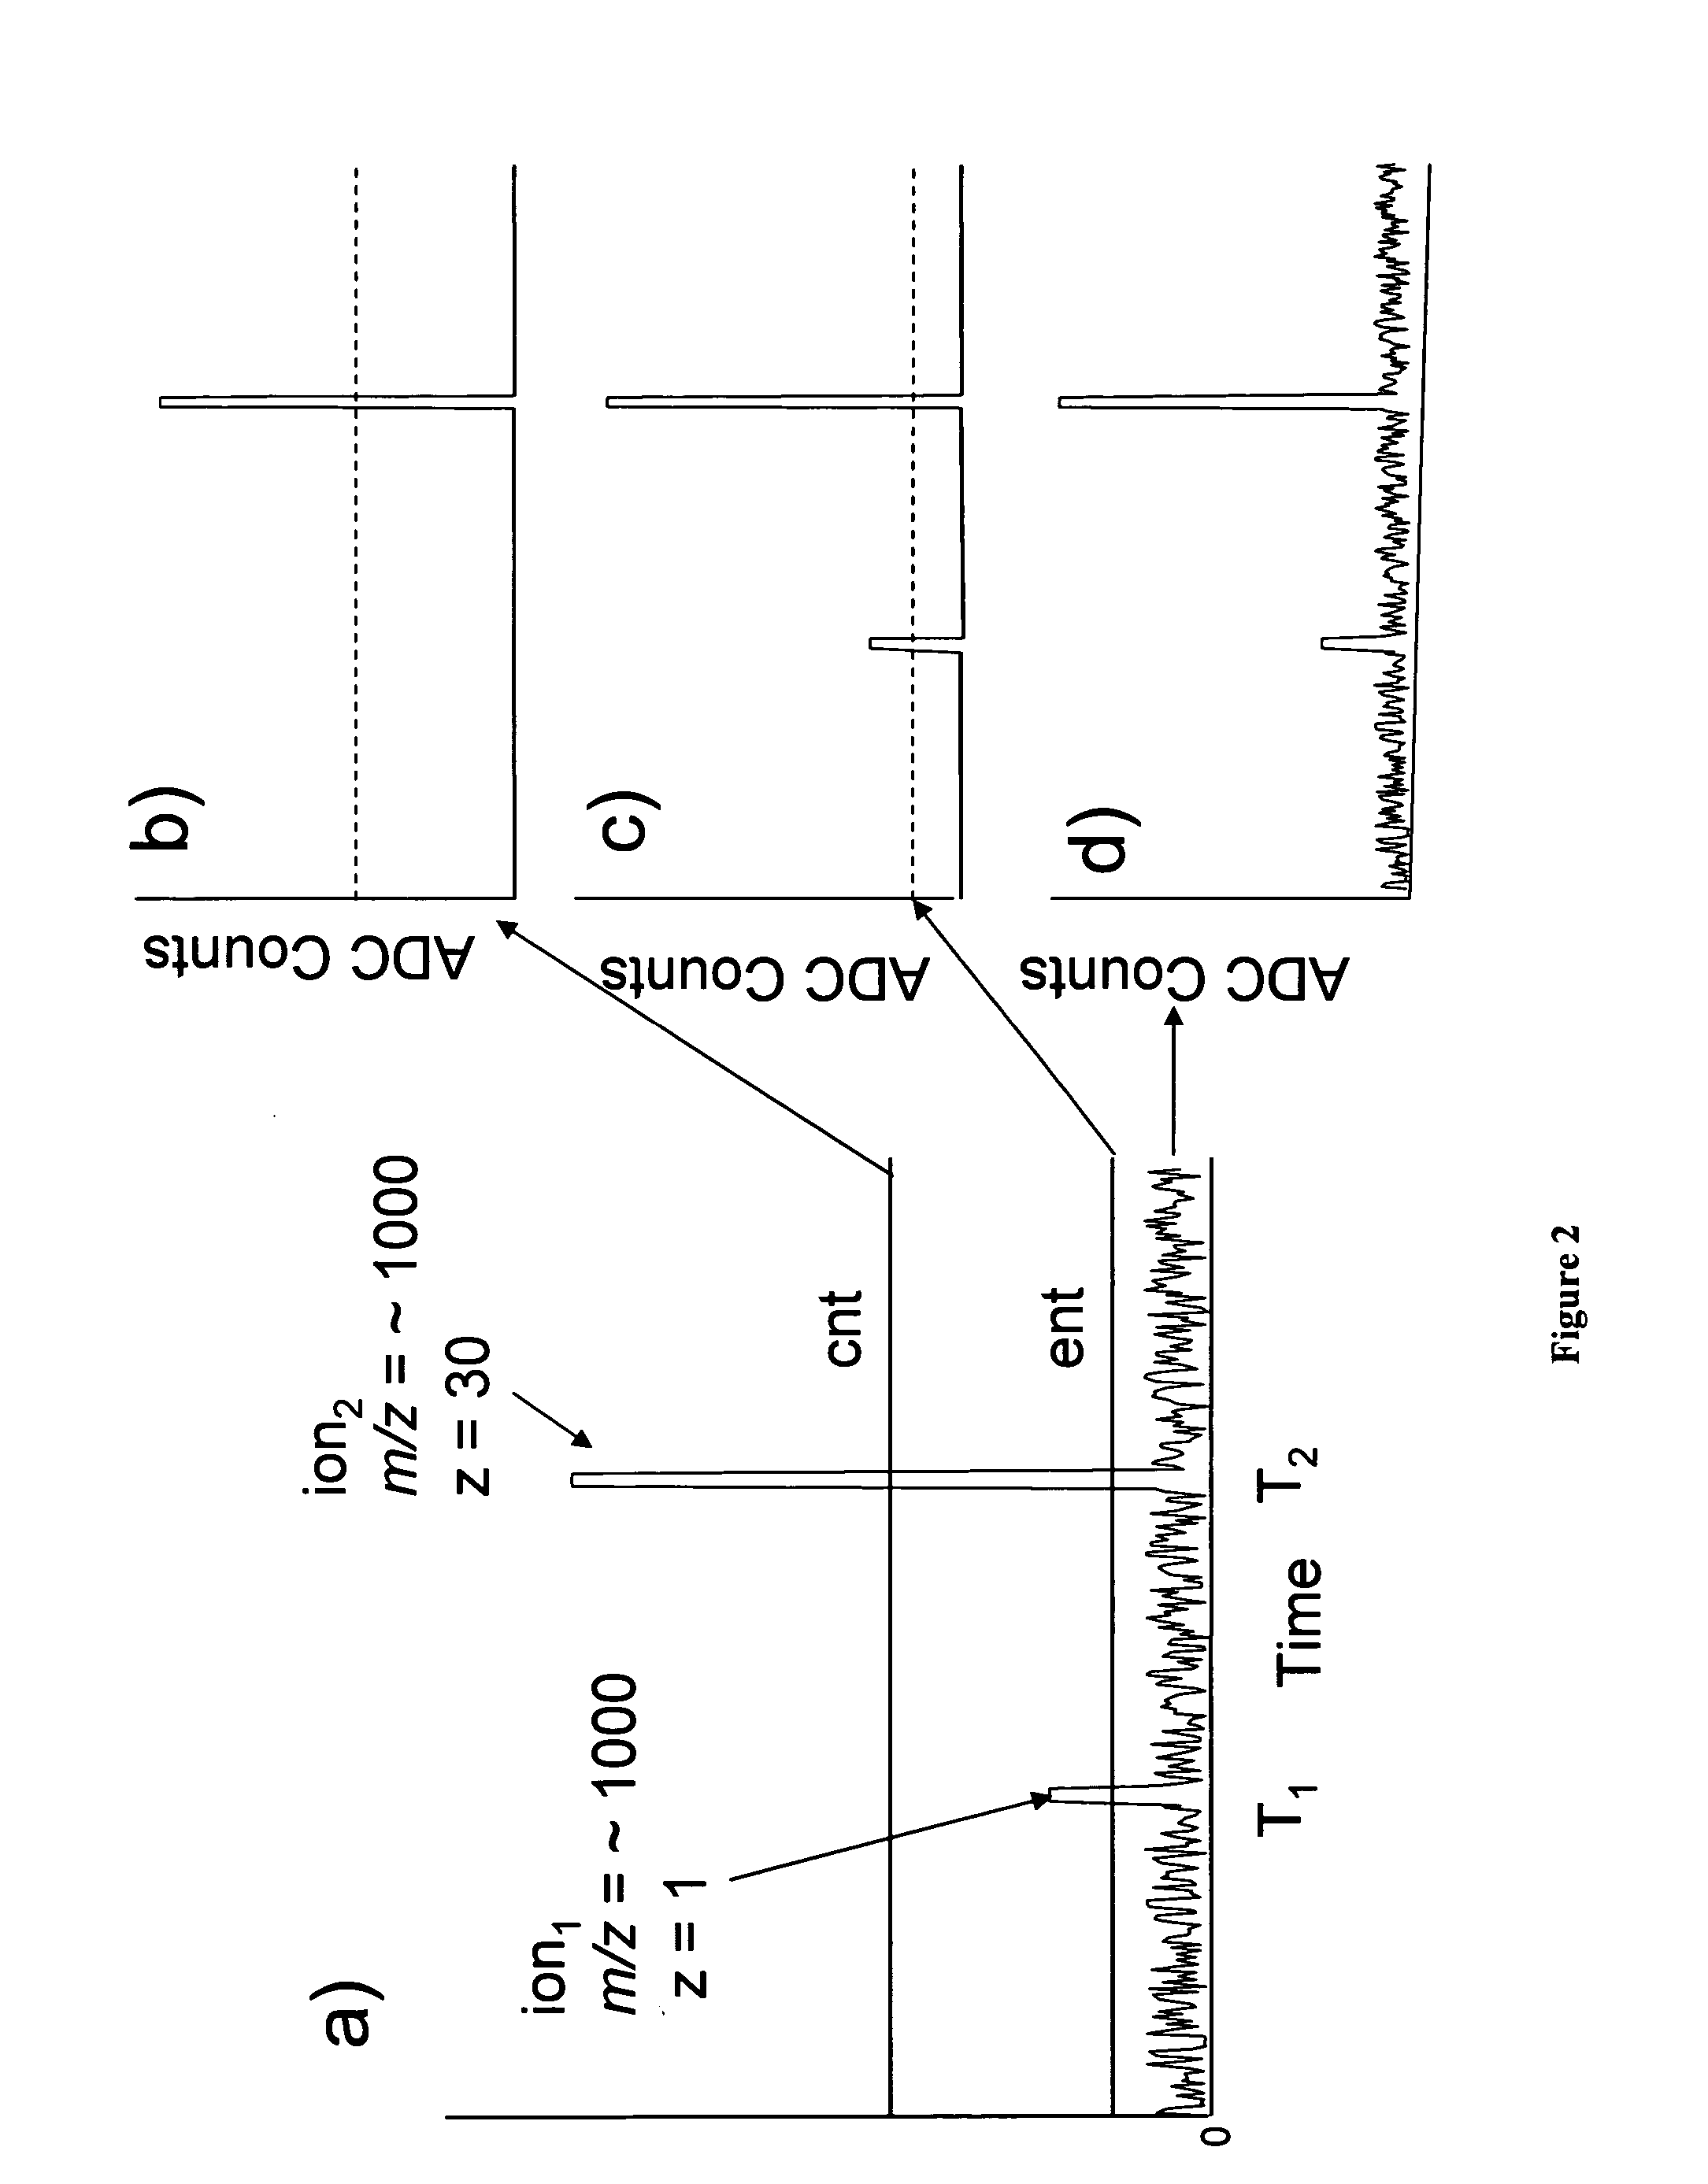
[0013]FIG. 2 is a schematic representation of the effects of specifying digital signal thresholds on mass spectra. FIG. 2a depicts the raw digitizer (ADC, analog digital converter) output from a theoretical single scan containing a singly-charged ion (ion1) which strikes the detector at T1 and a large multiply-charged ion (ion2) which strikes the detector at T2. FIGS. 2b and 2c indicate a spectrum with a high and low digital signal threshold respectively. FIG. 2d indicates a spectrum without a digital signal threshold and detector “white noise” is visible in the spectrum.
[0014]FIG. 3 displays mass spectra of a PCR product. FIG. 3a is an ESI-TOF mass spectra of a 140-mer PCR product acquired at a normal (3 mV) digital threshold setting. The sample contains a contaminating amount of polypropylene glycol (PPG) relatively high levels of singly charged peptides (which serve as internal mass standards). Peaks labeled with “x” indicate signals from the PPG and “c” represents signals from the peptide mass standards. FIG. 3b is an ESI-TOF spectrum of the same sampl

Problems solved by technology

Low molecular weight chemical noise is often the limiting factor in overall MS performance as the presence of high levels of low molecular weight components, such as polymers and buffer constituents, can drastically limit the spectral dynamic range and adversely affect mass accuracy.

Method used


Image

  • Mass spectrometry with selective ion filtration by digital thresholding
  • Mass spectrometry with selective ion filtration by digital thresholding
  • Mass spectrometry with selective ion filtration by digital thresholding

Examples


example 1

ESI-TOF Mass Spectrometry Conditions

[0029] A Bruker Daltonics (Billerica, Mass.) MicroTOF ESI time-of-flight (TOF) mass spectrometer was used in this work. Ions from the ESI source undergo orthogonal ion extraction and are focused in a reflectron prior to detection. Ions are formed in the standard MicroTOF ESI source which is equipped with an off-axis sprayer and glass capillary. For operation in the negative ion mode, the atmospheric pressure end of the glass capillary is biased at 6000 V relative to the ESI needle during data acquisition. A counter-current flow of dry N2 is employed to assist in the desolvation process. External ion accumulation is employed to improve ionization duty cycle during data acquisition. Each ESI-TOF spectrum is comprised of 75,000 data points digitized over 75 μs. All aspects of data acquisition were controlled by the Bruker MicroTOF software package. Post processing of data was also performed using the standard Bruker software.

example 2

PCR Conditions and Purification of Amplification Products

[0030] All PCR reactions were assembled in 50 μL reaction volumes in a 96 well microtiter plate format using a Packard MPII liquid handling robotic platform and M. J. Dyad thermocyclers (MJ research, Waltham, Mass.). The PCR reaction mix consists of 4 units of Amplitaq Gold, 1× buffer II (Applied Biosystems, Foster City, Calif.), 1.5 mM MgCl2, 0.4M betaine, 800 μM dNTP mix and 250 nM of primer. The following PCR conditions were used: 95° C. for 10 min followed by 50 cycles of 95° C. for 30 sec, 50° C. for 30 sec, and 72° C. for 30 sec.

[0031] PCR products were purified using the protocols disclosed and claimed in U.S. patent application Ser. No. 10 / 943,344 which is commonly owned and incorporated herein by reference in entirety.

example 3

Investigation of Detection Efficiency of Large Oligonucleotide Ions

[0032] In an attempt to optimize detection efficiency of large oligonucleotide ions, and to better understand the relationship between ion arrival statistics and mass accuracy, a detailed systematic study was designed to investigate detector response as a function of molecular weight, m / z, and charge state at the individual ion level.

[0033] In time of flight mass spectrometry ions are separated based on differences in their velocity as they traverse the flight tube. As ions strike the detector, their arrival times are recorded and subsequently converted to m / z based on the specific configuration of the spectrometer (length of flight path, accelerating voltage, geometry, etc.). It is generally accepted that for singly charged species, detector response is inversely proportional to molecular weight (velocity) and, for example in the case of MALDI, higher molecular weight species induce a smaller detection signal than...


PUM


Abstract

The methods described herein generally relate to characterization of large analytes, such as biomolecules, by molecular mass analysis. Specifically, the methods are directed to molecular mass analysis of singly- or multiply-charged ions by selective ion filtering carried out by a digital thresholding process.

Description

CROSS-REFERENCE TO RELATED APPLICATIONS [0001] This application claims the benefit of priority of U.S. Provisional Application Ser. No. 60 / 574,042 filed May 24, 2004, the entire disclosure of which is incorporated herein by reference in its entirety.FIELD OF THE INVENTION [0002] The invention relates to the field of detection and characterization of large analytes, such as biomolecules, by molecular mass analysis. BACKGROUND OF THE INVENTION [0003] Mass spectrometry has been used for many decades in the characterization of small organic molecules. The technique typically involves the ionization of molecules in the sample to form molecular ions by subjecting the sample to an electron beam at a very low pressure. The molecular ions are then focused and accelerated by an electric field into a magnetic field or quadrupole. The ions are separated in the magnetic field or quadrupole according to the ratio of the mass of the ion m to the charge on the ion z (m / z). After passing through the...

Claims


Application Information

Patent Timeline
IPC IPC(8): G01N33/68H01J49/02H01J49/42H03M7/00
CPCG01N33/6848H01J49/0027H01J49/26H01J49/02H01J49/0036H01J49/0009H01J49/165H01J49/40
Inventor HOFSTADLER, STEVEN A.DRADER, JARED J.SCHINK, AMY L.
Owner IBIS BIOSCI
Learn More