Analyzing traslational kinetics using graphical displays of translational kinetics values of codon pairs

a translational kinetic and codon pair technology, applied in the field of genetics, can solve the problems of inefficient translation, significant obstacles, synthetic genes, etc., and achieve the effect of facilitating analysis of translational kinetics

Inactive Publication Date: 2007-12-27
LATHROP RICHARD H +2
View PDF0 Cites 7 Cited by
  • Summary
  • Abstract
  • Description
  • Claims
  • Application Information

AI Technical Summary

Benefits of technology

[0012] In order to improve upon the shortcomings in the art, provided herein are graphical displays of translational kinetics values for codon pairs in a host organism plotted as a function of polypeptide or polypeptide-encoding nucleotide sequence. Such translational kinetics values can be based on: values of observed versus expected codon pair frequencies in a host organism; empirically measured translational pause properties; observed presence and / or recurrence of codon pairs at known or predicted transcriptional pause sites; or other methods known to those skilled in the art. The graphical displays provided herein reflect translational kinetics for each codon pair in a polypeptide-encoding nucleotide sequence to be expressed in an organism, thereby facilitating analysis of translational kinetics of an mRNA into polypeptide by comparing graphical displays of different codon pairs in sequences encoding the polypeptide. The graphical displays of translational kinetics values also display codon pair preferences on comparable numerical scales, thereby facilitating analysis of translational kinetics of an mRNA into polypeptide in different organisms by comparing comparably scaled graphical displays of the same or different codon pairs in sequences encoding the polypeptide.

Problems solved by technology

Despite the burgeoning knowledge of expression systems and recombinant DNA, significant obstacles remain when one attempts to express a foreign or synthetic gene in an organism.
Often, a synthetic gene, even when coupled with a strong promoter, is inefficiently translated and produces a faulty protein, such as an improperly folded or otherwise non-functional protein.
However, several features of protein coding regions have been discerned which are not readily understood in terms of these constraints: two important classes of such features are those involving codon usage and codon context.
The possibility that biases in codon usage can alter peptide elongation rates has been widely discussed, but while differences in codon use are thought to be associated with differences in translation rates, direct effects of codon choice on translation have been difficult to demonstrate.
This, in turn, has severely limited the utility of such nucleotide preference data for selecting codons to effect desired levels of translational efficiency.
These shortcomings result in graphical representations that are difficult to use, both in terms of using the graph to evaluate possible modification of a codon sequence, and in terms of comparing the graphs for expression in different organisms.
In particular, scaling differences from graph-to-graph increases the ambiguity of evaluating sequence modifications and / or expression in different organisms.
However, such estimates are only a first approximation, and do not represent true predictions of translational kinetics.
Heretofore, shortcomings in chi-squared based predictions of translational kinetics have not been appreciated, and, thus, methods for improving the translational kinetics predictive value of codon pairs have not been explored.
However, such values are not true predictors of translational kinetics, and methods are provided herein to improve the translational kinetics value for a codon pair.

Method used


Image

  • Analyzing traslational kinetics using graphical displays of translational kinetics values of codon pairs
  • Analyzing traslational kinetics using graphical displays of translational kinetics values of codon pairs
  • Analyzing traslational kinetics using graphical displays of translational kinetics values of codon pairs

Examples


example 1

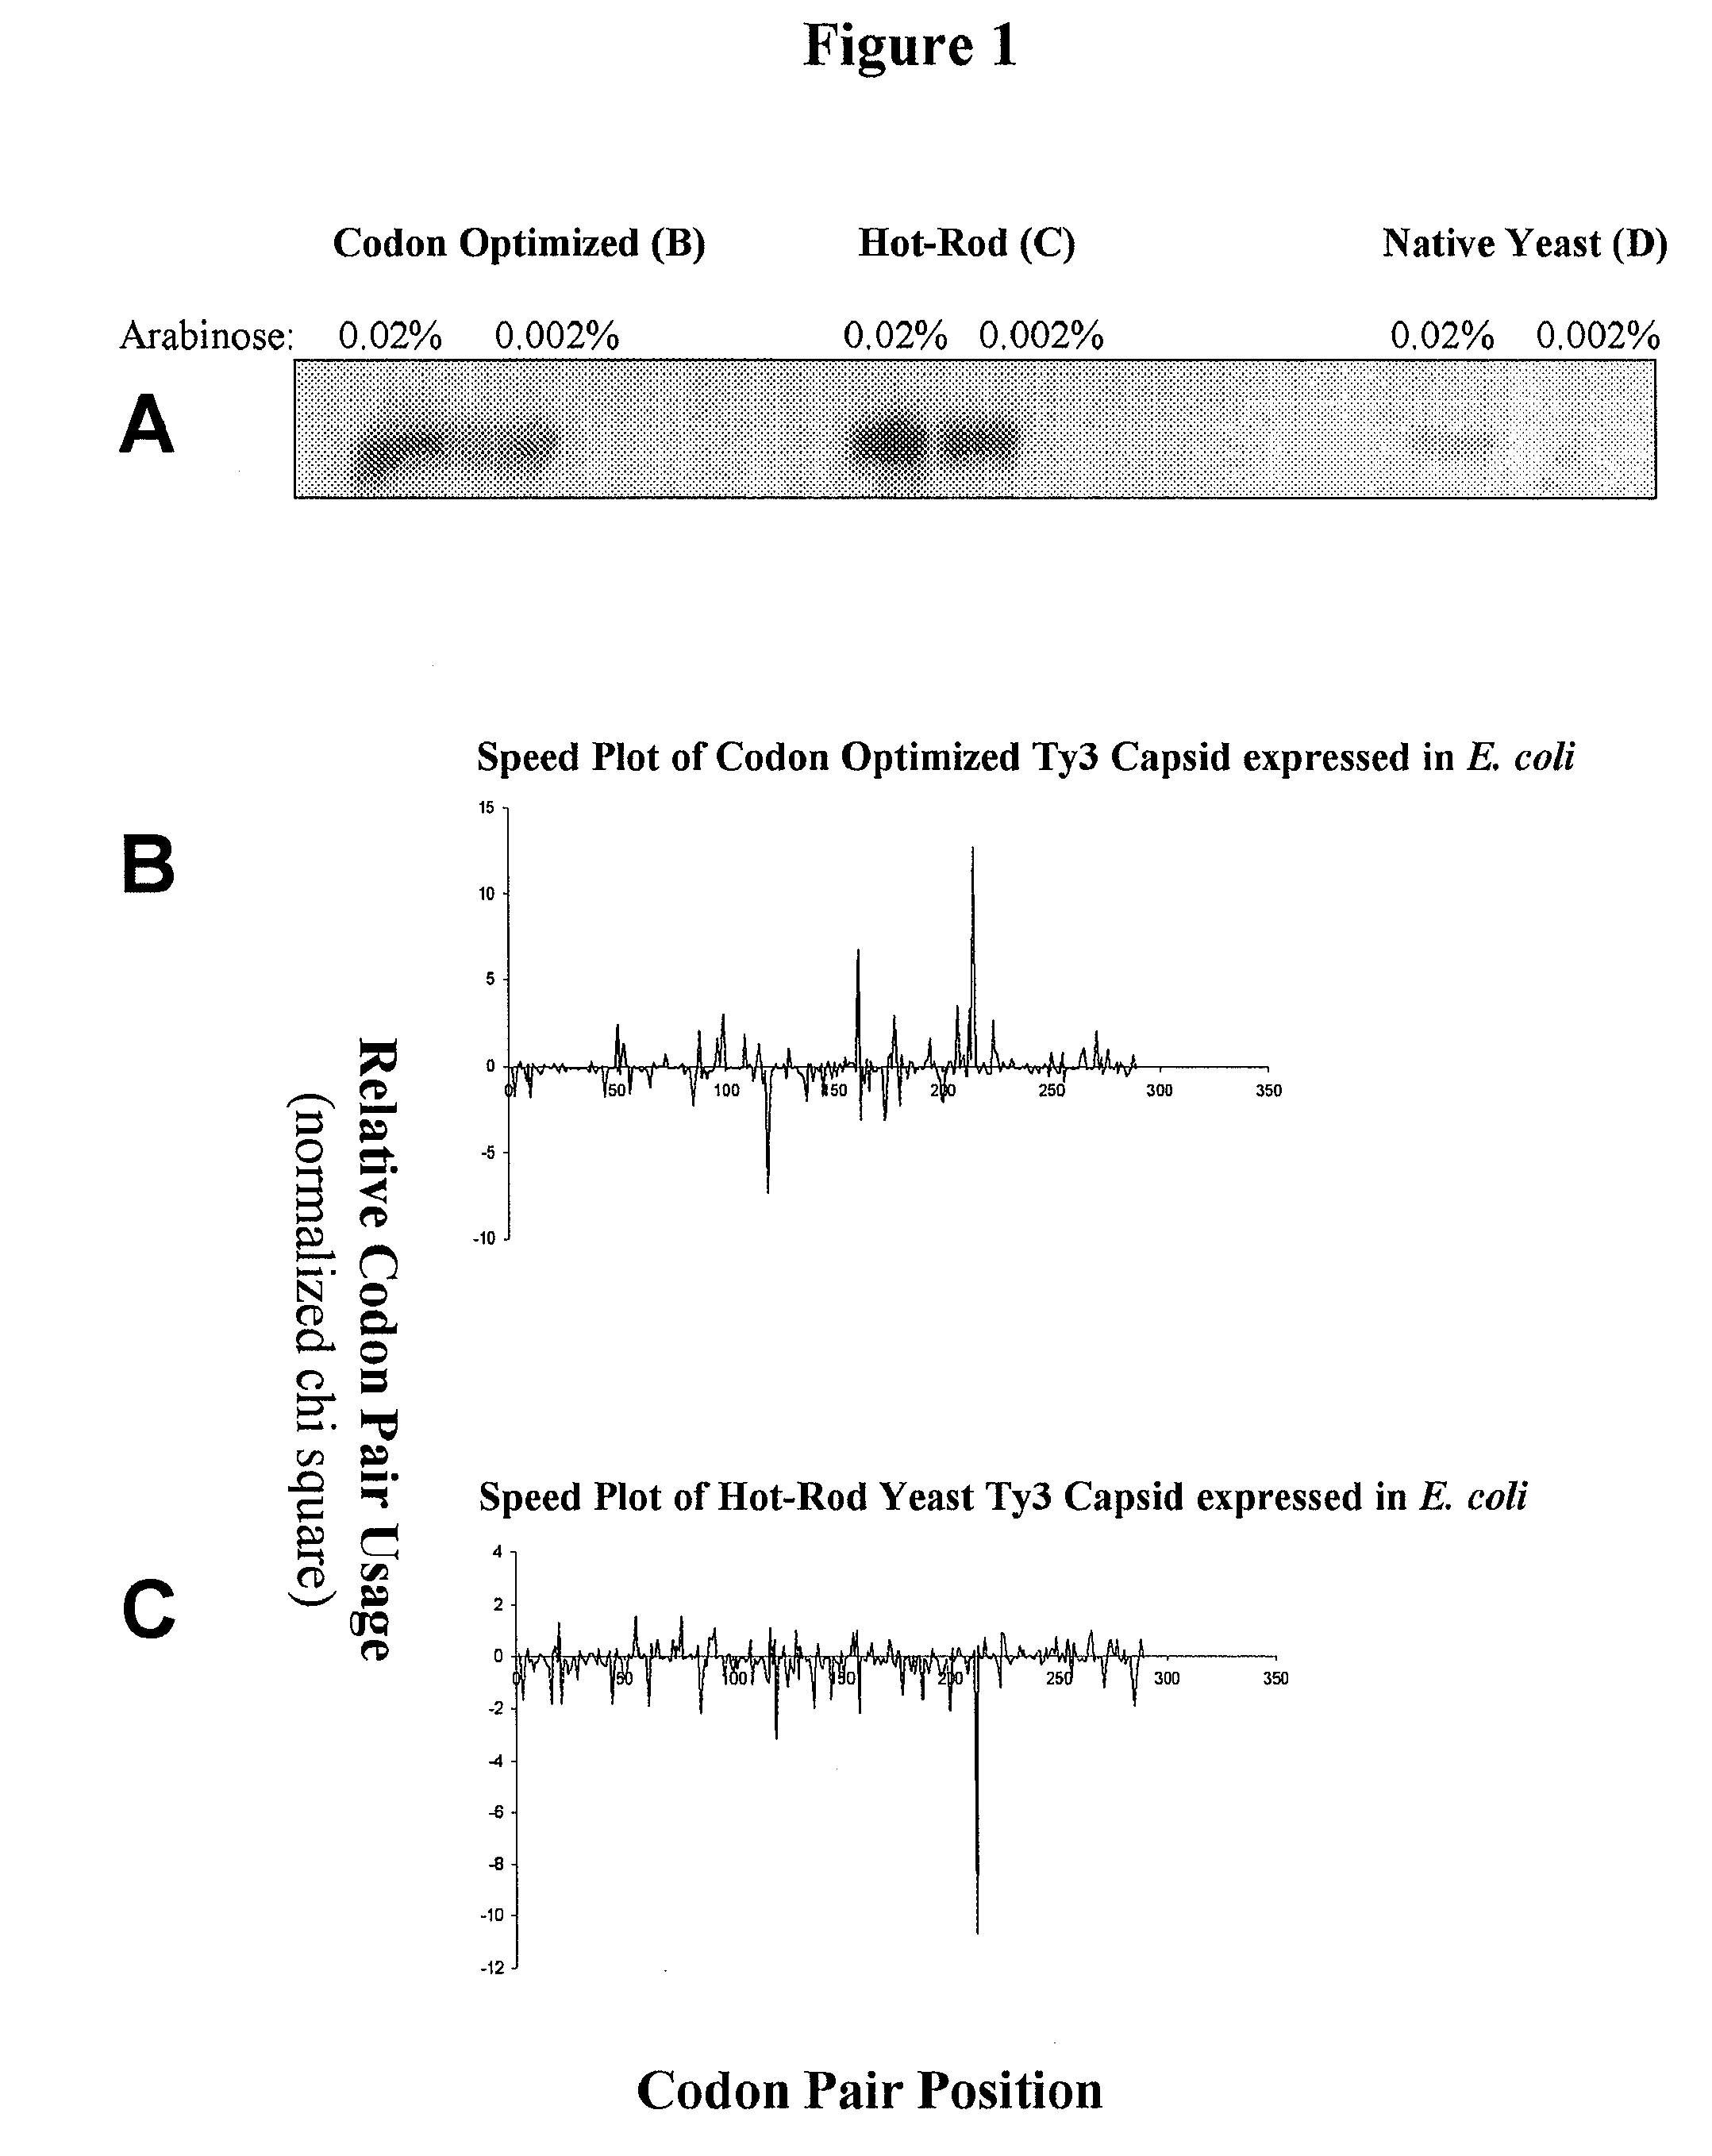
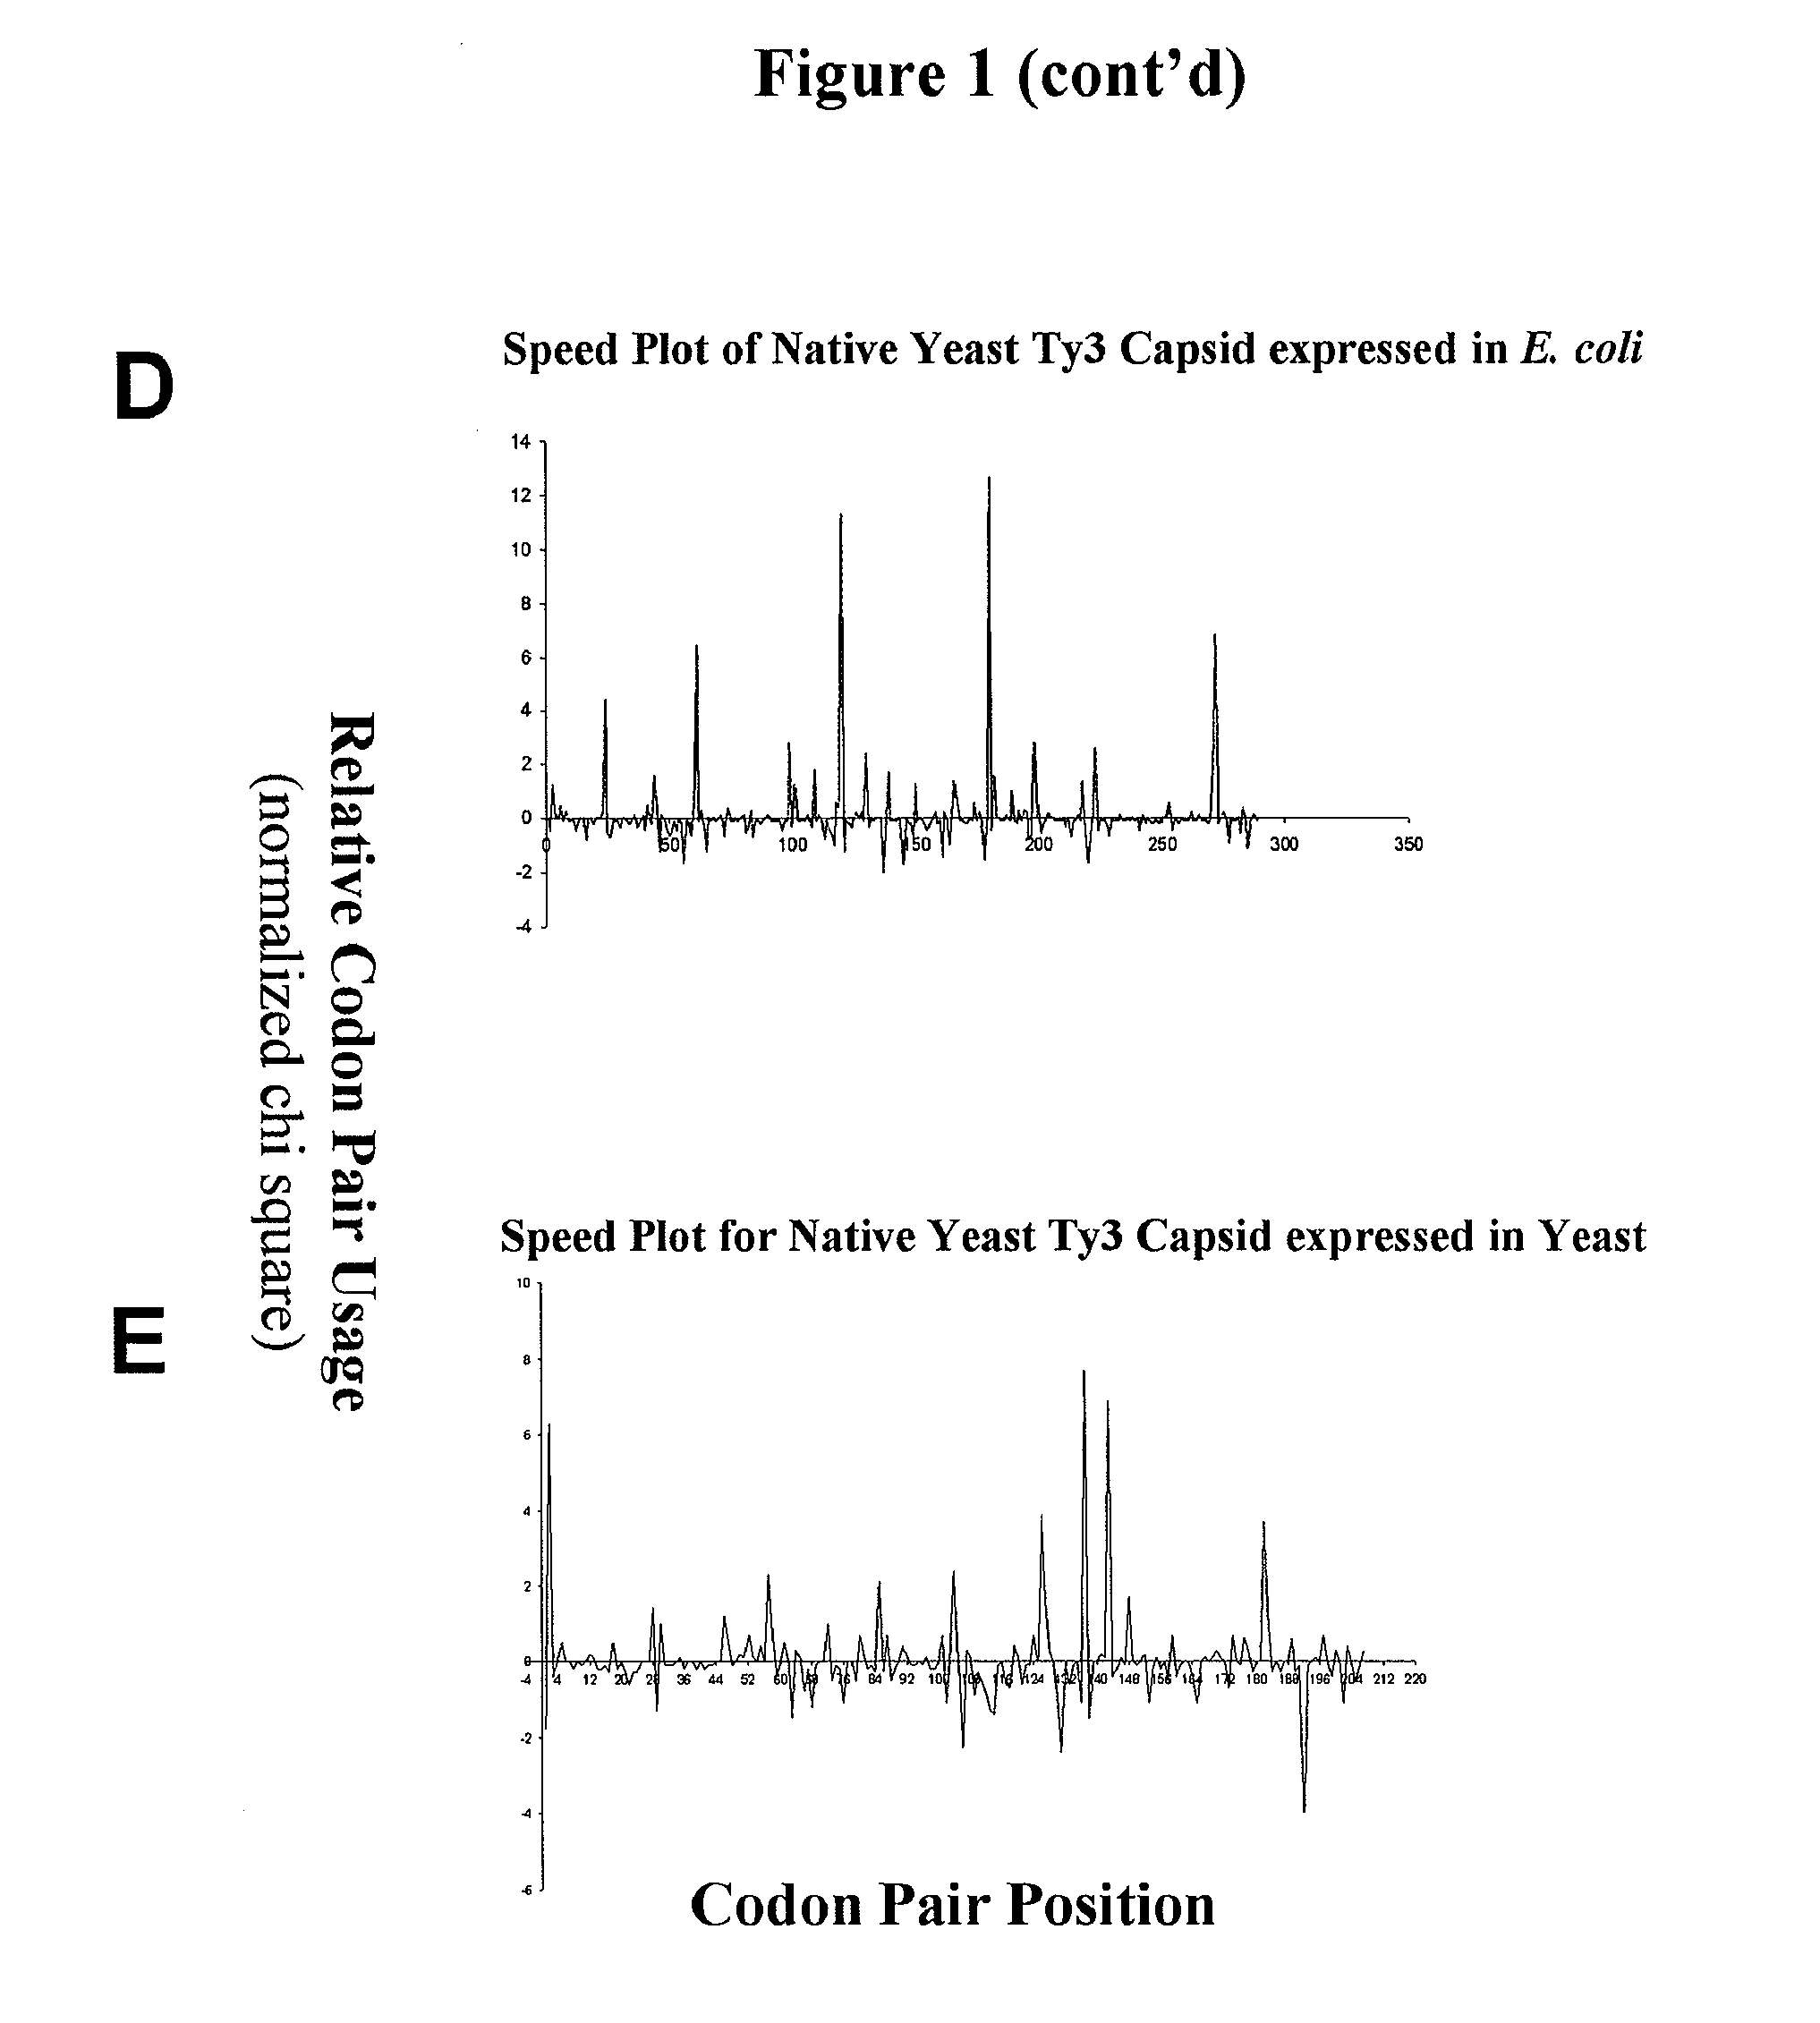
[0210] This example describes graphical displays of z scores for expression of a gene from a yeast retrotransposon in yeast and bacteria, and E. coli expression levels of different nucleotide sequences encoding the same protein. Ty3 is a retrotransposon of Saccharomyces cerevisiae, and is adapted to express its genes in S. cerevisiae using S. cerevisiae translational machinery. Thus, expression of Ty3 genes in S. cerevisiae represents native expression of these genes.

[0211] Chi-squared values for S. cerevisiae and E. coli were determined using previously reported methods (Hatfield and Gutman, “Codon Pair Utilization Bias in Bacteria, Yeast, and Mammals” in Transfer RNA in Protein Synthesis, Hatfield, Lee and Pirtle Eds. CRC Press (Boca Raton, La.) 1993). Briefly, nonredundant protein coding regions for each organism was obtained from GenBank sequence database (75,403 codon pairs in 177 sequences for S. cerevisiae, and 75,096 codon pairs in 237 sequences for E. coli) to determine an...

example 2

[0218] This example describes the use of graphical displays of codon pair usage versus codon pair position in conjunction with knowledge of the secondary and tertiary structure of a polypeptide in evaluating over-represented codon pairs and the importance of pause sites between protein structural elements.

[0219] Normalized chi-squared values of codon pair utililization were plotted versus codon pair position for nucleic acid sequences encoding the capsid protein of the human immunodeficiency virus, HIV-1, and the capsid protein of the S. cereviseae retrotransposon, Ty3. The three-dimensional structure of the HIV-1 capsid protein has been determined experimentally, and the structural elements of the Ty3 capsid protein have been predicted by conventional threading methods to be similar to those of the HIV-1 capsid protein. The ribbon structure depicting alpha helices of each protein is shown above the respective graphical display. The regions of the abscissa indicating the amino term...

example 3

[0223] This example describes creation of generic translational kinetics values.

[0224] Generic species datasets can be generated by following the hierarchy of the phylogenetic tree of life. Starting at the root of the tree, each mid-level node of the phylogenetic tree, which could be a family, genus, or higher level, represents a collection of all the species in the sub-tree under this node, until the tree reaches the lowest level nodes, which correspond to individual species.

[0225] For example, in order to create a generic set of translational kinetics values, such as generic mammal, genomic sequences from various mammalian species such as human (Homo sapiens), monkey (Macaca mulatta, Macaca fascicularis), chimpanzee (Pan troglodytes), sheep (Ovis aries), dog (Canis familiaris), and cow (Bos Taurus) can be pooled. In another example, a generic rodent dataset can include genomic sequences from rat (Rattus novegicus), mouse (Mus musculus), and Chinese hamster (Cricetulus griseus). ...


PUM

PropertyMeasurementUnit
threshold levelaaaaaaaaaa
thresholdaaaaaaaaaa

Abstract

Graphical displays are provided of translational kinetics values of codon pairs in a host organism plotted as a function of polypeptide-encoding nucleotide sequence. Such translational kinetics values of codon pair frequencies correspond to the predicted translational pausing properties of a codon pair in a host organism. The graphical displays provided reflect the relative over-representation or under-representation of each codon pair in an organism, thereby facilitating analysis of translational kinetics of an mRNA into polypeptide by comparing graphical displays of different codon pairs in sequences encoding the polypeptide. The graphical displays of translational kinetics values also can display codon pair properties on comparable numerical scales, thereby facilitating analysis of translational kinetics of an mRNA into polypeptide in different organisms by comparing comparably scaled graphical displays of the same or different codon pairs in sequences encoding the polypeptide. Also contemplated herein is the use of the graphical displays described herein for tracking the entire process of creating a refined polypeptide-encoding nucleotide sequence. In particular, additional translational kinetics graphical displays can be created to illustrate differences and / or similarities of translational kinetics of a polypeptide-encoding nucleotide sequence in which one or more codon pairs have been modified. Additionally, numerous translational kinetics graphical displays can be created to illustrate differences and / or similarities of translational kinetics of a polypeptide-encoding nucleotide sequence when expressed in two or more different organisms.

Description

RELATED APPLICATIONS [0001] This application is a continuation-in-part of U.S. non-provisional application Ser. No. 11 / 505,781, filed Aug. 16, 2006, and also claims priority to U.S. provisional application Ser. No. 60 / 746,466, filed May 4, 2006, and U.S. provisional application Ser. No. 60 / 841,588, filed Aug. 30, 2006. These applications are incorporated by reference herein in their entirety.FEDERALLY SPONSORED RESEARCH [0002] The work resulting in this invention was supported in part by National Science Foundation Grant No. IIS-0326037 and National Institutes of Health Grant No. STTR 1R41-AI-066758. The U.S. Government may therefore be entitled to certain rights in the invention.BACKGROUND [0003] 1. Field of the Invention [0004] The present invention generally relates to a new discovery in the field of genetics regarding codon pair usage in organisms, and using codon pair translational kinetics information in graphical displays for analyzing, altering, or constructing genes; for pu...

Claims


Application Information

Patent Timeline
Patent Type & Authority Applications(United States)
IPC IPC(8): G01N33/48G06T11/00G16B20/20G16B20/50G16B30/10
CPCC12N15/1089G06F19/26G06F19/22G06F19/18G16B20/00G16B30/00G16B45/00G16B30/10G16B20/50G16B20/20
Inventor LATHROP, RICHARD H.KITTLE, JOSEPH D. JR.HATFIELD, G. WESLEY
Owner LATHROP RICHARD H
Why Eureka
Try Eureka