Optical analysis system and method for real time multivariate optical computing
Active Publication Date: 2009-04-16
HALLIBURTON ENERGY SERVICES INC
View PDF14 Cites 76 Cited by
Summary
Abstract
Description
Claims
Application Information
AI Technical Summary
This helps you quickly interpret patents by identifying the three key elements:
Problems solved by technology
Method used
Benefits of technology
[0027]Since multivariate optical element (MOE)-based MOC uses detectors that see all wavelengths emanating from an illumination source simultaneously—including wavelengths that carry no information—measurement noise is reduced and measurement precision is increased in the system of the present subject matter by making the system sensitive primarily to wavelengths carrying information. Additionally, the present subject matter controls a spectral range of the illumination source by using bandpass filters or spectral elements having predetermined transmission characteristics. Further, in some aspects of the present subject matter, the system shines a light signal directly onto a sample and eliminates the use of, for instance, of a fiber optic probe; therefore, the component parts of the exemplary embodiments of the present disclosure are simple and economical to manufacture, assemble and use, with improved signal when the attenuation typical of a fiber optic probe is removed. These and other aspects and advantages of the present disclosure will be apparent from the following description and the attached drawings, or can be learned through practice of the present subject matter.
[0028]According to one embodiment of the disclosure, an optical analysis system generally includes an illumination source for shining light or other radiative energy through a set of lenses. Light levels are maximized through the optical system to enhance transmission (reduce loss) of the light. The illumination source subsequently shines the light through a multi-window (e.g.,10-window) chopper wheel. The chopper wheel rotates, for instance, at 40 Hertz (Hz), which pr
Problems solved by technology
In general, a simple measurement of light intensity is difficult to convert to information because it likely contains interfering data.
It is often impossible to adequately measure the data relating to one of these factors since the contribution of the other factors is unknown.
Depending on the circumstances, however, the estimate may be unacceptably inaccurate since factors other than eth
Method used
Image
Click on the blue label to locate the original text in one second.
Reading with bidirectional positioning of images and text.
Examples
example i
System I
[0087]A first breadboard system was constructed and used to test a mixture of powders.
System I Components:
[0088]Illumination: 20 W Gilway lamp
Spectral elements: 5 mm deuterium oxide (D2O), 5 mm Germanium
Optical window: fiber optic probe
Detector: InAr detector from Judson
MOE: specific to test
Procedure and Results of Static Testing Using System 1:
[0089]A powdered sample with a known composition was placed in a dish and the fiber optic probe was placed in contact with the powder. The output of the detectors was monitored and recorded.
example ii
System II
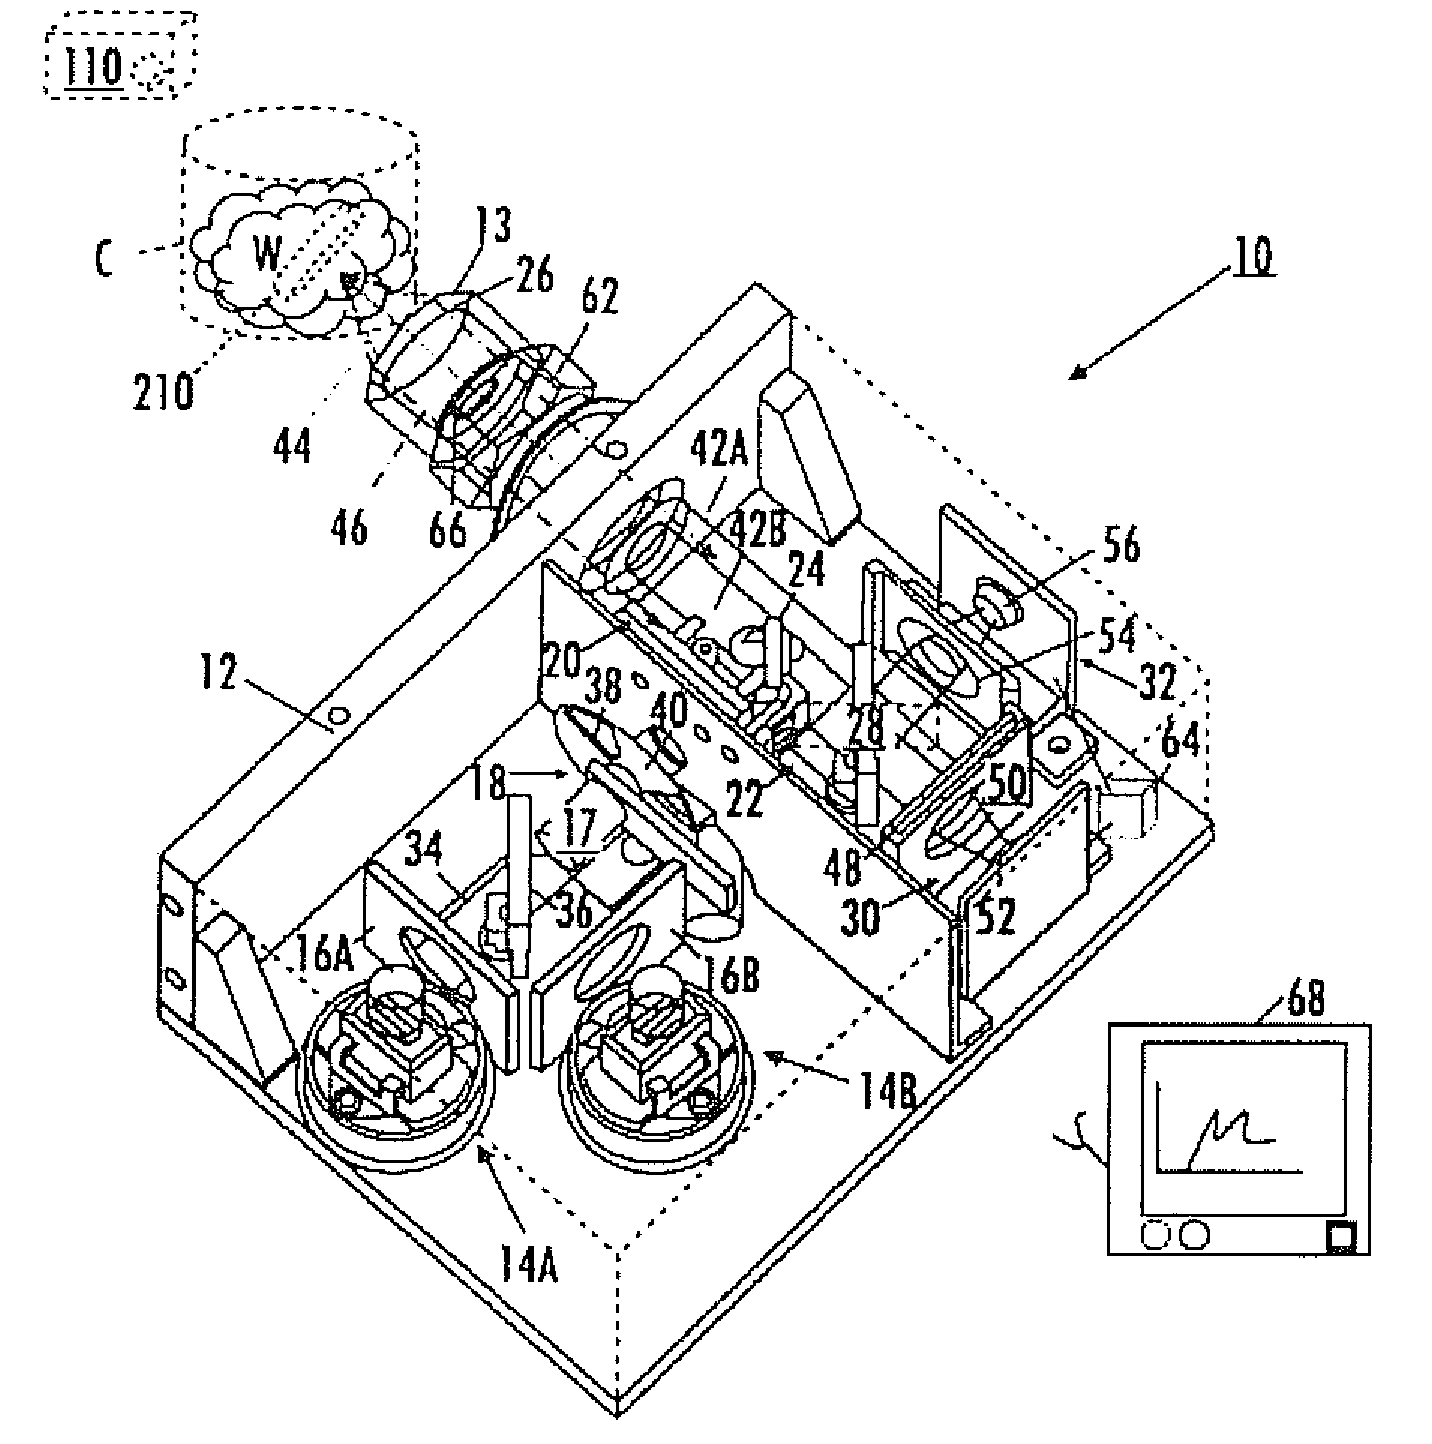
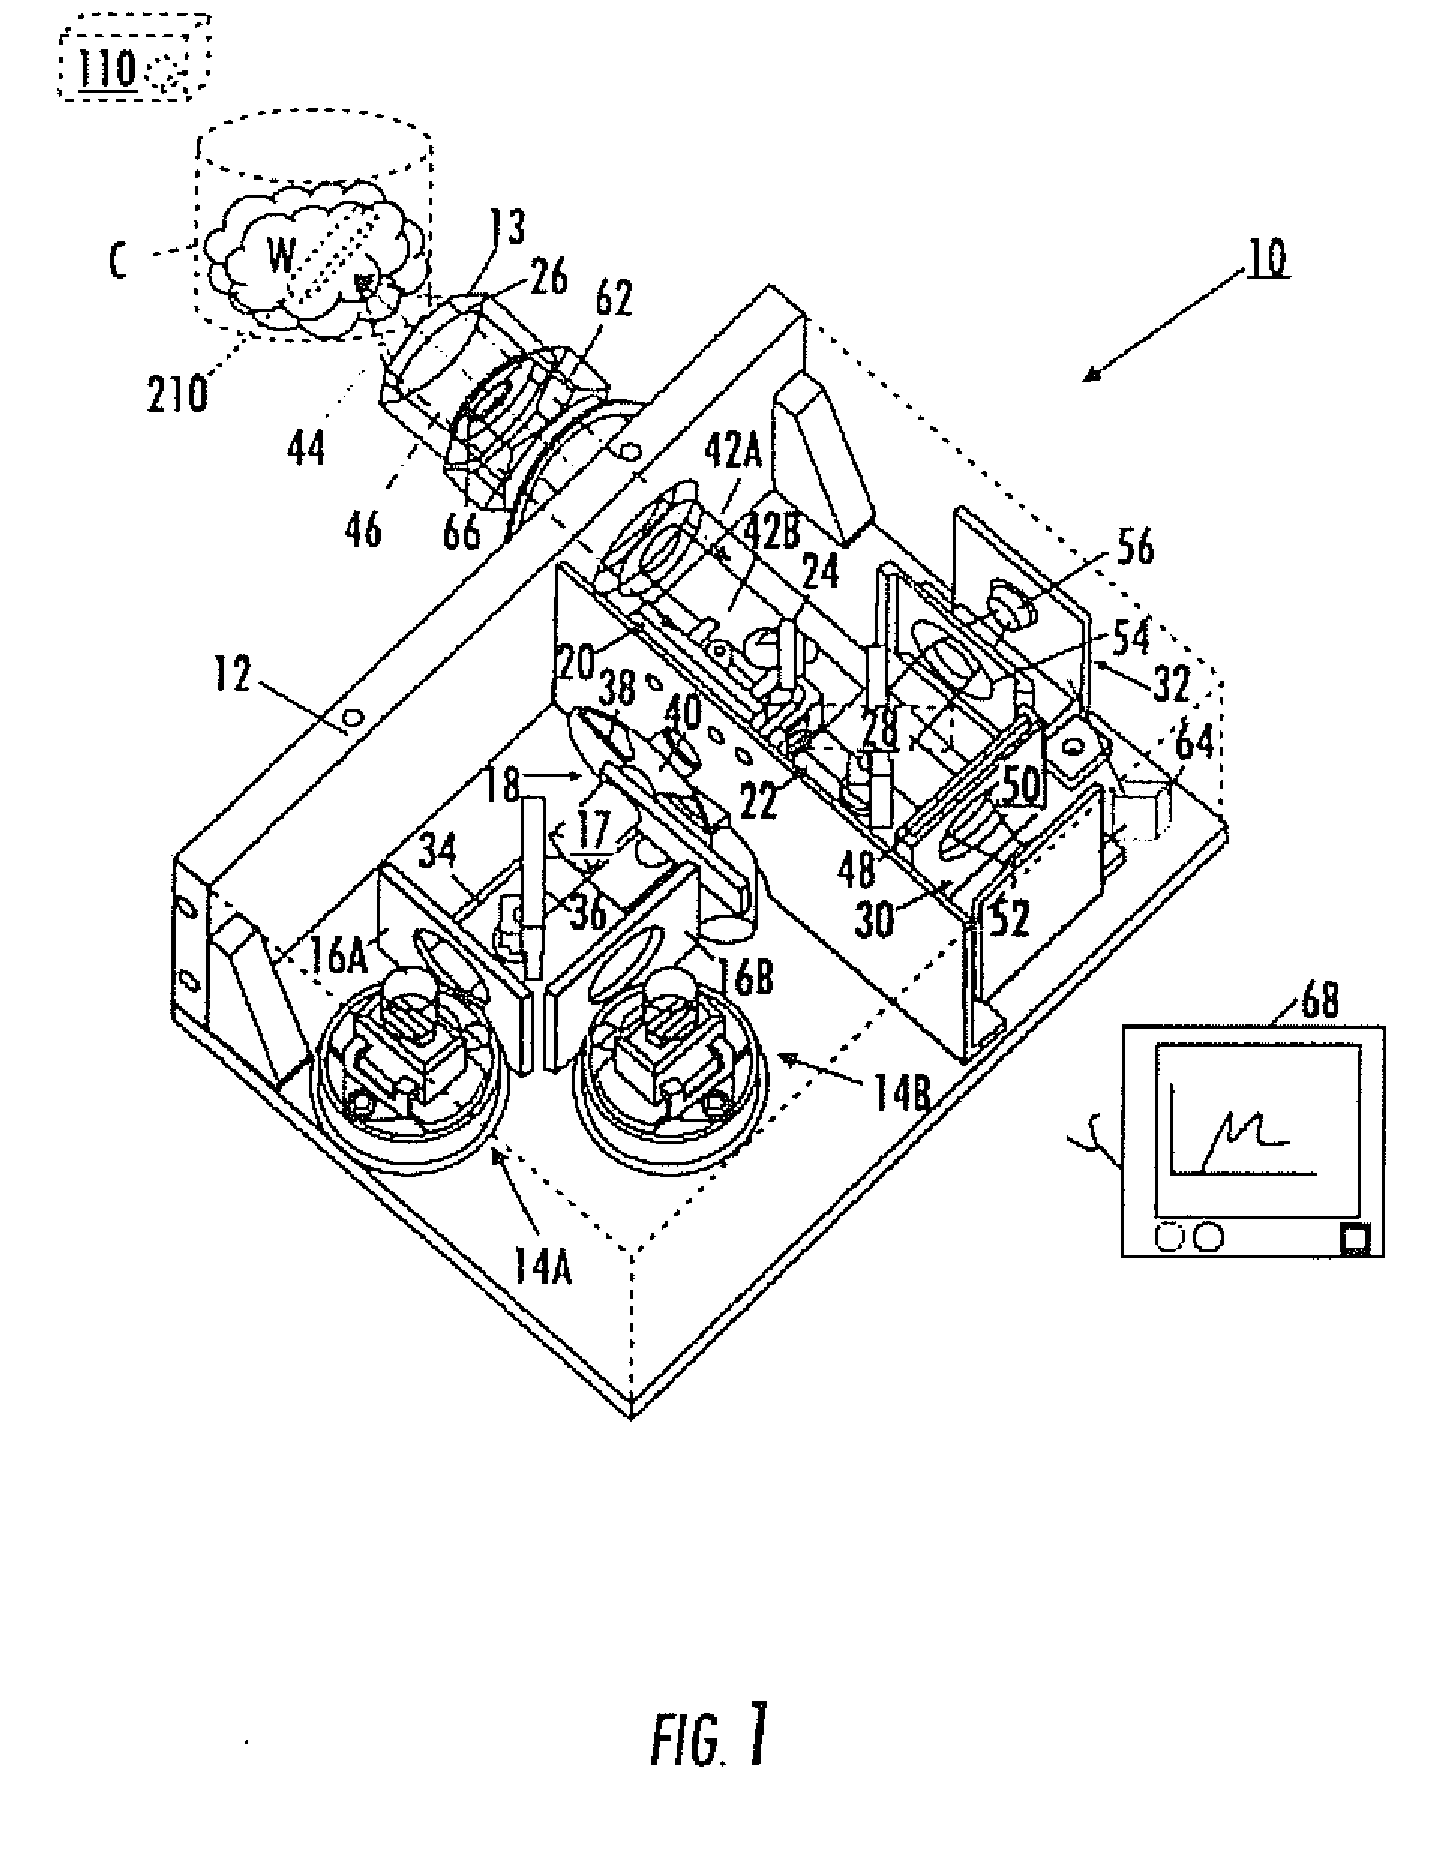
[0090]A system similar to the optical analysis system 10 shown in the figures was constructed and used to make static measurements on aspirin / lactose.
System II Components:
[0091]Illumination: 20 W Gilway lamp
Spectral elements: 5 mm D2O, 5 mm Germanium
Optical window: none
Detector: PbS detector from New England Photoconductor
MOE: specific to test conditions.
Procedure and Results of Static Testing Using System II:
[0092]A powdered sample with a known composition was placed in a dish and the system light beam was focused on the powder. The output of the detectors was monitored and recorded. Aspirin / lactose samples covering the range of 100% aspirin to 100% lactose were tested.
example iii
System III
[0093]A system similar to the optical analysis system 10 shown in the figures was constructed and used to make dynamic measurements on aspirin / lactose.
System III Components:
[0094]Illumination: 20 W Gilway lamp
Spectral elements: 5 mm D2O, 5 mm Germanium
Optical window: sapphire window
Detector: PbS detector from New England Photoconductor
MOE: specific to test conditions.
Procedure and Results of Dynamic Testing Using System III:
[0095]The Aspirin / Lactose testing was made on a mixer bowl containing lactose and the system measured as aspirin was added to the system and mixed. Specifically, lactose powder was placed in the bowl of a mixer and the measurement system was attached the bowl using a Swagelok® brand fitting. A sapphire window was used to contain the powder in the bowl and allow the system to interrogate the powder. With the mixer turning, known amounts of aspirin were added and the system output signal was monitored and recorded. Aspirin was added in several allotments ...
PUM
Abstract
An optical analysis system and method for determining information carried by light include a multivariate optical element disposed in the system to receive a source light from an illumination source; filtering the source light through a spectral element in the optical element analysis system; reflecting the filtered light through an inner region of a cavity in a first direction of a sample to be measured, the cavity defining a second region disposed about the inner region; focusing the reflected light proximate the sample; reflecting the focused light from the sample through the second region in a second direction of a beamsplitter, the light being reflected from the sample carrying data from the sample; splitting the sample carrying light with the beamsplitter into a first light and a second light; optically filtering the data of the first light with the multivariate optical element into an orthogonal component; directing the first light filtered by the multivariate optical element onto a first photodetector; directing the second light onto a second photodetector; and comparing the orthogonal component to information present in the second light to determine a property of the sample.
Description
CROSS-REFERENCE TO RELATED APPLICATIONS[0001]This application claims priority to PCT Patent Application Serial Number PCT / US2006 / 045357, filed Nov. 27, 2006, which claims benefit of U.S. Provisional Patent Application Ser. No. 60 / 740,078, filed Nov. 28, 2005, all of which are incorporated herein by reference in their entireties.BACKGROUND OF THE DISCLOSURE[0002]Light conveys information through data. When light interacts with matter, for example, it carries away information about the physical and chemical properties of the matter. A property of the light, for example, its intensity, may be measured and interpreted to provide information about the matter with which it interacted. That is, the data carried by the light through its intensity may be measured to derive information about the matter. Similarly, in optical communications systems, light data is manipulated to convey information over an optical transmission medium, for example fiber optic cable. The data is measured when the ...
Claims
Application Information
Patent Timeline
Application Date:The date an application was filed.
Publication Date:The date a patent or application was officially published.
First Publication Date:The earliest publication date of a patent with the same application number.
Issue Date:Publication date of the patent grant document.
PCT Entry Date:The Entry date of PCT National Phase.
Estimated Expiry Date:The statutory expiry date of a patent right according to the Patent Law, and it is the longest term of protection that the patent right can achieve without the termination of the patent right due to other reasons(Term extension factor has been taken into account ).
Invalid Date:Actual expiry date is based on effective date or publication date of legal transaction data of invalid patent.