Performance recovery of a fuel cell
- Summary
- Abstract
- Description
- Claims
- Application Information
AI Technical Summary
Benefits of technology
Problems solved by technology
Method used
Image
Examples
example 1
[0049]PEMFC Materials and Setup—All SO2 contamination and recovery experiments were performed with commercially available 50-cm2 Ion Power membrane electrode assemblies (MEAs), which were replaced after each contamination experiment. The anode and cathode catalysts were both 50 wt. % Pt supported on Vulcan carbon (VC), with a Pt loading of 0.4 mgPt / cm2 (geometric). Membrane and electrode thicknesses were determined from MEA cross sections via scanning electron microscope (SEM) imaging. The NAFION® membrane (NRE 211) was 25-26 μm thick, and both electrodes were 13-14 μm. Cell assembly details are reported elsewhere (Bender et al., Journal of Power Sources, 193, 713 (2009)). The gas diffusion layers were SGL 25BC. FCATS™ G050 series test stations from Green Light Power Technologies, Inc. were used to conduct the PEMFC experiments. All gases used were of UHP purity (99.999%), except during exposure to SO2, in which 93-ppm SO2 in air was diluted to 1-ppm SO2 in air using the equipment a...
example 2
[0051]Testing Procedure—Experiments consisted of five phases: (i) beginning of life (BOL) conditioning and diagnostics to verify the full functionality of the MEA before being placed on test set-up, (ii) beginning of test (BOT) diagnostics to determine baseline behavior at experimental conditions; (iii) a constant voltage hold experiment that includes the contaminant exposure, (iv) the recovery method, and (v) end of test (EOT) diagnostics to evaluate the effectiveness of the recovery method. The details of the BOL diagnostics and conditioning procedures used are described elsewhere (Bender). BOT diagnostics consisted of the determination of the cathode's electrochemically active area (ECSA) via CV and the initial cell performance via a polarization curve.
[0052]The ECSA method was as follows: CV anode|cathode operating conditions were 48.3|48.3 kPag outlet back pressure, 100|50% relative humidity (RH), 466|466 sccm H2|N2 flows, and 60° C. cell temperature. Five scans were conducted ...
example 3
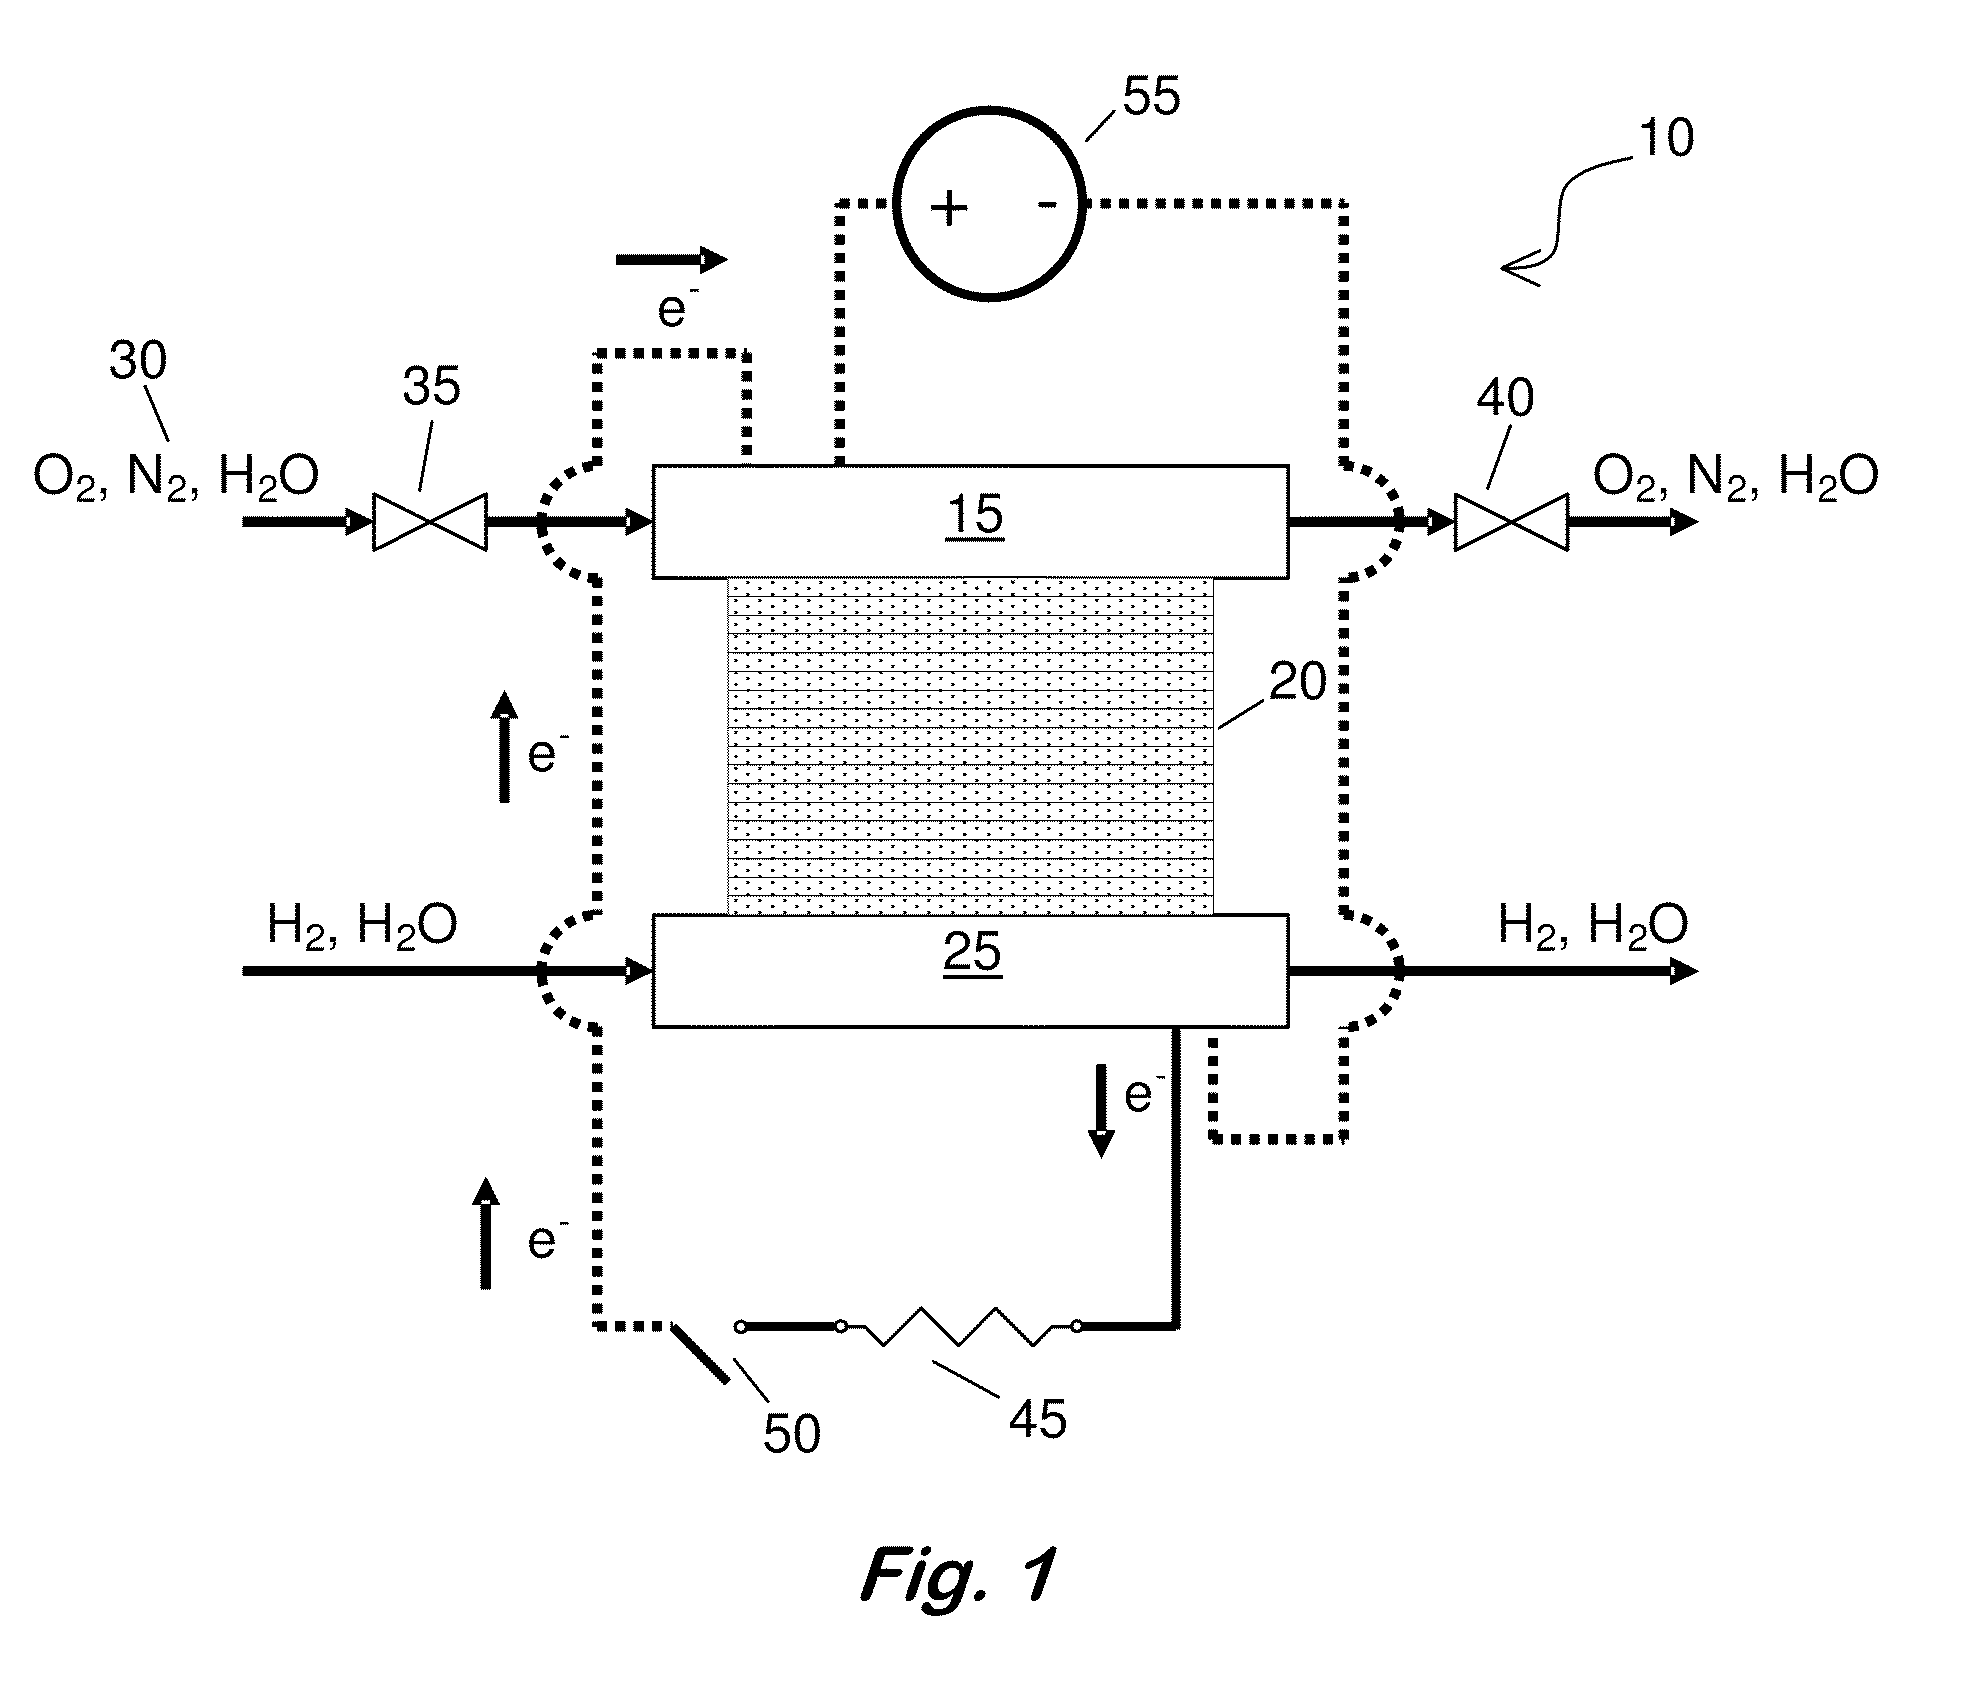
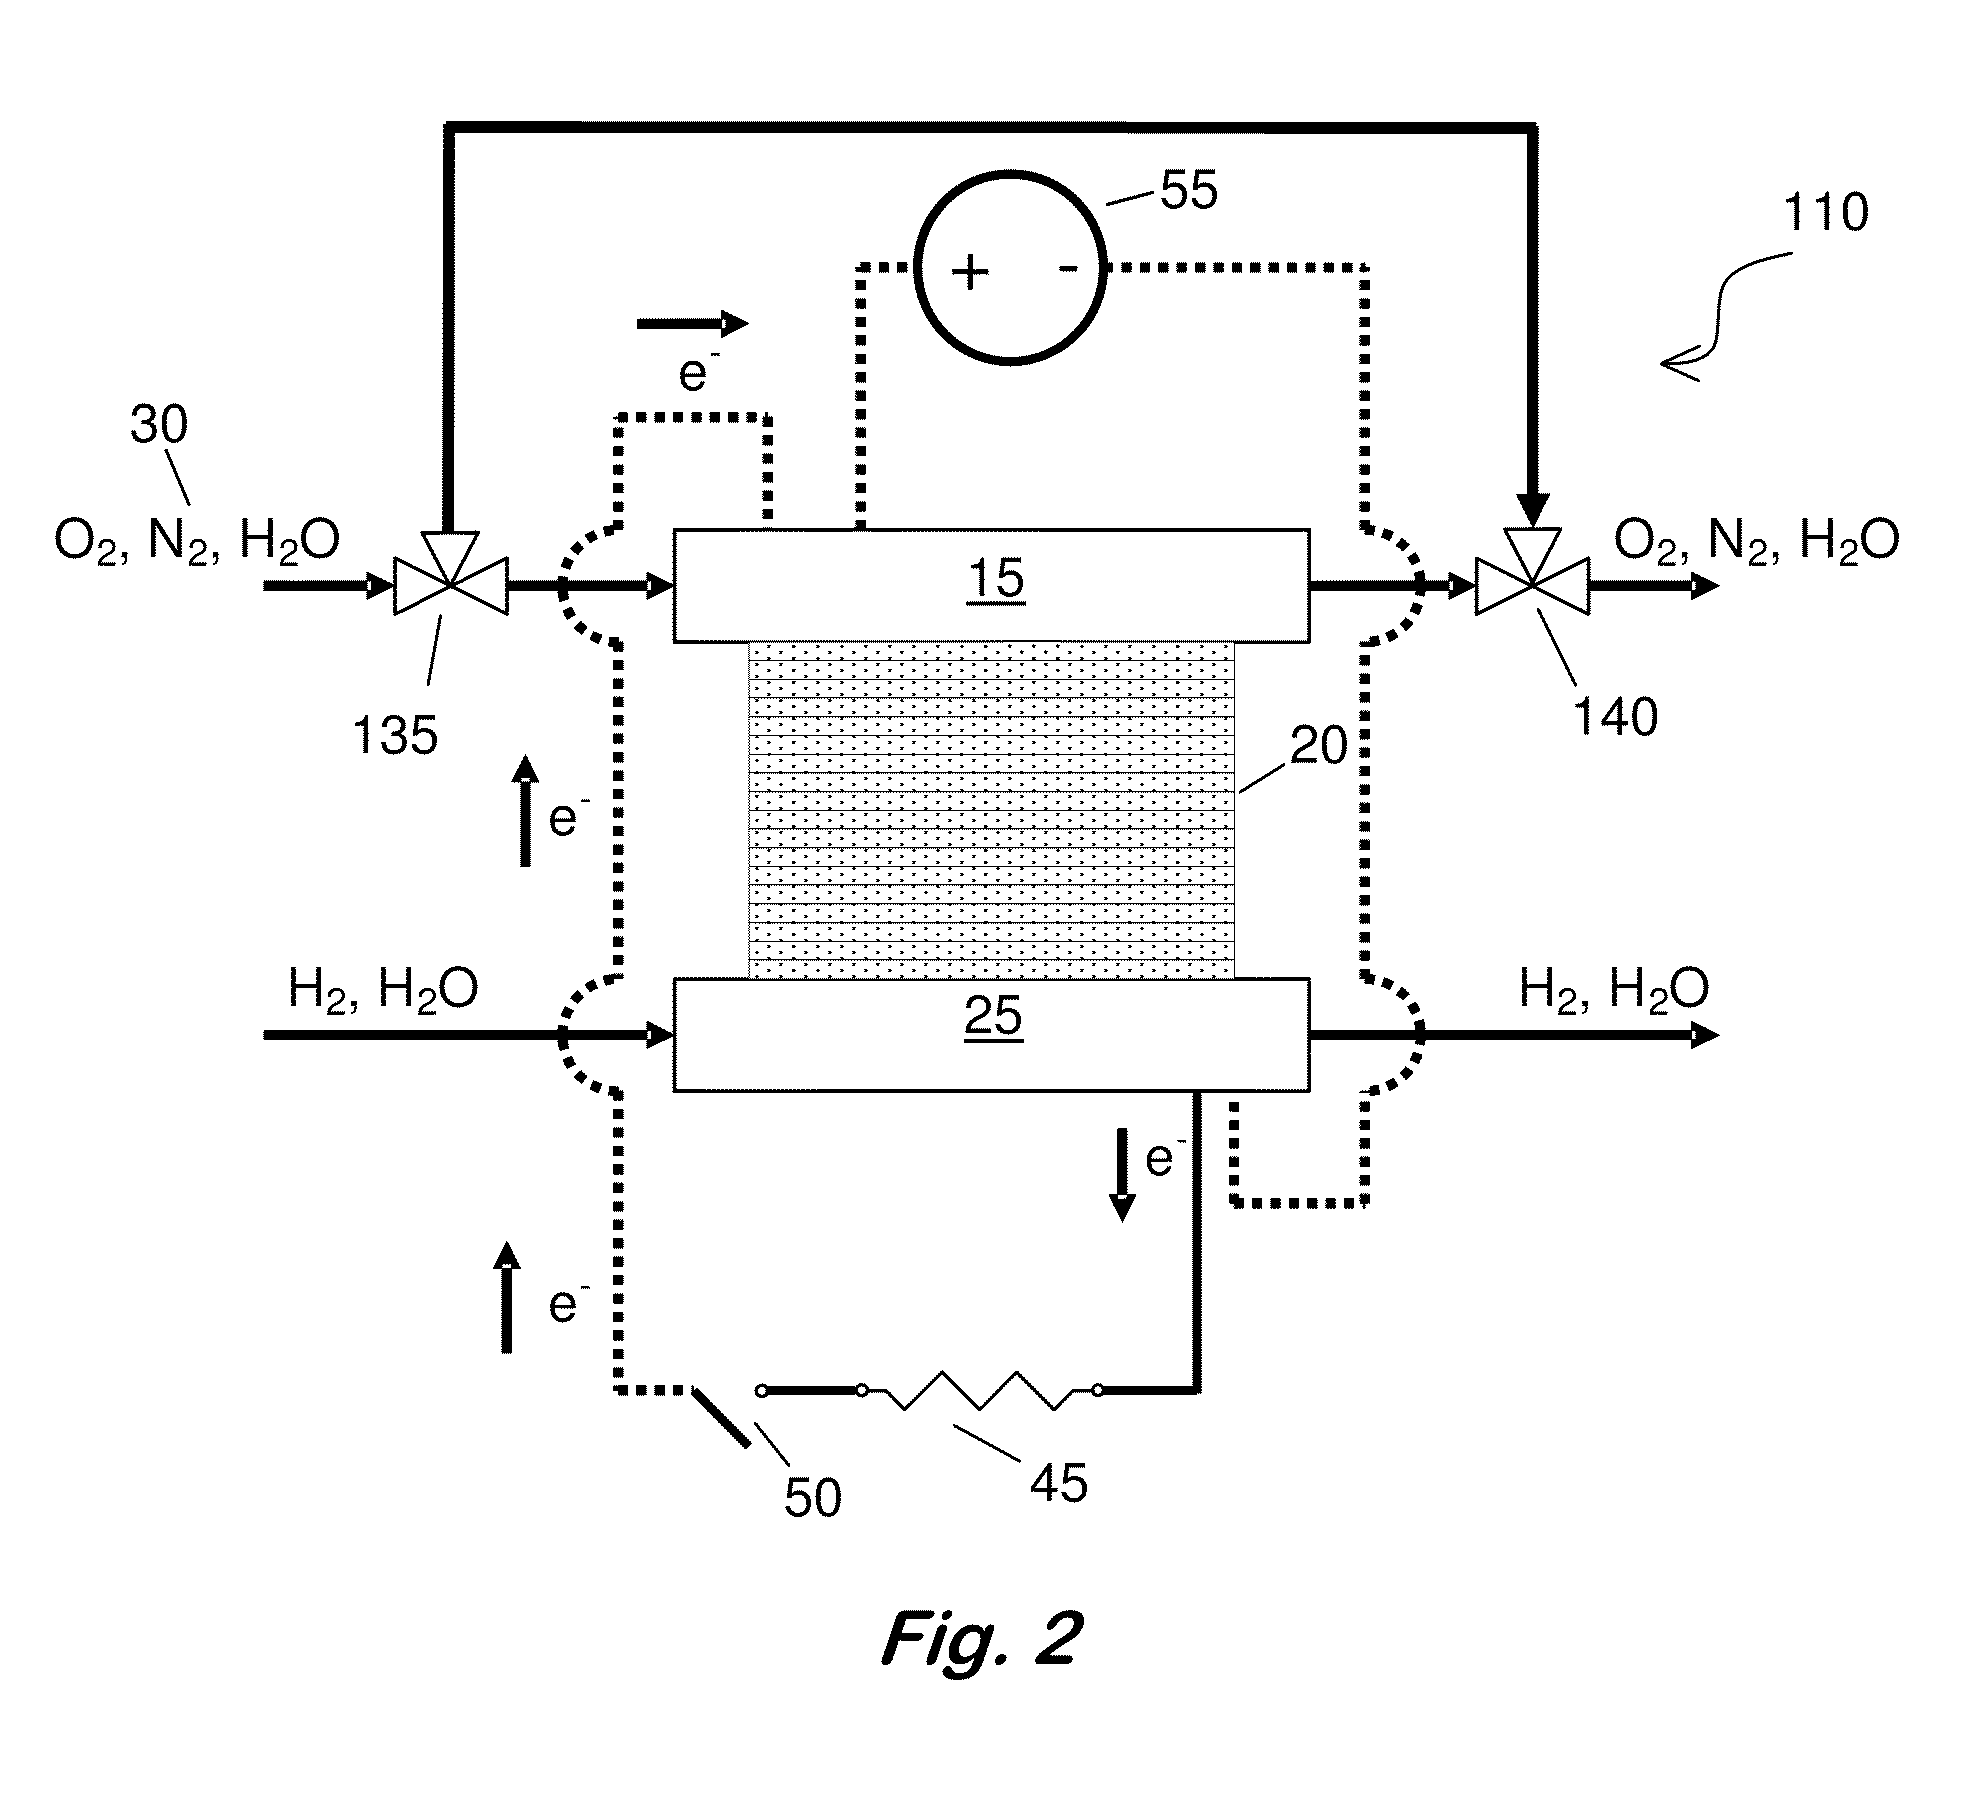
[0055]Driven Cell Recovery by Potential Cycling with in situ N2—The entire automated recovery is described in Table I. Steps 1-5 prepared the cell for a driven cell experiment while preventing the cell voltage from being inverted. In situ N2 was generated (i.e., N2 concentration was increased) in step 3 when the air flow was bypassed from the cathode, and the O2 in the air in the cathode compartment was electrochemically consumed to leave predominantly N2. After the air flow was cut off, the current dropped from an initial value near 800 mA / cm2 to below 5 mA / cm2, indicating that current was only resulting from H2 crossover and not from oxygen reduction. In step 5, the cell voltage dropped to 0.09 V as further evidence that only humidified N2 and some crossover H2 was present at the cathode electrode. Steps 6, 7, and 9 enable driven cell experiments with potential cycling. The potential range was varied from 0.09 V vs. the potential at the anode to an optimum upper vertex potential r...
PUM
 Abstract
Description
Claims
Application Information
 - R&D
- Intellectual Property
- Life Sciences
- Materials
- Tech Scout
- Unparalleled Data Quality
- Higher Quality Content
- 60% Fewer Hallucinations
Browse by: Latest US Patents, China's latest patents, Technical Efficacy Thesaurus, Application Domain, Technology Topic, Popular Technical Reports.
© 2025 PatSnap. All rights reserved.Legal|Privacy policy|Modern Slavery Act Transparency Statement|Sitemap|About US| Contact US: help@patsnap.com


