Quantitative analysis method using mass spectrometer

a mass spectrometer and quantitative analysis technology, applied in the field of mass spectrometry system, can solve the problems of reducing the precision of quantitative analysis, difficult application to unknown components as markers in marker searches, and limited sample types, so as to eliminate wasteful analysis time, improve the accuracy of quantitative analysis, and improve the effect of quantitative data accuracy

Inactive Publication Date: 2011-05-05
HITACHI HIGH-TECH CORP
View PDF1 Cites 20 Cited by
  • Summary
  • Abstract
  • Description
  • Claims
  • Application Information

AI Technical Summary

Benefits of technology

[0037]An internal standard is mixed in a mobile phase or an eluate of LC, and the blank sample is first analyzed under the condition where no analysis-inhibitory factors occur. Next, a sample for the analysis is analyzed, but at this time, by measuring the intensity of ions originated from the internal standard in the analysis real time, and comparing with an analysis result of the blank sample in the analysis real time, whether or not the analysis-inhibitory factors have occurred when the sample for the analysis has been mixed can be detected with high precision. Further, based on the inconsistency above, the error in quantitative data can be evaluated.
[0038]Data in a time region indicating a consistency by comparison of mass chromatograms of ions originated from internal standards of the blank sample and the mixed sample for the analysis are judged not to be influenced by analysis-inhibitory factors, and data for the analysis of the sample for the analysis in the time region where the ion intensities are consistent with each other are acquired as effective data for the analysis, thereby enabling elimination of wasteful analysis time, and improve the analysis efficiency.
[0039]By introducing two types of internal standards, and acquiring and comparing mass chromatograms b

Problems solved by technology

If an ion of a substance is given attention to, and subjected to a qualitative analysis by the tandem mass spectrometry, data by the mass spectrometry without using the tandem cannot be acquired during that time, resulting in exhibiting a relation of substantially decreasing the precision of the quantitative analysis.
Since this method has a precondition that a standard molecule is procured in advance to fabricate a calibration curve, the application to unknown components as objects of marker searches is difficult.
However, this means not only has a limitation on the types of samples applicable, but also requires much time and costs.
Even in the case of performing a comparative quantitative analysis as described in Patent Document 1, if quantitative analysis-inhibitory factors such as the matrix effect and the ion suppression occur, analysis results of data for the analysis may lose the reliability.
However, too high an electric conductivity κ decreases the ion generation efficiency.
In other words, since the electric con

Method used


Image

  • Quantitative analysis method using mass spectrometer
  • Quantitative analysis method using mass spectrometer
  • Quantitative analysis method using mass spectrometer

Examples


example 1

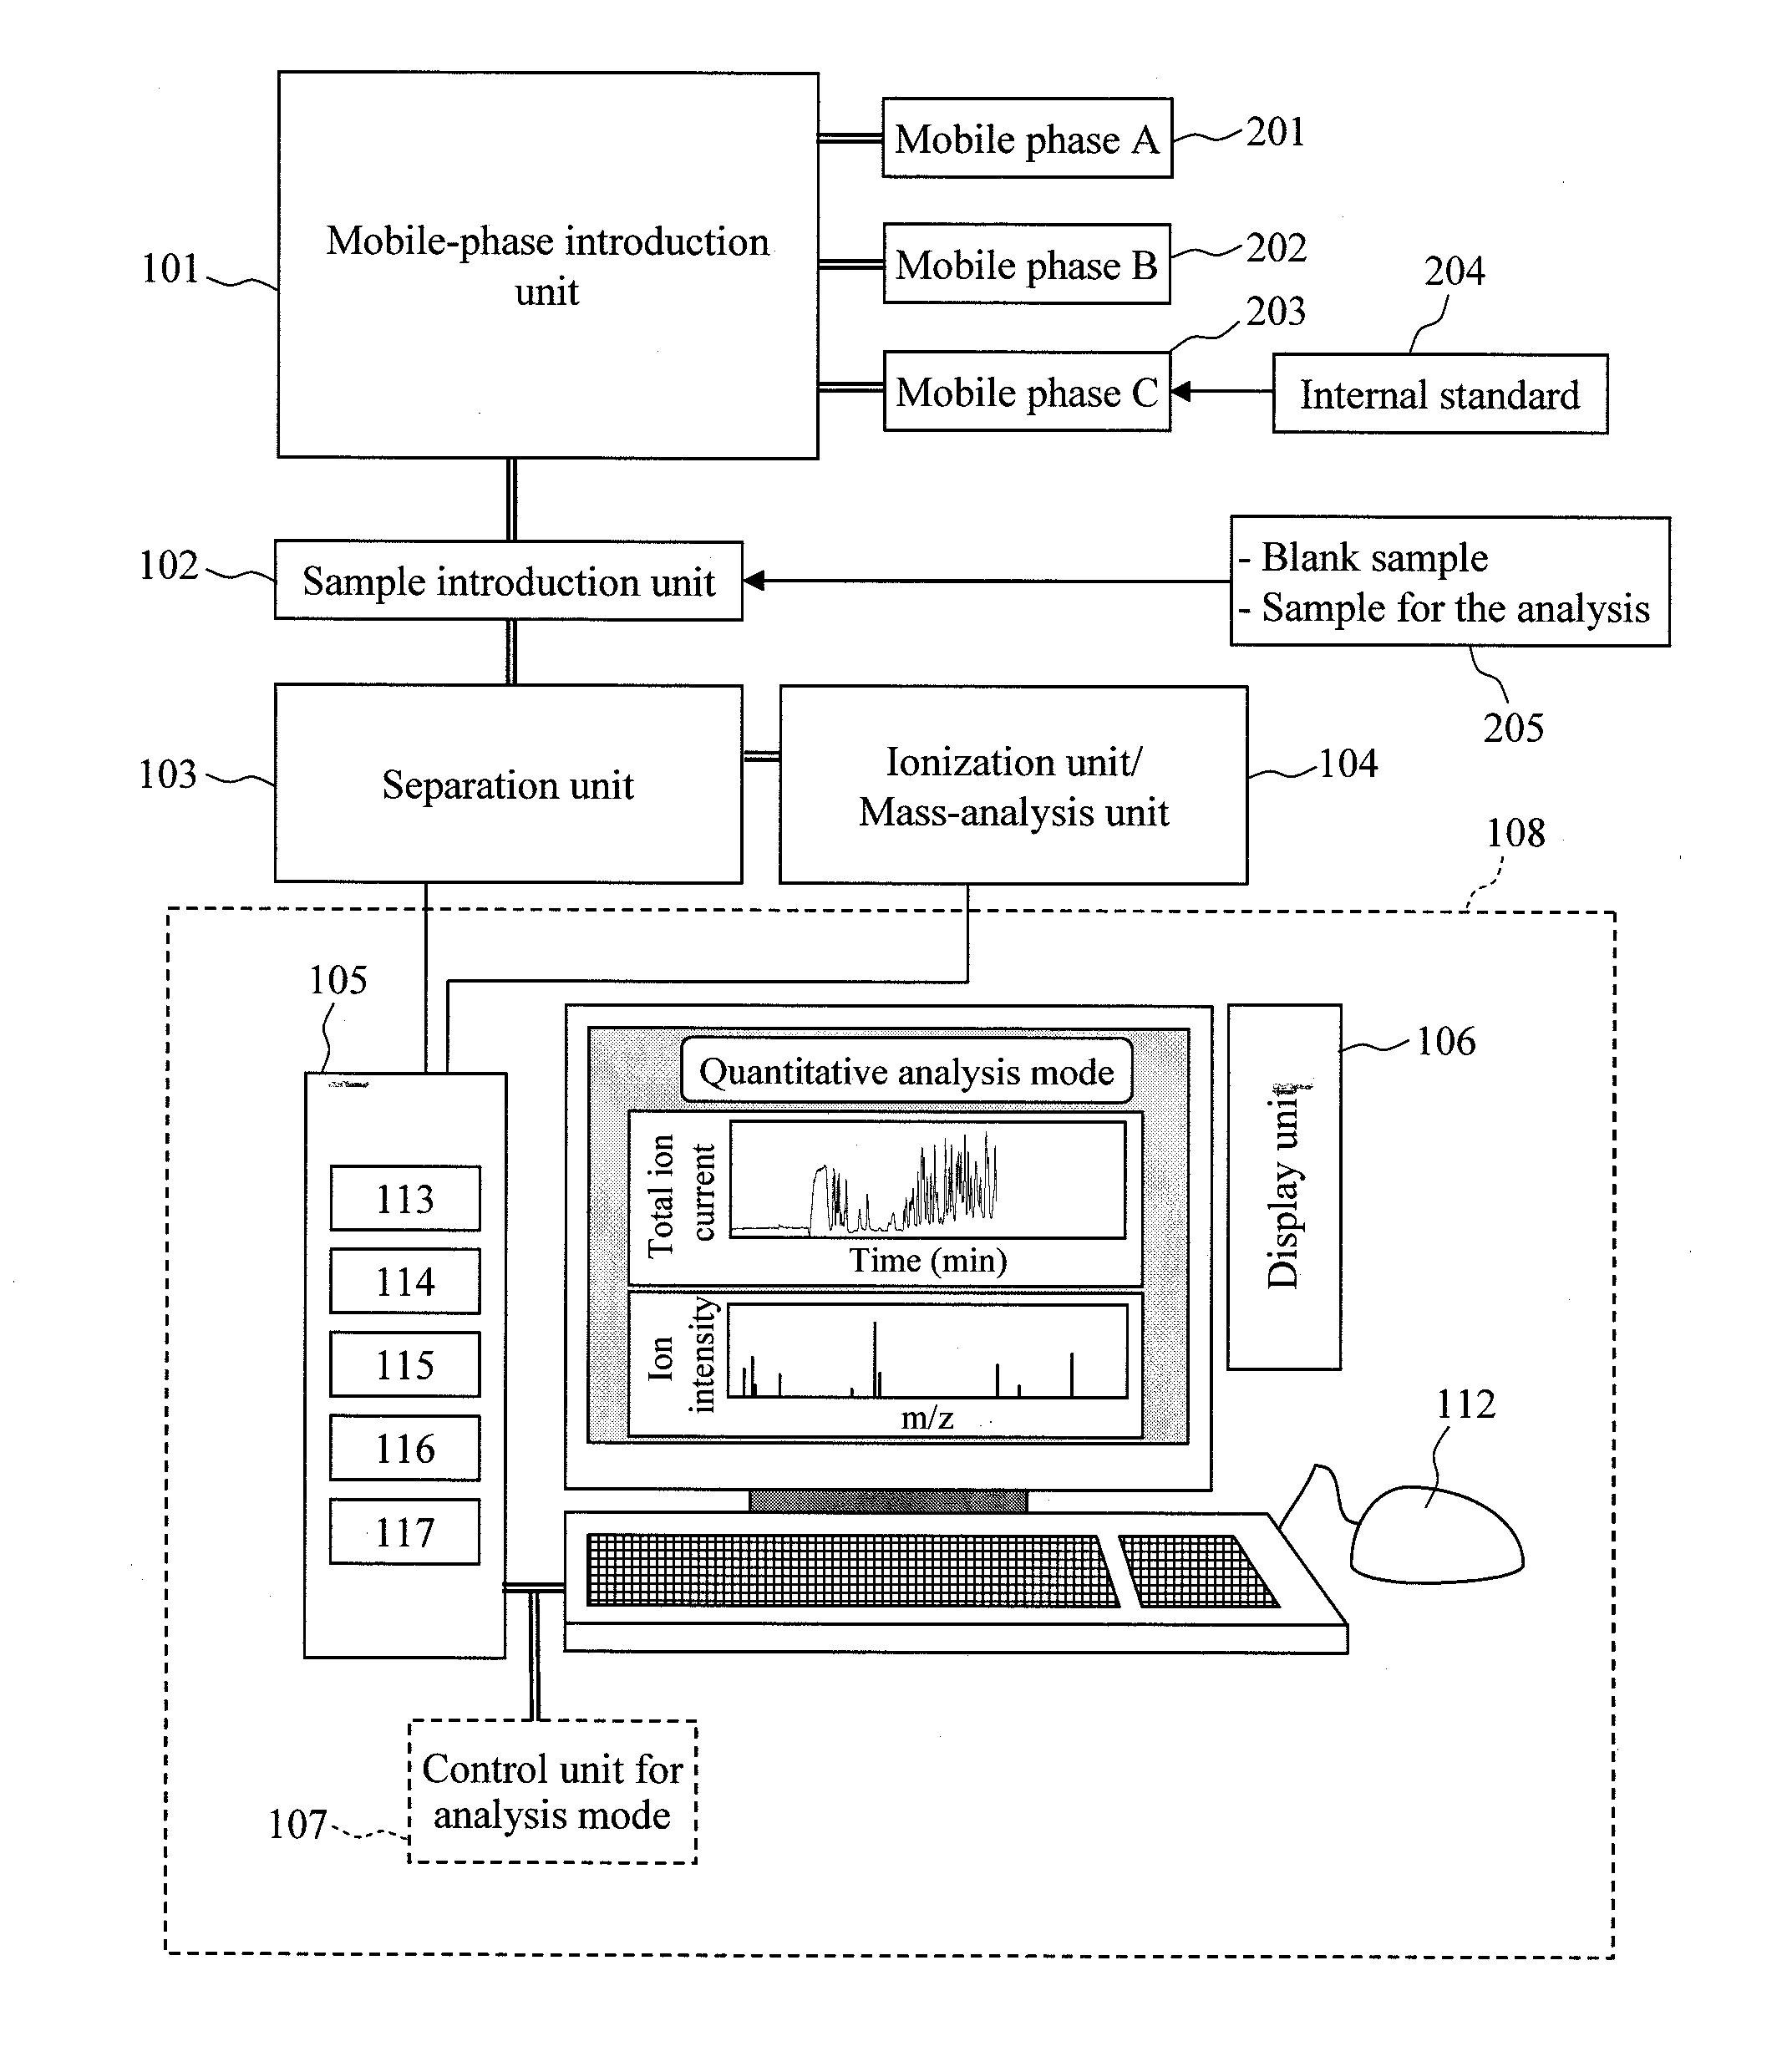
[0115]FIG. 1 shows a constitution diagram of an Example in a mass spectrometry system according to the present invention. The system comprises a mobile-phase introduction unit 101, a sample introduction unit 102, a separation unit 103, an ionization / mass-analysis unit 104, a data analysis unit 105, a display unit 106, and a control unit of analysis mode 107. The data analysis unit 105, the display unit 106 and the control unit of analysis mode 107 are put together as a control system 108. Each unit of the mobile-phase introduction unit 101, the sample introduction unit 102, the separation unit 103, the ionization / mass-analysis unit 104 and the control system 108 is collectively controlled by a system control unit to supervise the whole system, and desired operations are achieved while information of control states is bilaterally exchanged between each unit of the system. A mobile phase is introduced from the mobile-phase introduction unit 101; a sample 205 composed of various compon...

example 2

[0152]Next, as Second Example, analysis means using two types of internal standards will be described using FIG. 5 and FIG. 10. As shown in FIG. 10, use of two types of internal standards does not allow for evaluation by performing two times of analyses as in Example 1, but allows for evaluation of the presence / absence of the occurrence of quantitative analysis-inhibitory factors by one time of the analysis. Thereby, the analysis time can be further reduced. The two types of internal standards are selected such that these are substances to be always detected as ions, that is, hydrophilic substances; and one of them is acidic, and the other thereof is basic; and the former sensitively changes to quantitative analysis-inhibitory factors, and the latter hardly changes.

[0153]That is, one of the internal standards to be selected has an isoelectric point of about 3 or more and 8 or less; and the other thereof has that nearly equal to or more than 8. Here, a substance having a high hydroph...

example 3

[0156]As Third Example, means will be described in which one type of an internal standard is introduced and denoted as a first internal standard; and a second internal standard is not positively introduced, and a component capable of becoming a second internal standard is searched from component substances such as impurities unintentionally mixed; and mass chromatograms of the both are simultaneously compared. The analysis steps of the present Example, as shown in FIG. 11, has a step (S1024) of searching and selecting a substance usable as a second internal standard, the step being added as compared to Second Example in FIG. 10. In this case, the first internal standard to be selected is, as in the first internal standard in Second Example, a hydrophilic and acidic substance, and the substance sensitively reacting to quantitative analysis-inhibitory factors.

[0157]A search monitor for the second internal standard is provided; and a substance which is present in the analyzer and stabl...


PUM


Abstract

In quantitation without using the isotope labeling technique, there is no means to detect the presence/absence and the time region of the occurrence of quantitative analysis-inhibitory factors in data for the analysis, and the reliability of the data for the analysis cannot be evaluated. Also, the error of the data due to the occurrence of the quantitative analysis-inhibitory factors cannot be evaluated. In order to solve the problems, first, an internal standard to be detected simultaneously with a component for the analysis is mixed in a mobile phase or an eluate of a liquid chromatograph; under the condition where no quantitative analysis-inhibitory factors occur, a blank sample is analyzed to acquire a mass chromatogram of ions originated from the internal standard; and the result is stored in a data storage unit. Then, a sample for the analysis is mixed to acquire data for the analysis of the sample; and the intensity of ions originated from the internal standard is compared with that of the blank sample in the analysis real time in a data analysis unit. At this time, if an inconsistency exceeding a predetermined threshold is detected, the occurrence of the quantitative analysis-inhibitory factors can be detected. Further, based on the inconsistency, the error range of the data can be given to a data set and the like.

Description

TECHNICAL FIELD[0001]The present invention relates to a mass spectrometry system for organism-related substances and organic substances, and the like, and particularly to a quantitative mass spectrometry and a mass spectrometry system for pharmacokinetics and drug metabolism in drug discovery, protein analyses, and searches for clinical markers. The present invention relates further to an automatic tester and an automatic analyzer to analyze body fluids and the like.BACKGROUND ART[0002]In marker searches and the like for disease diagnoses, it is important that analysis results of samples originated from disease subjects and samples originated from healthy subjects be compared and that variant components exhibiting outstanding differences be extracted from among detected components. Additionally, it is also necessary that the variant components be identified. In such analyses, liquid chromatograph / mass spectrometers (LC / MS) are often used. The LC / MS is an on-line system capable of se...

Claims


Application Information

Patent Timeline
IPC IPC(8): H01J49/00
CPCG01N30/7233H01J49/0009G01N30/8675
Inventor HIRABAYASHI, ATSUMUISHIMARU, MASAKOYOSHINARI, KIYOMIMANRI, NAOMI
Owner HITACHI HIGH-TECH CORP
Why Eureka
Try Eureka