

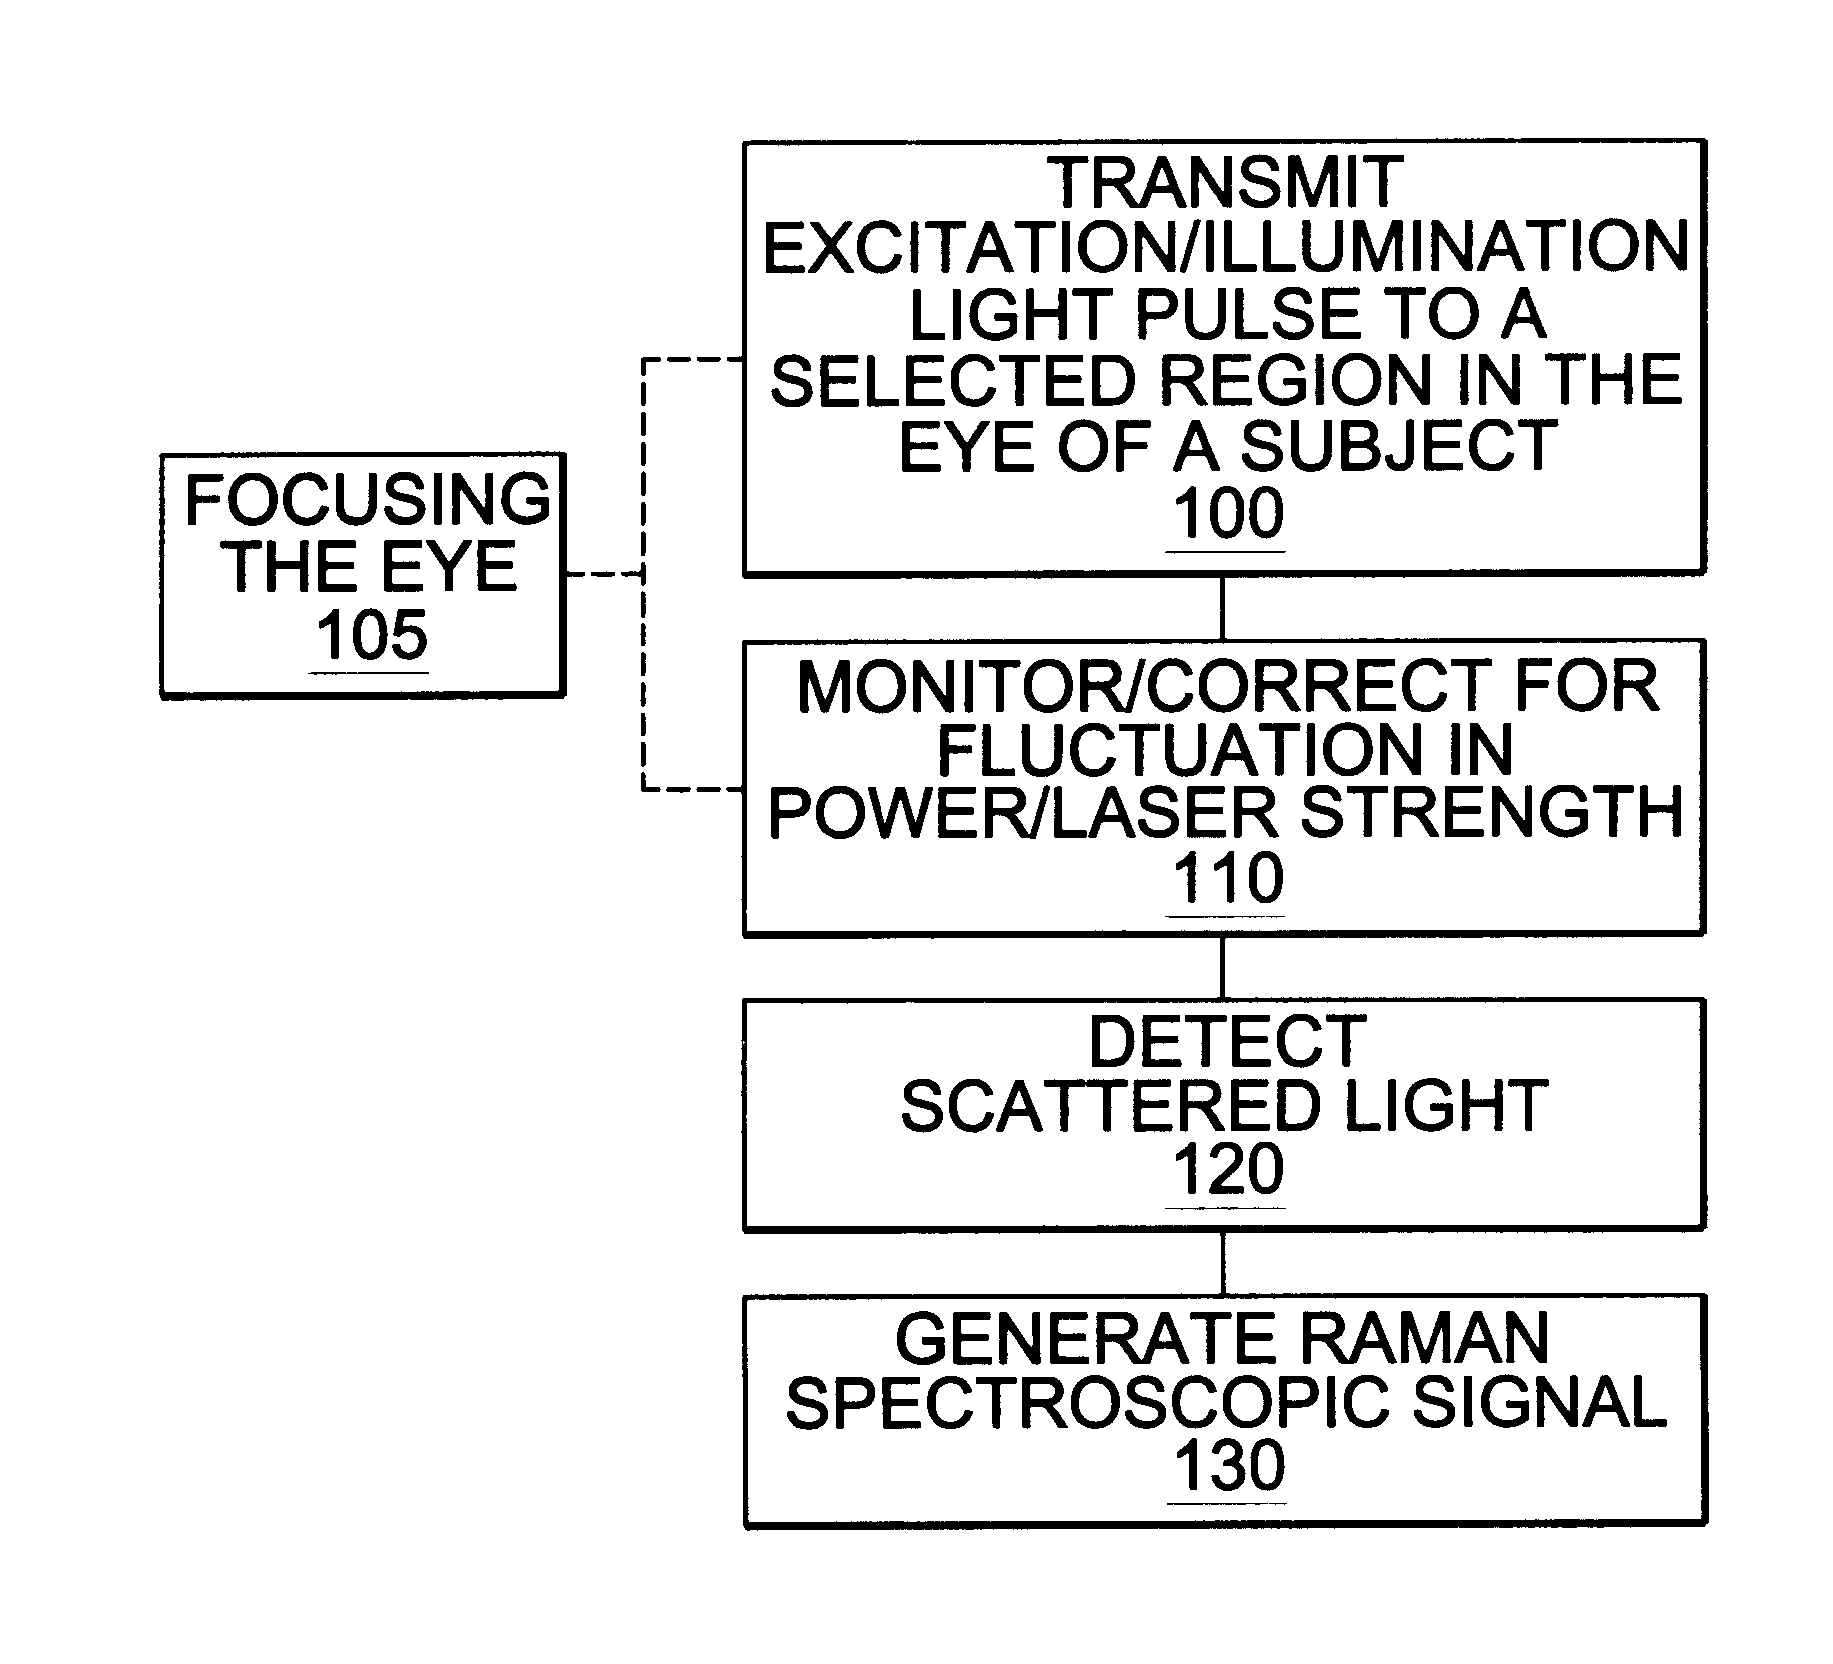
Assessing blood brain barrier dynamics or identifying or measuring selected substances or toxins in a subject by analyzing Raman spectrum signals of selected regions in the eye
a blood brain barrier and signal analysis technology, applied in the field of assessing blood brain barrier dynamics or identifying or measuring selected substances or toxins in a subject by analyzing raman spectrum signals of selected regions in the eye, can solve the problems of undesirable toxic drug amount, systemic delivery, away from the targeted treatment region in the brain, etc., to reduce the energy/density exposure rating, reduce the energy/area rating of the excitation pulse, and expose more of the retina
- Summary
- Abstract
- Description
- Claims
- Application Information
AI Technical Summary
Benefits of technology
Problems solved by technology
Method used
Image

Examples
example 1
Measurement of Aqueous Humor Glucose In Vitro with Raman Spectroscopy
Aqueous humor was obtained from sixteen New Zealand white rabbits within one minute of sacrifice by other investigators. These animals had experienced experimental myocardial infarction 48 hours prior to euthanasia. They were sacrificed by rapid exsanguination under ketamine and xylazine anesthesia. Aqueous humor samples were kept frozen until glucose levels could be measured and Raman spectroscopy performed. Glucose concentration was measured with a commercial glucometer (Glucometer Elite, Bayer, Elkhart, Ind., USA) and confirmed against concentration standards. Each measurement was repeated, and the average measurement was considered actual glucose concentration.
Samples were placed in conical quartz cuvettes designed to hold a volume of 80 .mu.L and permit direct optical access to the solution by the spectrometer without traversing glass walls or coverslips.
Raman spectroscopy was performed with a f / 1.8 holographi...
example 2
Correlation of Aqueous Humor Glucose with Rising Blood Glucose
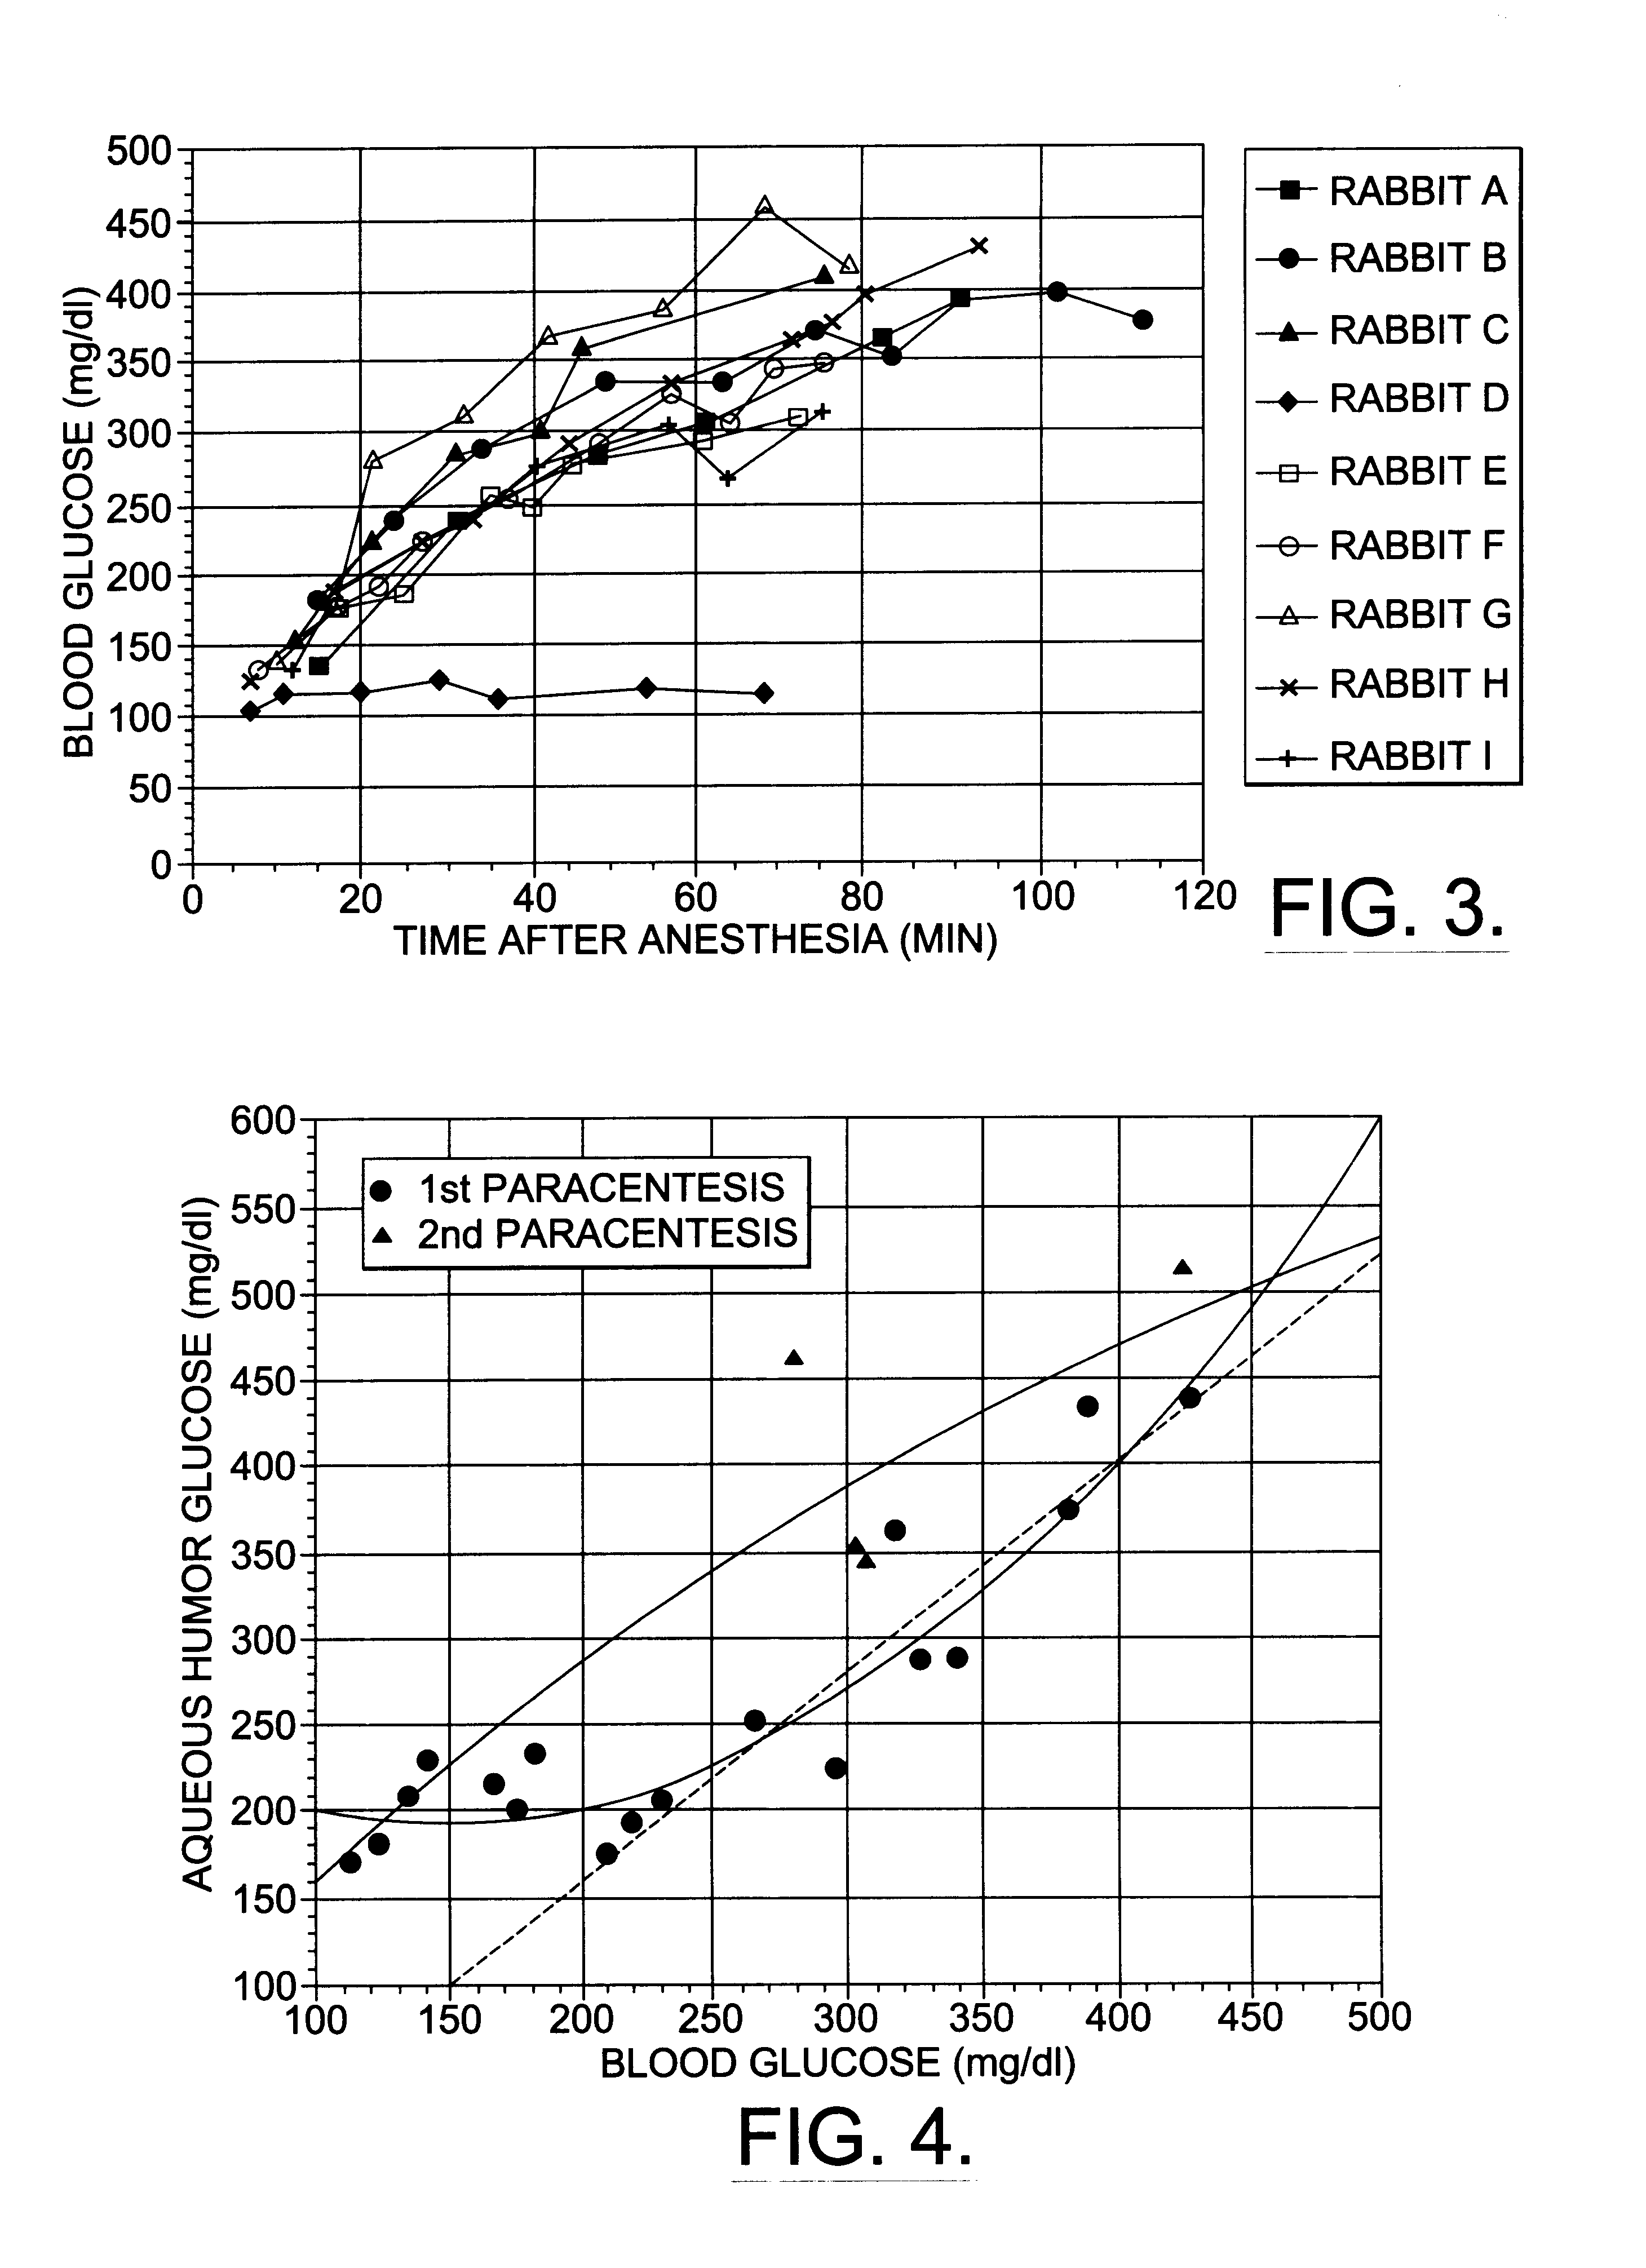
Nine female New Zealand white rabbits were used for this part of the study. They were anesthetized with ketamine (50 mg / kg) and xylazine (7.5 mg / kg) given as a single intramuscular injection. Xylazine blocks release of insulin from the pancreas and causes blood glucose to rise (K. Chalabi et al., Ophthalmic Res. 19, 289 (1987); J. Arnbjerg et al., Ophthalmic Res. 22, 265 (1990)).
Blood samples were taken from the central ear arteries at various times following the injection of anesthetic once the animals were adequately anesthetized. Whole blood was immediately measured for glucose concentration with a commercial glucometer (Glucometer Elite, Bayer). In most instances two measurements were made. The average measurements are reported. If the measurements differed by more than 20%, a third measurement was made. If one measurement differed by more than 20% from the mean, it was discarded. In instances when blood glucose conce...
example 3
Results for Measurement of Aqueous Humor Glucose In Vitro with Raman Spectroscopy
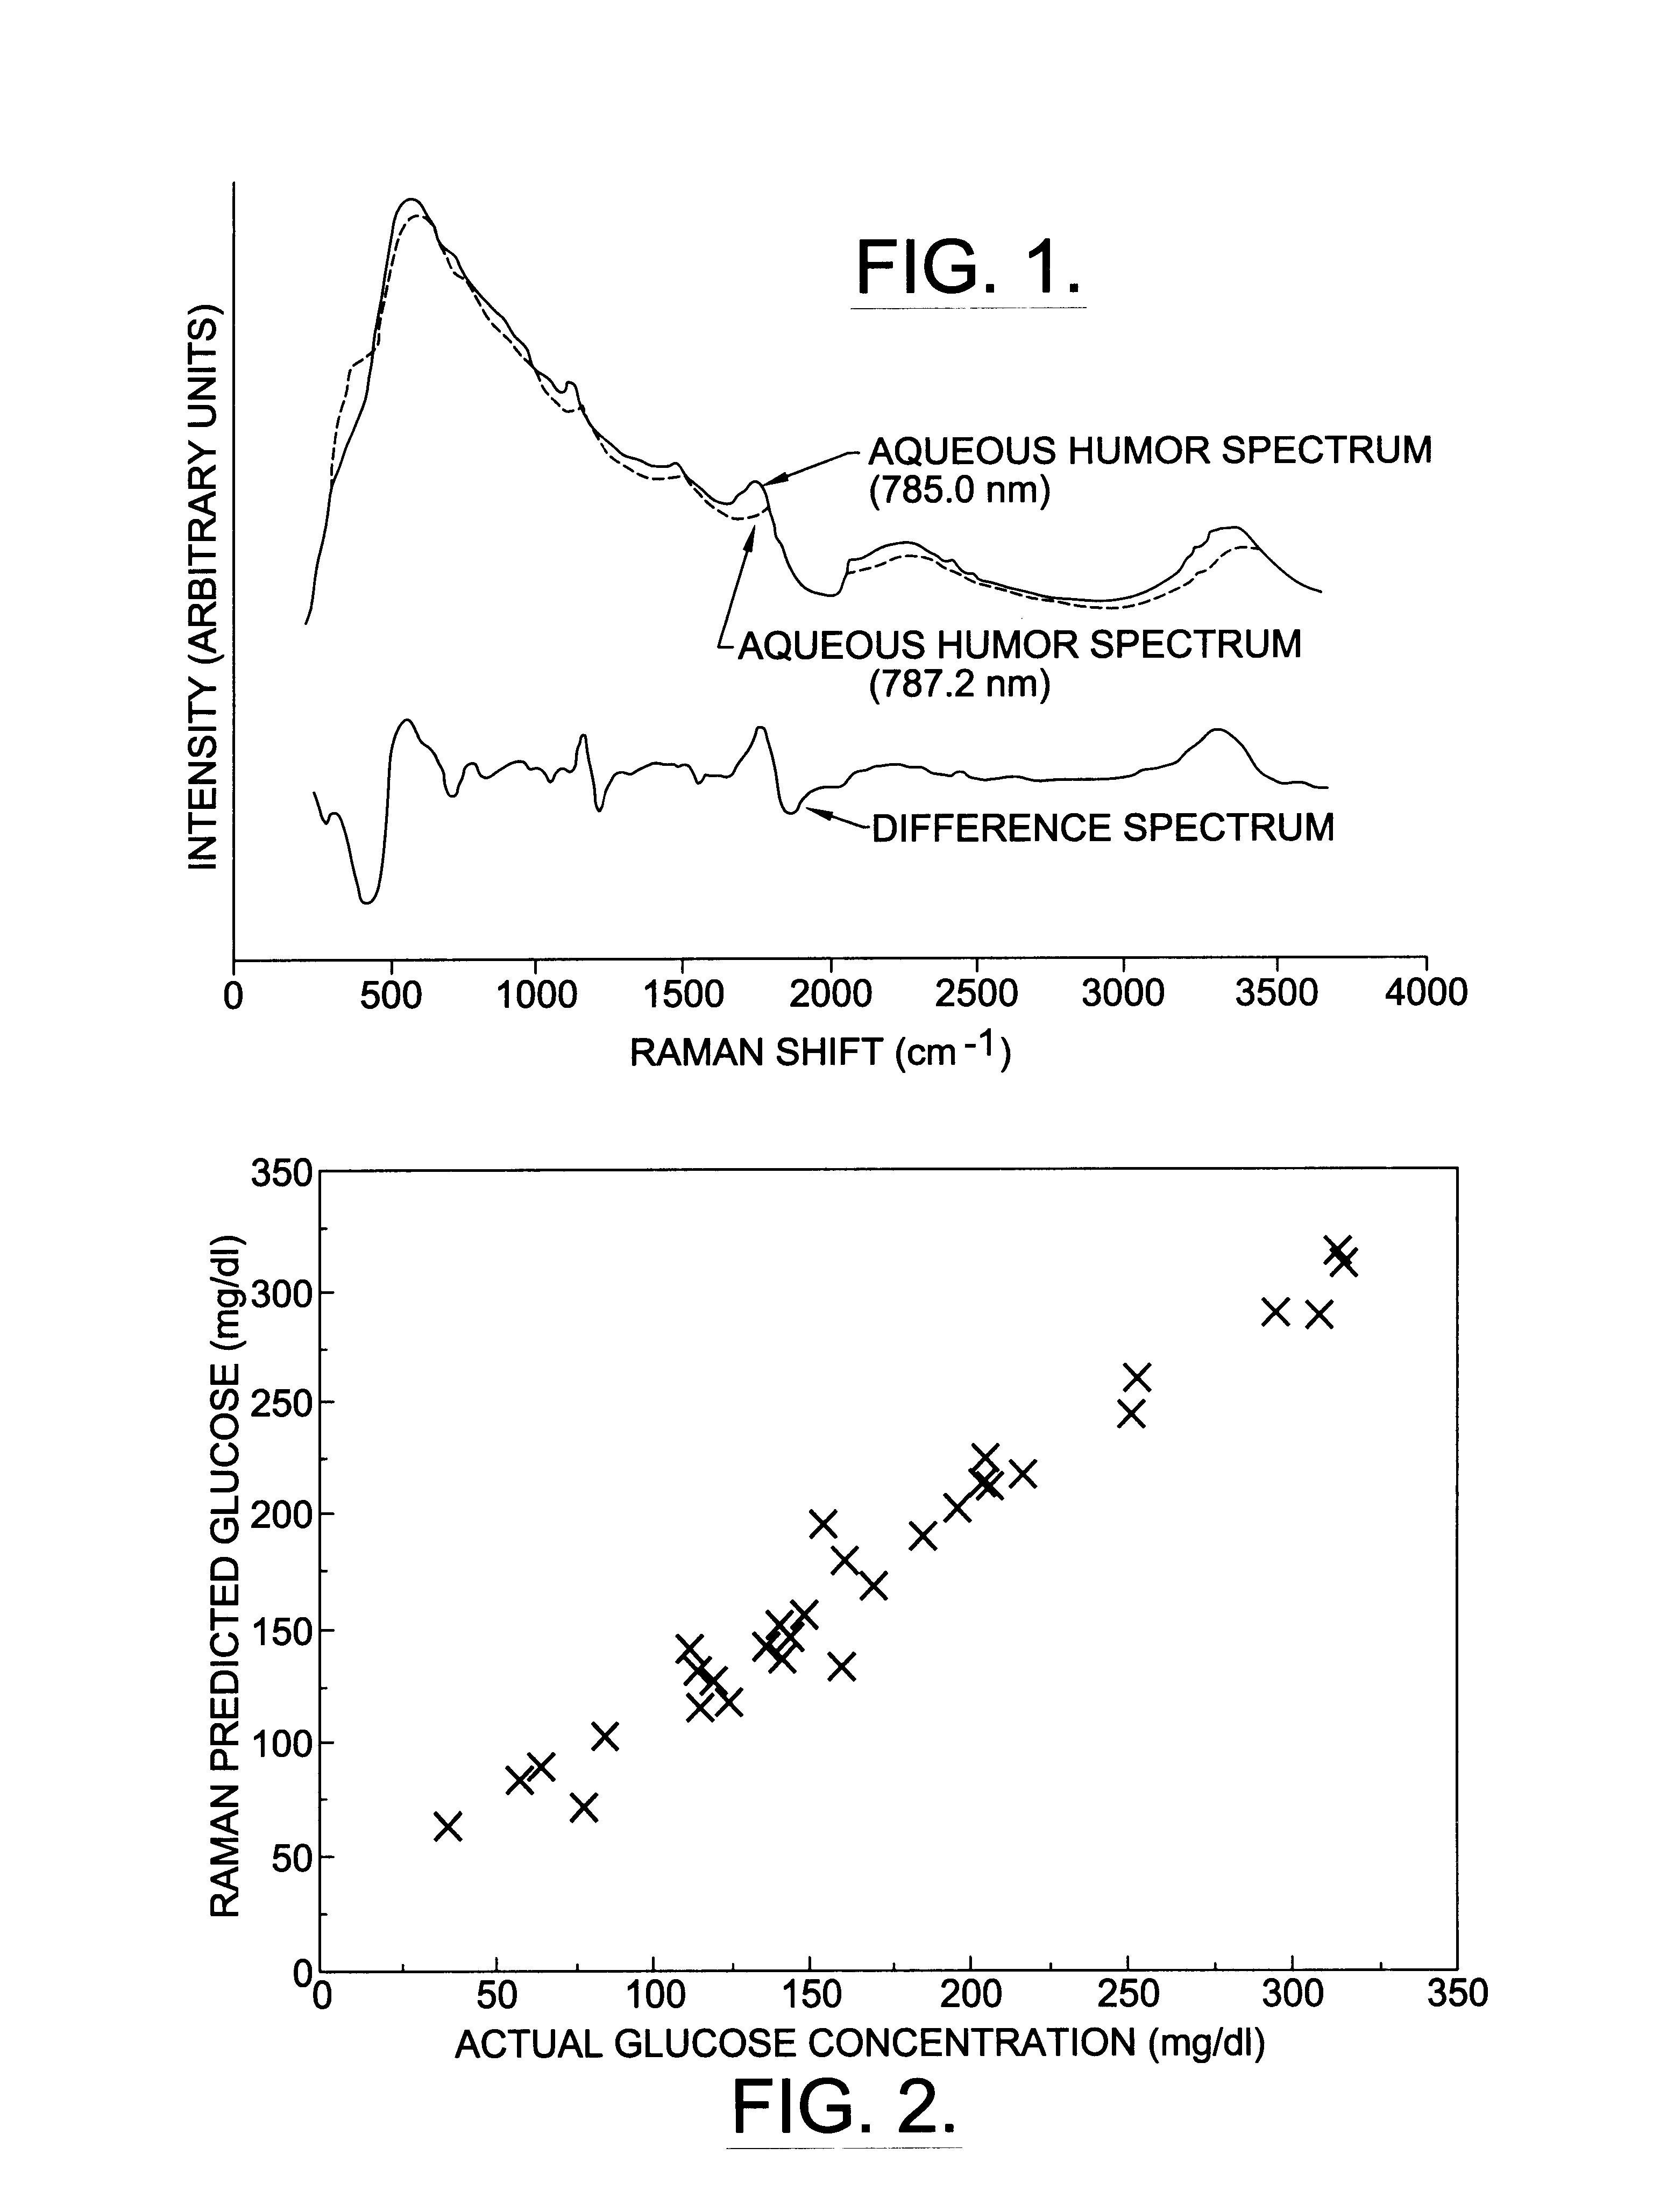
The raw spectra of rabbit aqueous humor show broad fluorescence peaks that obscure the underlying Raman signature (FIG. 1). When the spectra from the two slightly different wavelengths are subtracted, one from the other, the Raman shifted spectra become apparent as bipolar peaks.
Actual aqueous humor glucose concentration, measured by the glucometer, ranged from 37 to 323 mg / dL in the thirty-two samples. Multivariate analysis of the raw spectra from these samples with the partial least squares algorithm revealed fair correlation (r.sup.2 =0.76) between the predicted aqueous humor glucose concentration and the actual concentration. Multivariate analysis of the subtracted spectra from these samples with the partial least squares algorithm resulted in improved correlation (r.sup.2 =0.90) between the predicted aqueous humor glucose concentration and the actual concentration. When back propagation with an art...
PUM
 Abstract
Description
Claims
Application Information