Method for probabilistically classifying tissue in vitro and in vivo using fluorescence spectroscopy

a fluorescence spectroscopy and tissue technology, applied in the direction of fluorescence/phosphorescence, diagnostics using spectroscopy, instruments, etc., can solve the problems of incomplete understanding of the quantitative information contained within the tissue fluorescence spectrum, various approaches have not been entirely satisfactory, etc., to achieve faster, more effective patient management, and reduce mortality

Inactive Publication Date: 2007-06-26
BOARD OF RGT THE UNIV OF TEXAS SYST
View PDF9 Cites 84 Cited by
  • Summary
  • Abstract
  • Description
  • Claims
  • Application Information

AI Technical Summary

Benefits of technology

[0010]The present invention advantageously achieves a real time, non-invasive, and automated method and apparatus for classifying normal, cancerous and precancerous tissue in a diagnostically useful manner, such as by histopathological classifications, to allow faster, more effective patient management and potentially further reduce mortality.

Problems solved by technology

Although a complete understanding of the quantitative information contained within a tissue fluorescence spectrum has not been achieved, many groups have applied fluorescence spectroscopy for real-time, non-invasive, automated characterization of tissue pathology.
However, these various approaches have not been entirely satisfactory.

Method used


Image

  • Method for probabilistically classifying tissue in vitro and in vivo using fluorescence spectroscopy
  • Method for probabilistically classifying tissue in vitro and in vivo using fluorescence spectroscopy
  • Method for probabilistically classifying tissue in vitro and in vivo using fluorescence spectroscopy

Examples


first example

Instrumentation

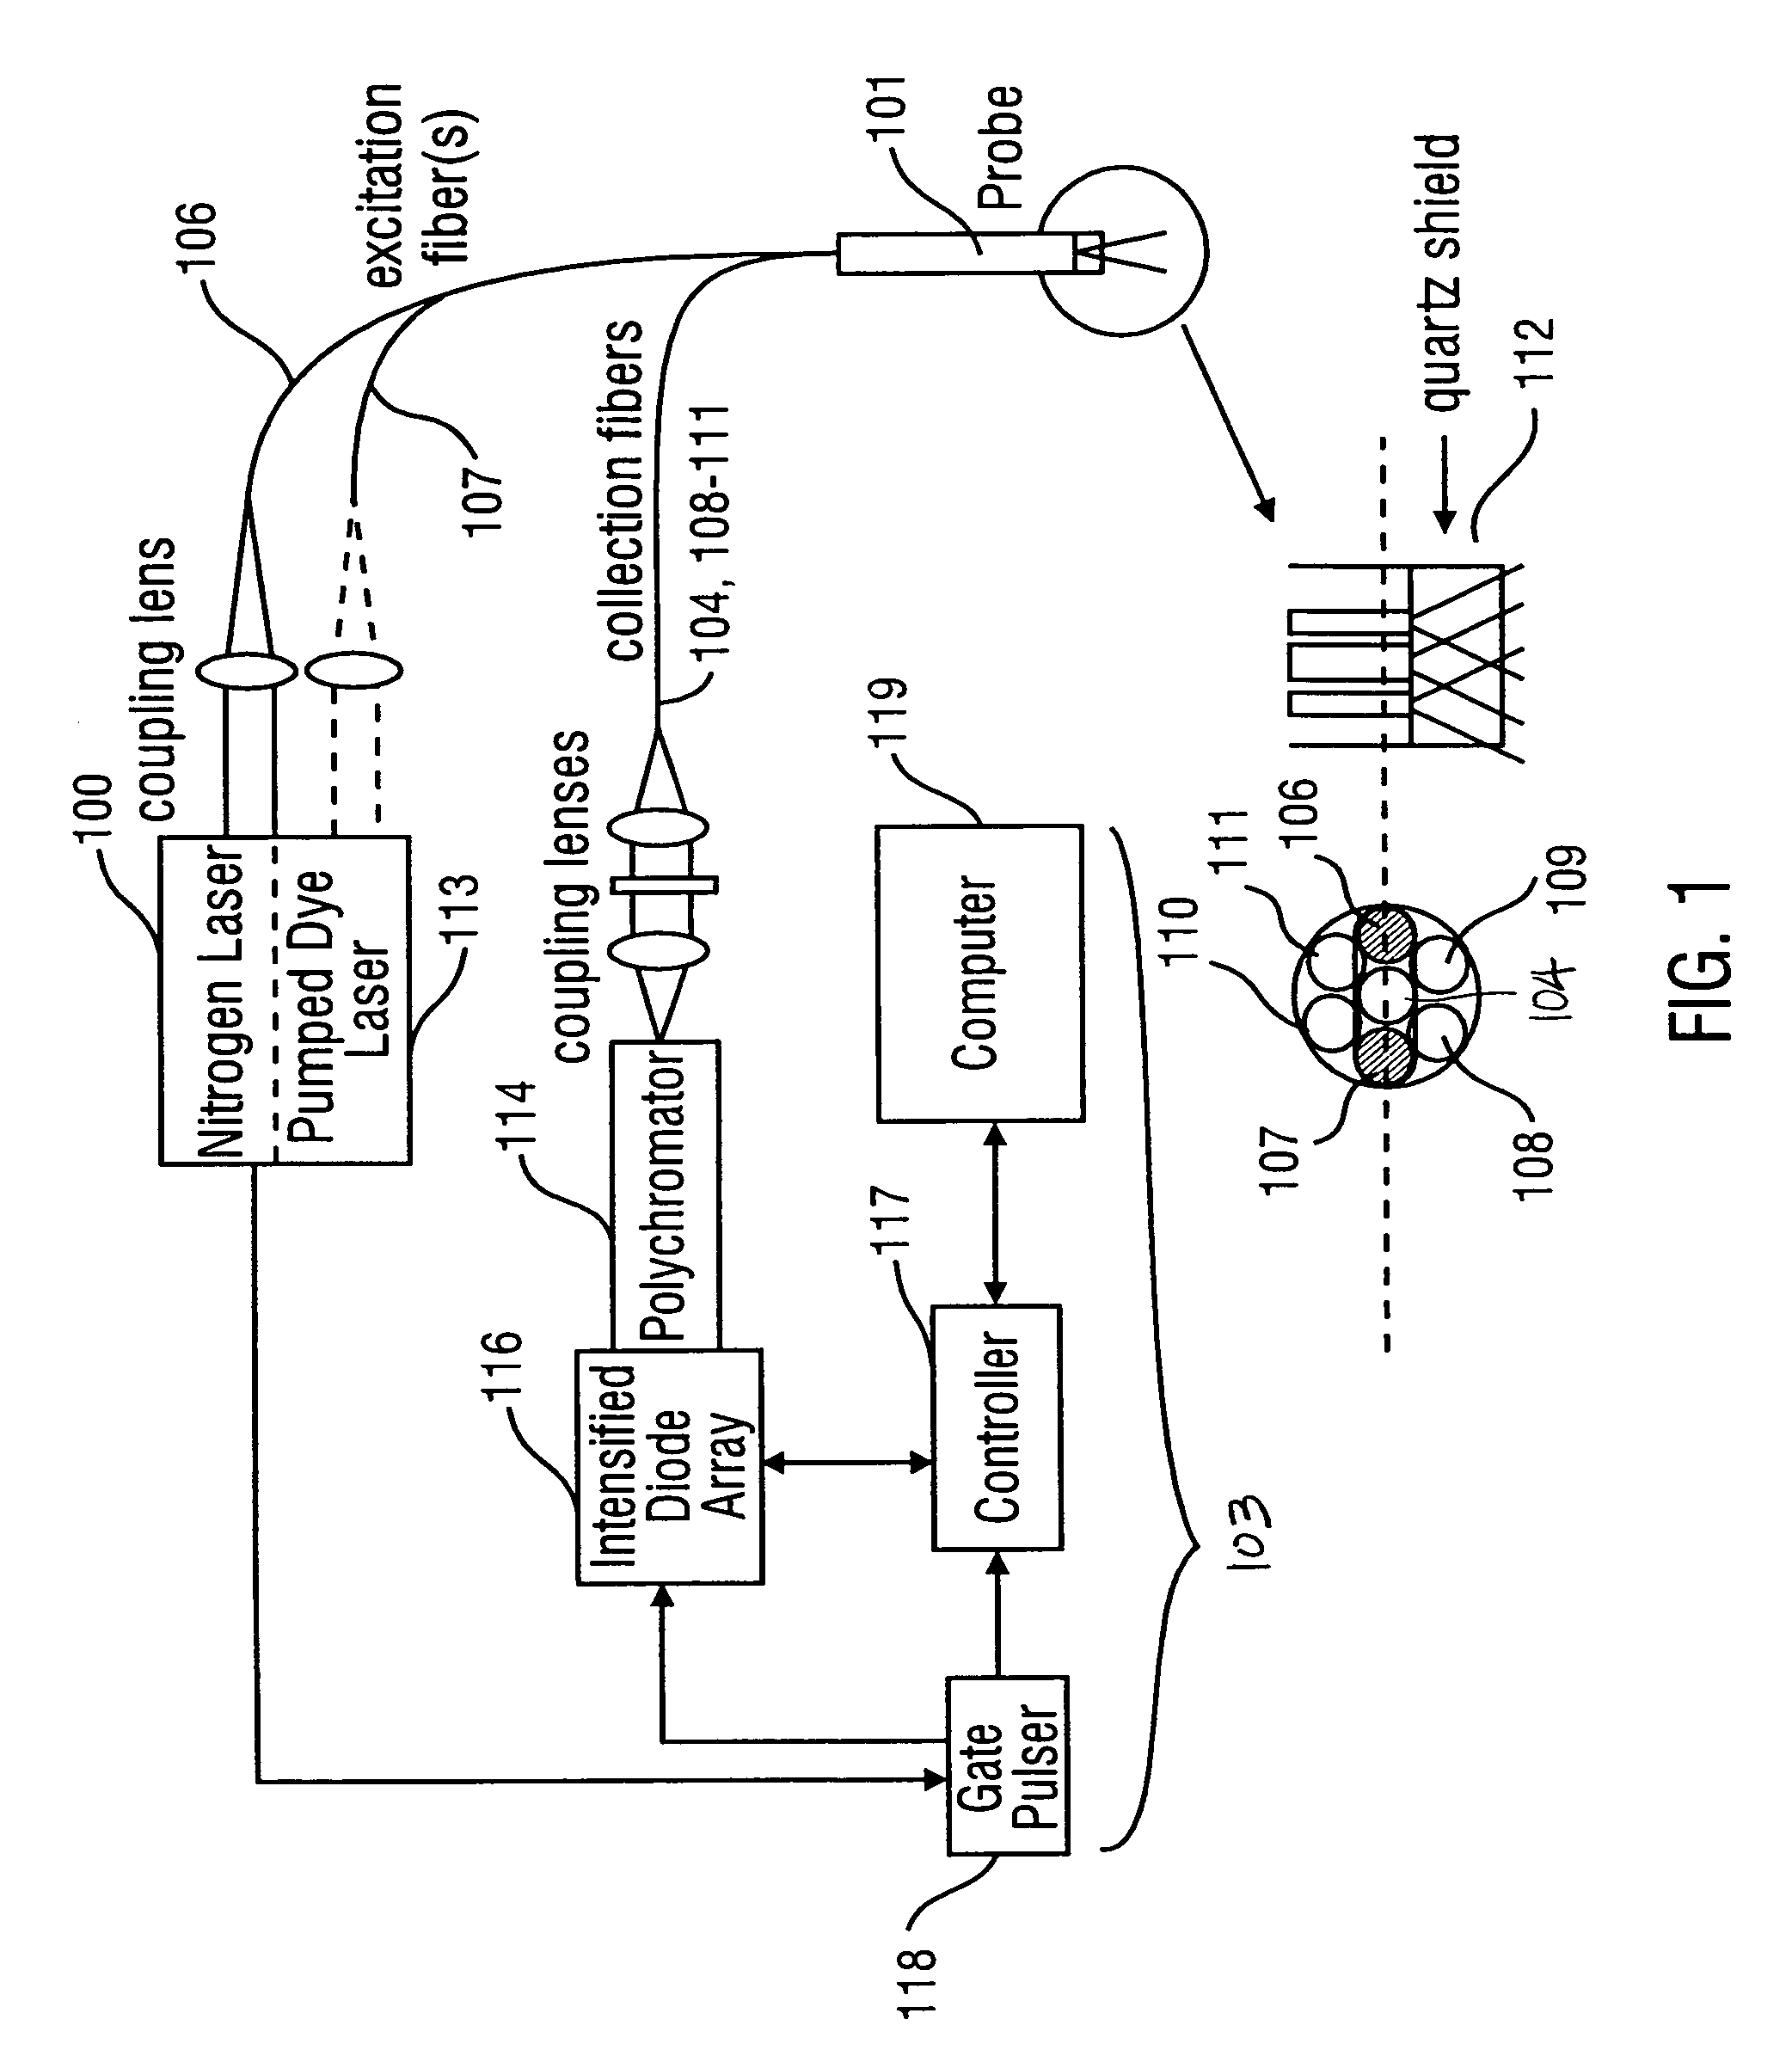
[0066]Fluorescence spectra were recorded with a spectroscopic system incorporating a pulsed nitrogen pumped dye laser, an optical fiber probe and an optical multi-channel analyzer at colposcopy. The laser characteristics for the study were: 337, 380 and 460 nm wavelengths, transmitted pulse energy of 50 uJ, a pulse duration of 5 ns and a repetition rate of 30 Hz. The probe includes 2 excitation fibers, one for each wavelength and 5 collection fibers. Rhodamine 6G (8 mg / ml) was used as a standard to calibrate for day to day variations in the detector throughput. The spectra were background subtracted and normalized to the peak intensity of rhodamine. The spectra were also calibrated for the wavelength dependence of the system.

[0067]FIG. 1 is an exemplary spectroscopic system for collecting and analyzing fluorescence spectra from cervical tissue. The system incorporates a pulsed nitrogen pumped dye laser 100, an optical fiber probe 101 and an optical multi-channel analy...

second example

[0110]The first example described above is limited in two principal ways. A first limitation is that fluorescence spectra were not acquired at all three excitation wavelengths (337, 380 and 460 nm) from every patient in the study. Therefore, analysis of spectral data from these studies did not indicate if the classification accuracy of each of the three constituent algorithms developed using spectra at a single excitation wavelength could be improved by utilizing tissue spectra at all three excitation wavelengths. A second limitation of these studies is that the accuracy of composite screening and diagnostic algorithms utilizing a combination of the constituent algorithms could not be evaluated since tissue spectra were not available at all three excitation wavelengths from the same group of patients.

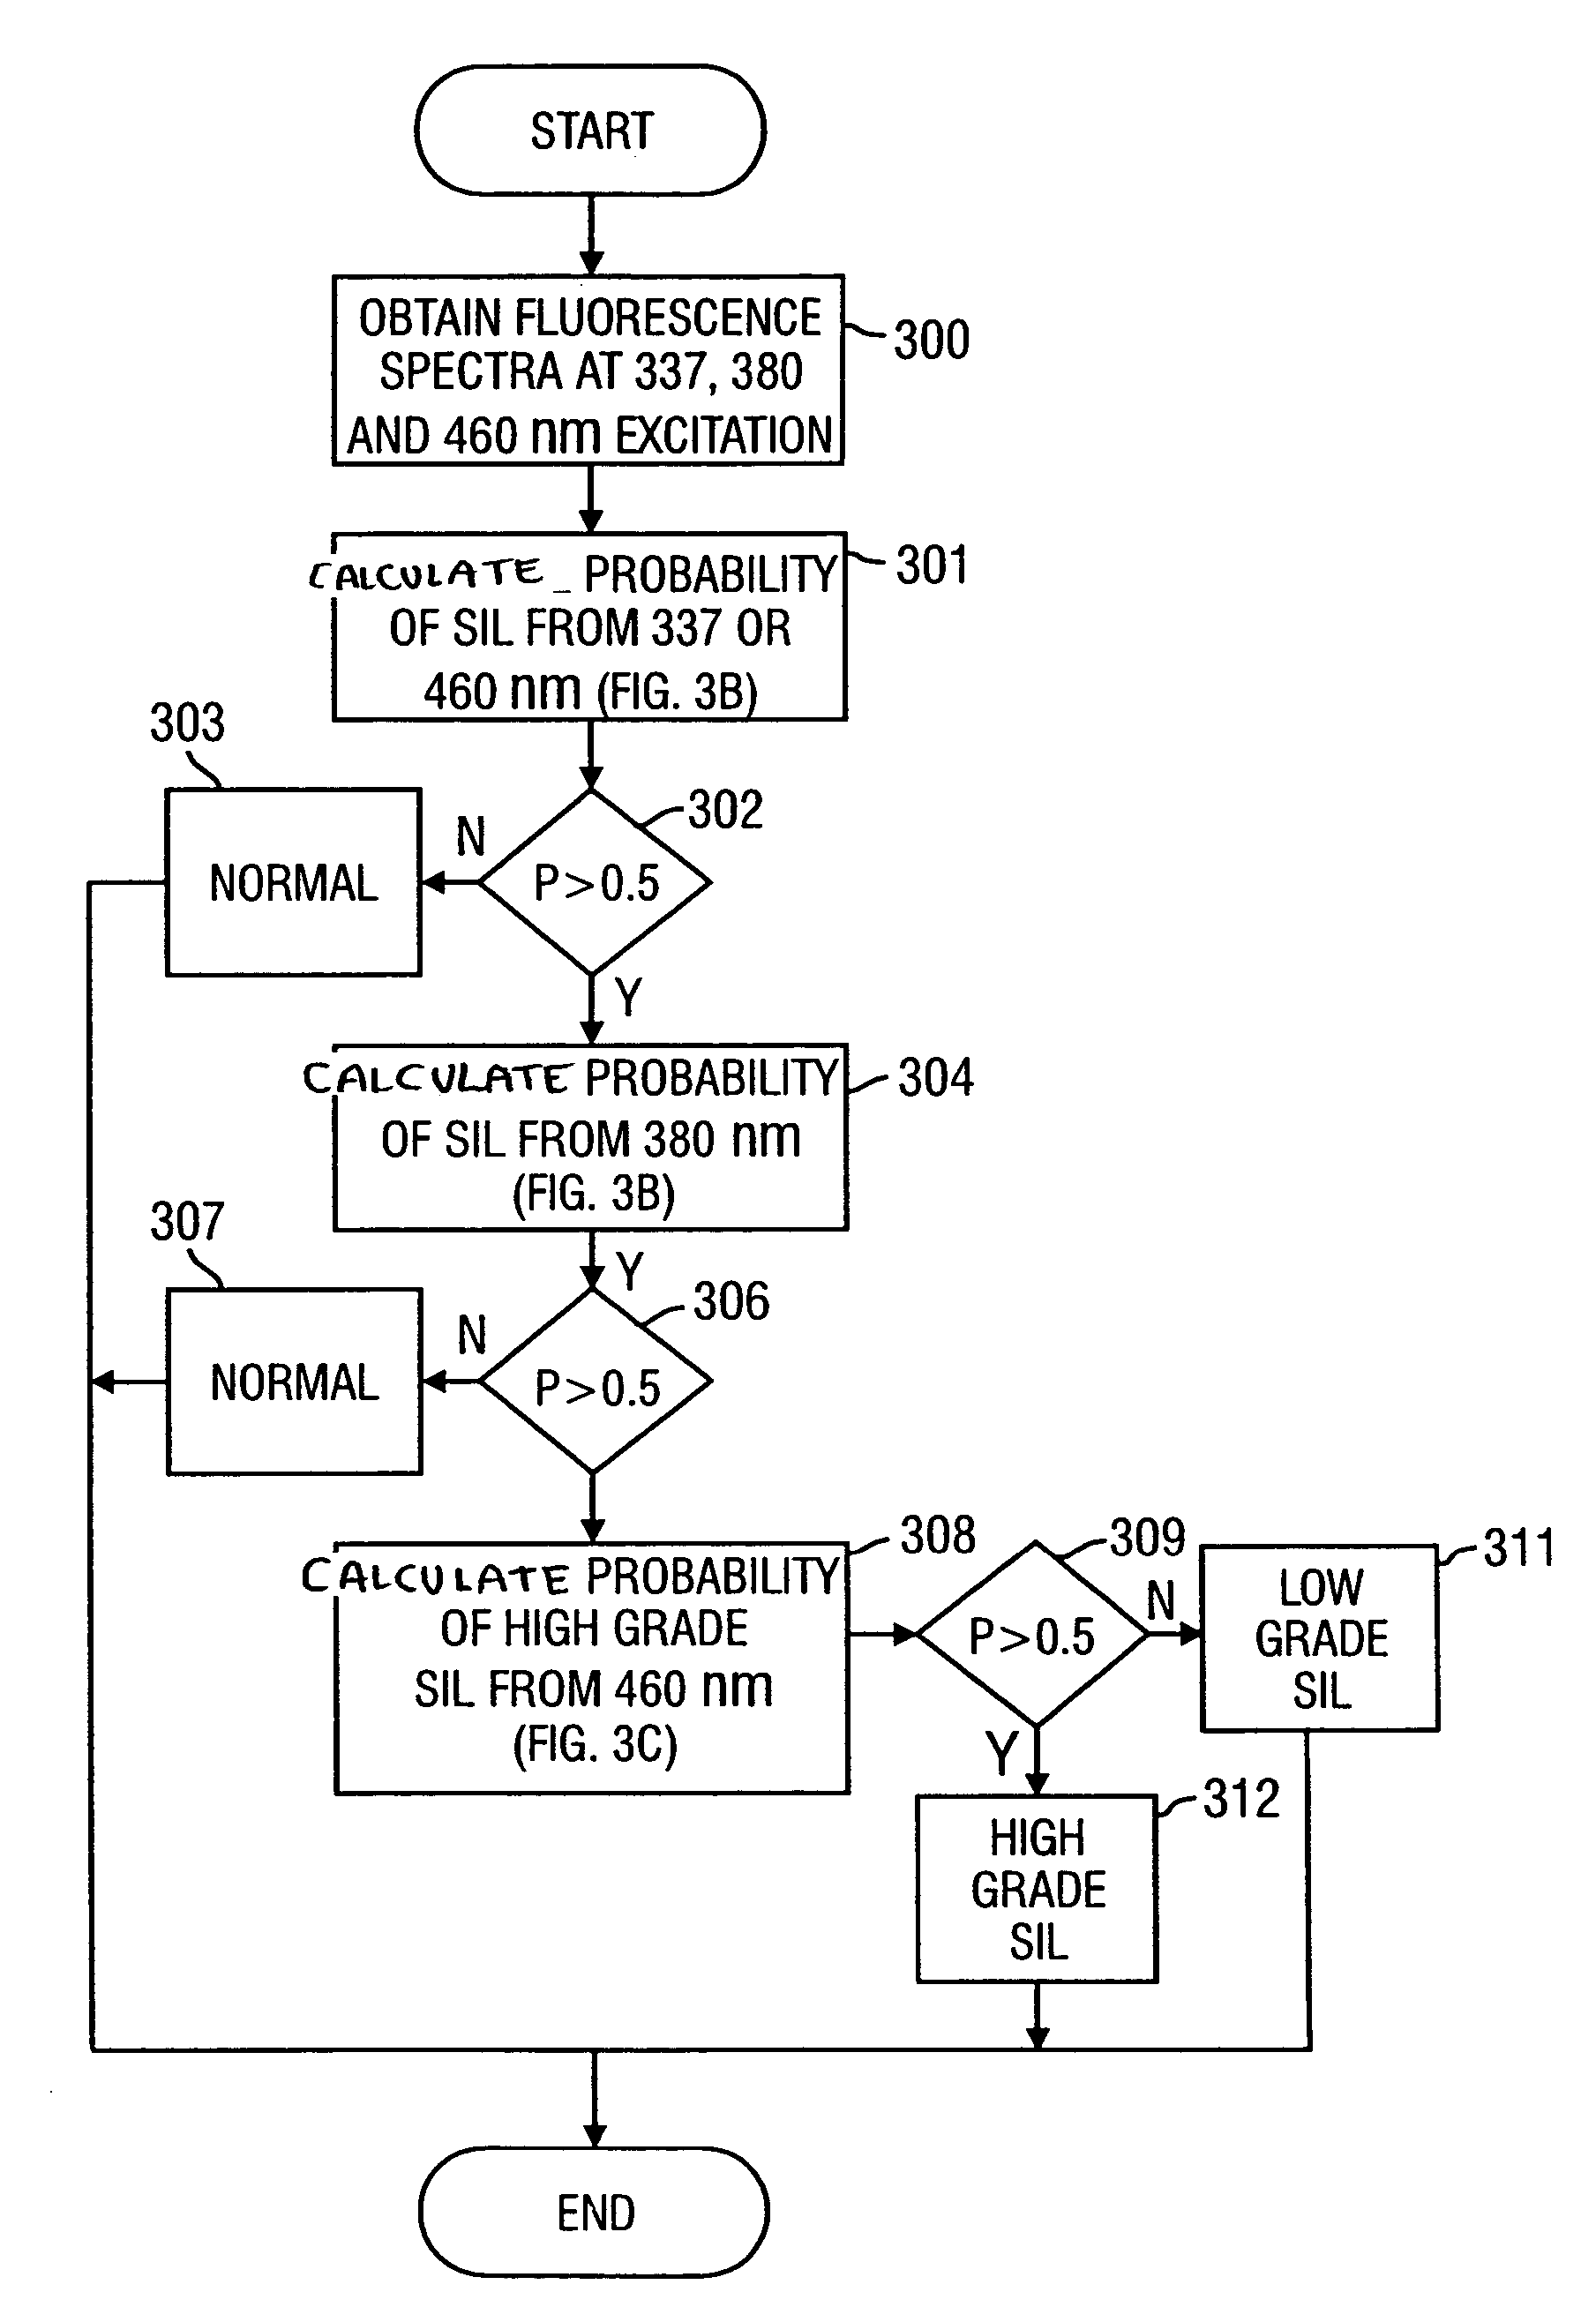
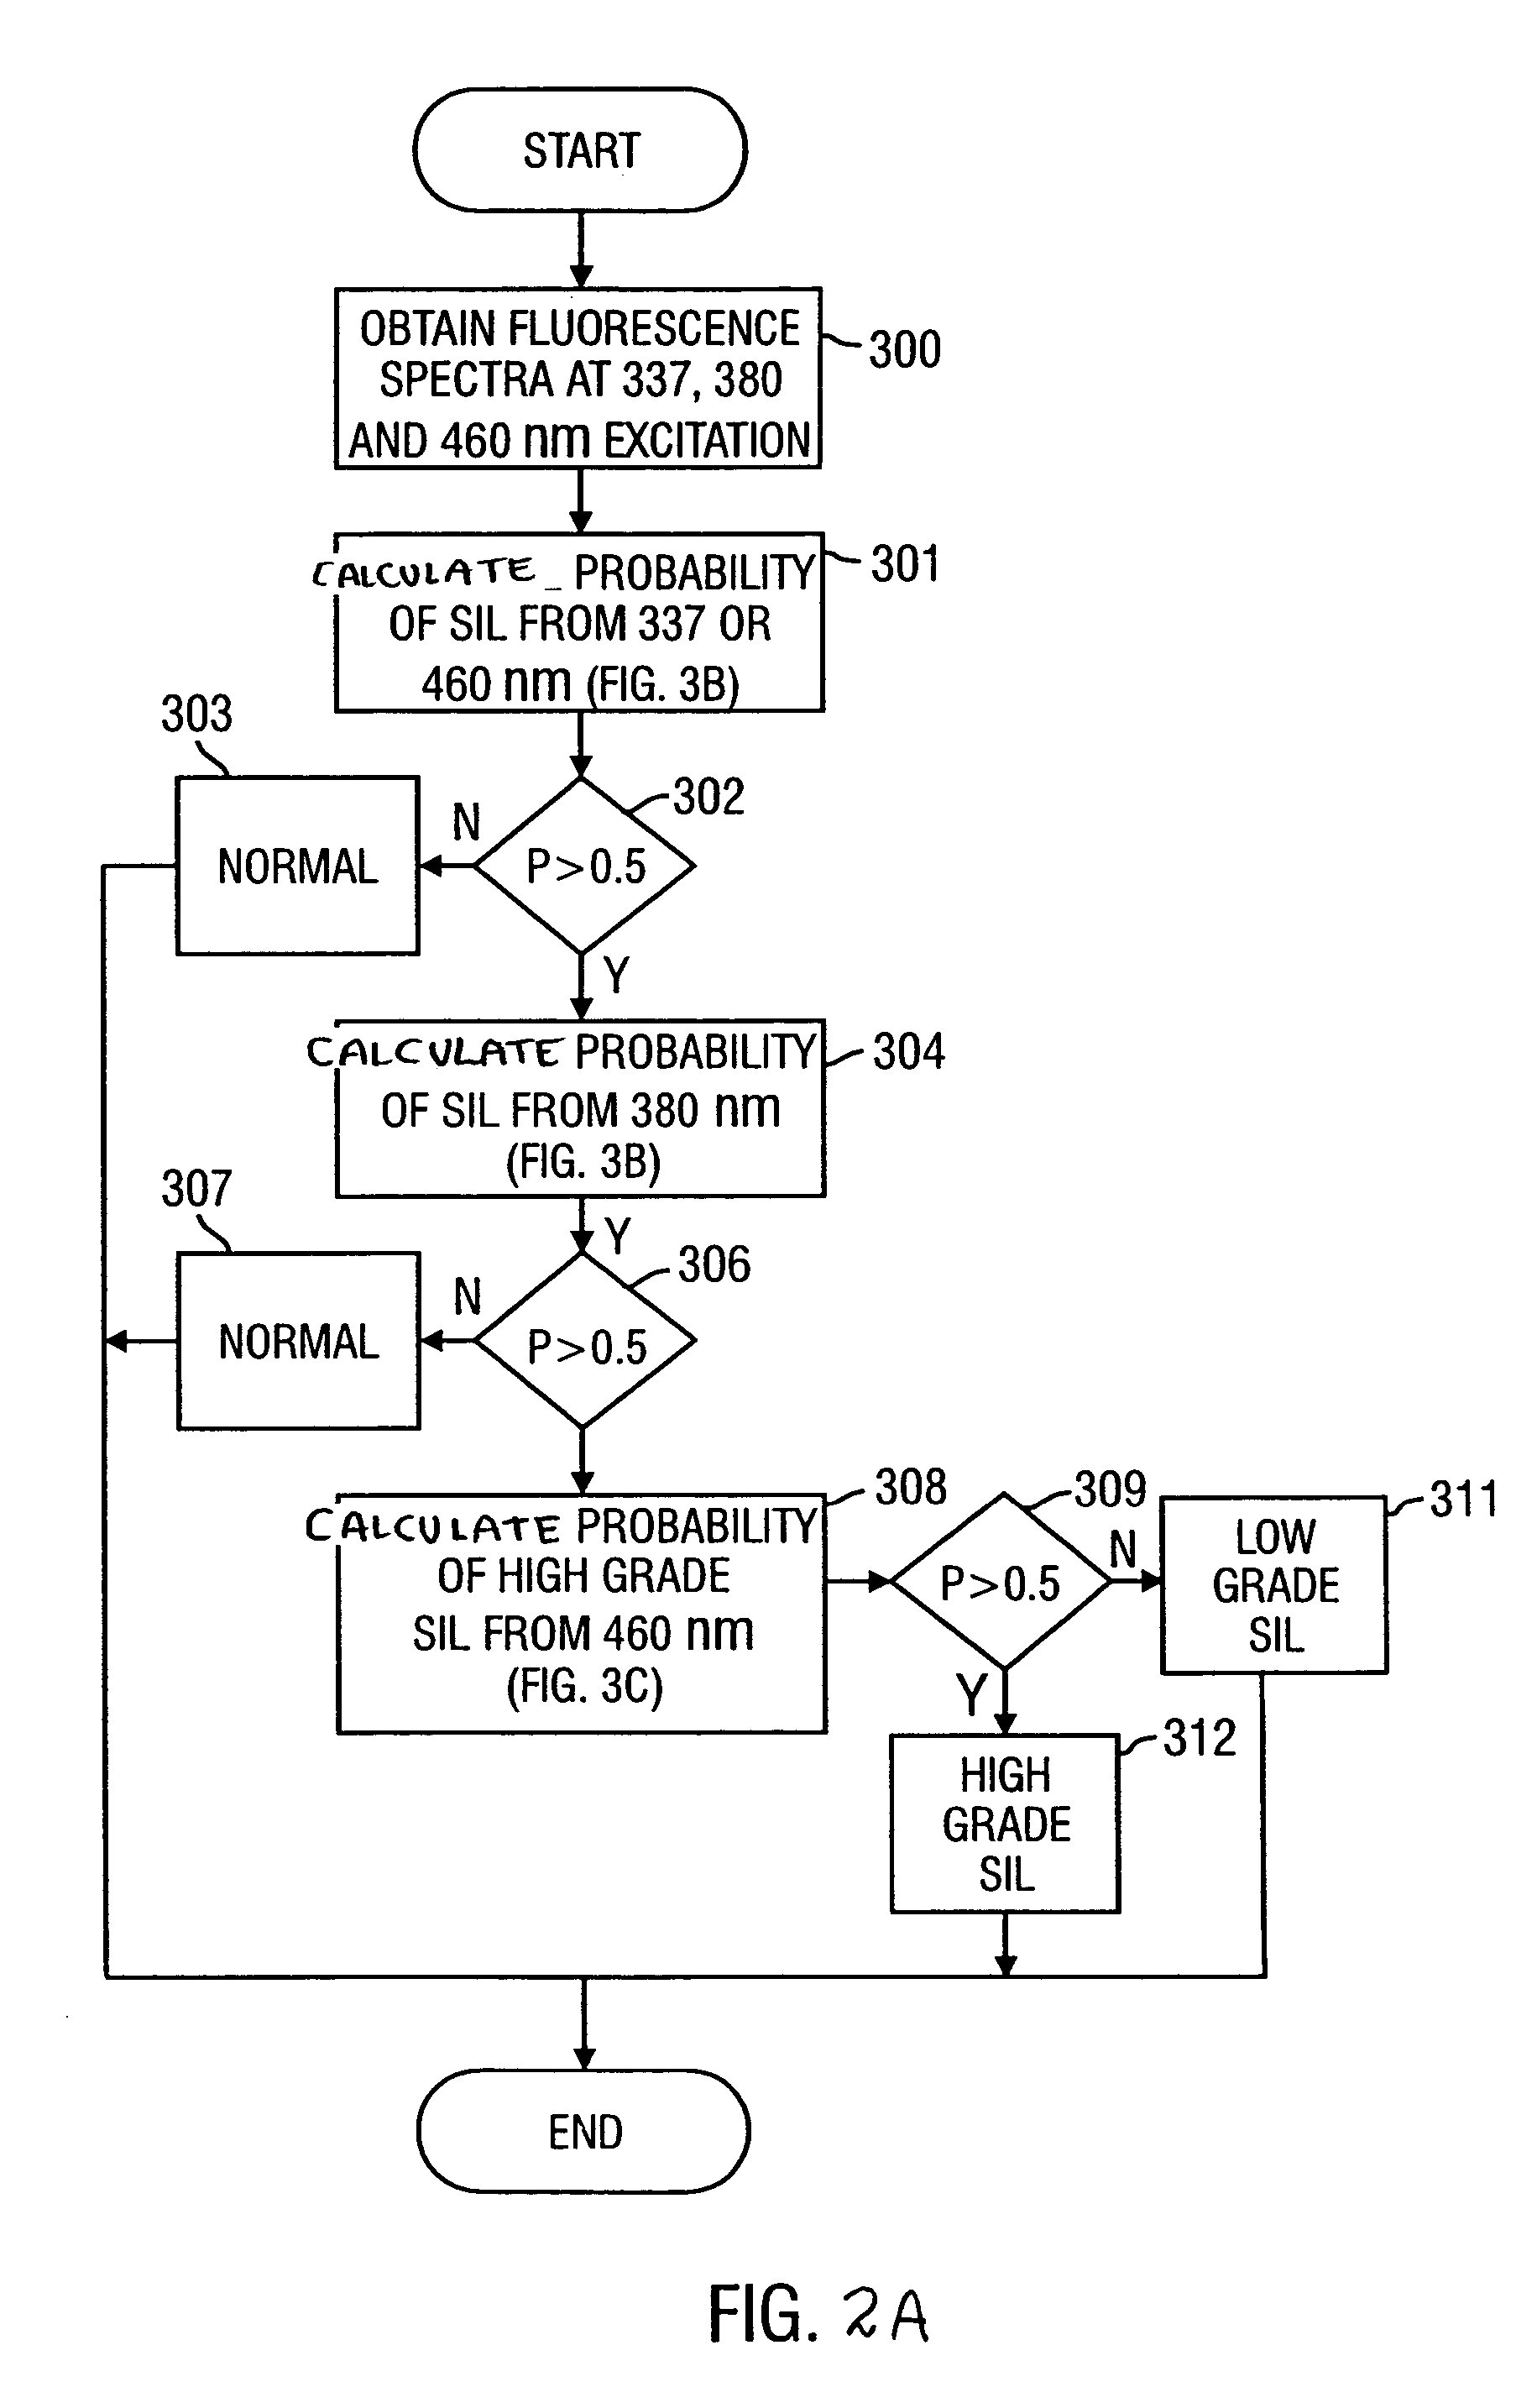
[0111]Thus, a first goal of the analysis in this second example is to evaluate the accuracy of constitutient and composite algorithms which address these limitations. Fluorescence spect...

third example

[0173]A goal of the analysis in this third example is to determine if fluorescence intensities at a reduced number of excitation-emission wavelength pairs can be used to re-develop constituent and composite algorithms that can achieve classification with a minimum decrease in predictive ability. A significant reduction in the number of required fluorescence excitation-emission wavelength pairs could enhance the development of a cost-effective clinical fluorimeter. The accuracy of the constituent and composite algorithms based on the reduced emission variables was compared to the accuracy of those that utilize entire fluorescence emission spectra.

Instrumentation

[0174]The fluorescence emission spectra obtained with the instrumentation of the Second Example were used to demonstrate the method of this Third Example.

Method

[0175]“Reduced-parameter” composite screening and diagnostic algorithms: Component Loadings. A component loading represents the correlation between each principal compo...


PUM


Abstract

Fluorescence spectral data acquired from tissues in vivo or in vitro is processed in accordance with a multivariate statistical method to achieve the ability to probabilistically classify tissue in a diagnostically useful manner, such as by histopathological classification. The apparatus includes a controllable illumination device for emitting electromagnetic radiation selected to cause tissue to produce a fluorescence intensity spectrum. Also included are an optical system for applying the plurality of radiation wavelengths to a tissue sample, and a fluorescence intensity spectrum detecting device for detecting an intensity of fluorescence spectra emitted by the sample as a result of illumination by the controllable illumination device. The system also include a data processor, connected to the detecting device, for analyzing detected fluorescence spectra to calculate a probability that the sample belongs in a particular classification. The data processor analyzes the detected fluorescence spectra using a multivariate statistical method. The five primary steps involved in the multivariate statistical method are (i) preprocessing of spectral data from each patient to account for inter-patient variation, (ii) partitioning of the preprocessed spectral data from all patients into calibration and prediction sets, (iii) dimension reduction of the preprocessed spectra in the calibration set using principal component analysis, (iv) selection of the diagnostically most useful principal components using a two-sided unpaired student's t-test and (v) development of an optimal classification scheme based on logistic discrimination using the diagnostically useful principal component scores of the calibration set as inputs.

Description

RELATED APPLICATIONS[0001]This is a continuation of U.S. patent application Ser. No. 09 / 421,965, filed Oct. 20, 1999, now abandoned, which is a continuation-in-part application of U.S. patent application Ser. No. 08 / 988,840, filed Dec. 11, 1997, which issued Aug. 1, 2000, as U.S. Pat. No. 6,095,982, which is a continuation of U.S. patent application Ser. No. 08 / 403,446, filed Mar. 14, 1995, which issued on Dec. 16, 1997, as U.S. Pat. No. 5,697,373; U.S. patent application Ser. No. 09 / 421,965 is also a continuation-in-part application of U.S. patent application Ser. No. 08 / 666,021, filed Jun. 19, 1996, now abandoned; and U.S. patent application Ser. No. 09 / 421,965 is also a continuation-in-part application of U.S. patent application Ser. No. 08 / 693,471, filed Aug. 2, 1996, now abandoned, which are all hereby incorporated herein by reference in their entirety and serve as a basis for priority for this disclosure.APPENDICES[0002]Appendices A, B, C and D are included herewith. The Appen...

Claims


Application Information

Patent Timeline
Patent Type & Authority Patents(United States)
IPC IPC(8): A61B6/00A61B5/00G01N21/64
CPCA61B5/0071A61B5/0075A61B5/0084A61B5/4331A61B5/7264G01N21/274G01N21/6486G01N2021/6417G01N2021/6419G01N2021/6484Y10S436/813G16H50/20
Inventor RICHARDS-KORTUM, REBECCARAMANUJAM, NIRMALAMAHADEVAN-JANSEN, ANITAFOLLEN, MICHELEUTZINGER, URS
Owner BOARD OF RGT THE UNIV OF TEXAS SYST
Why Eureka
Try Eureka