

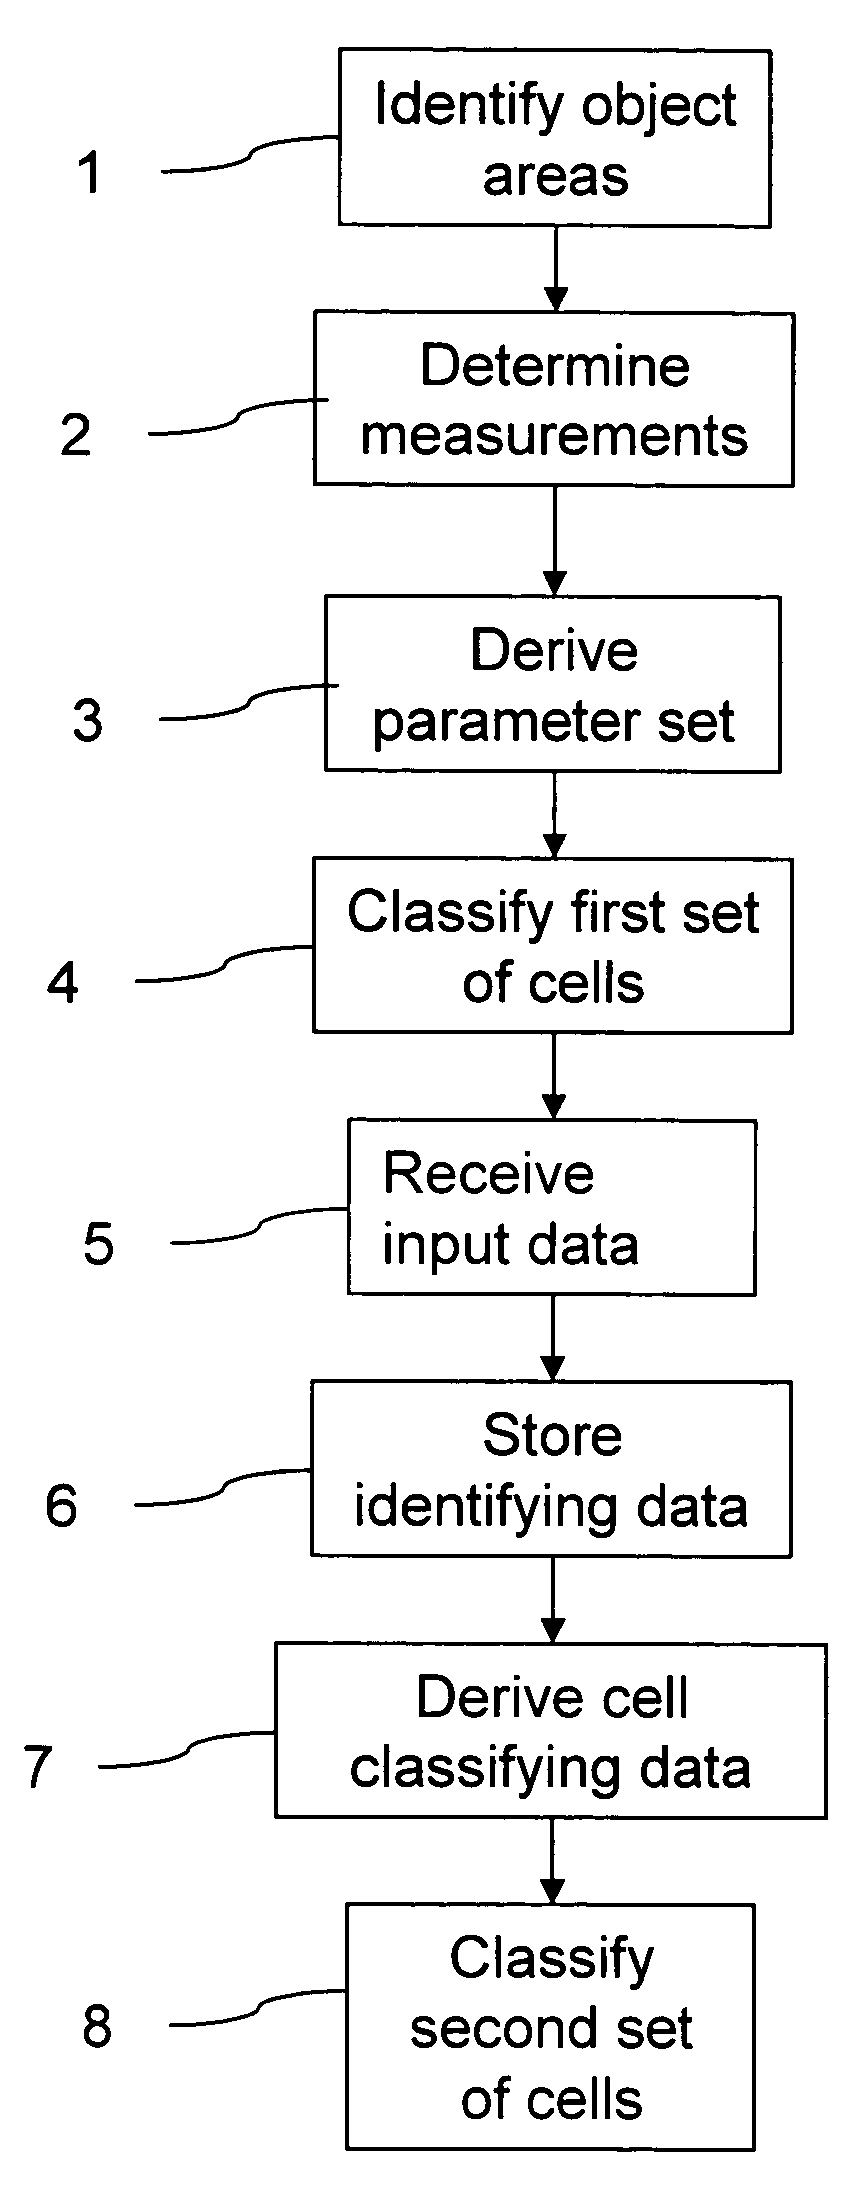
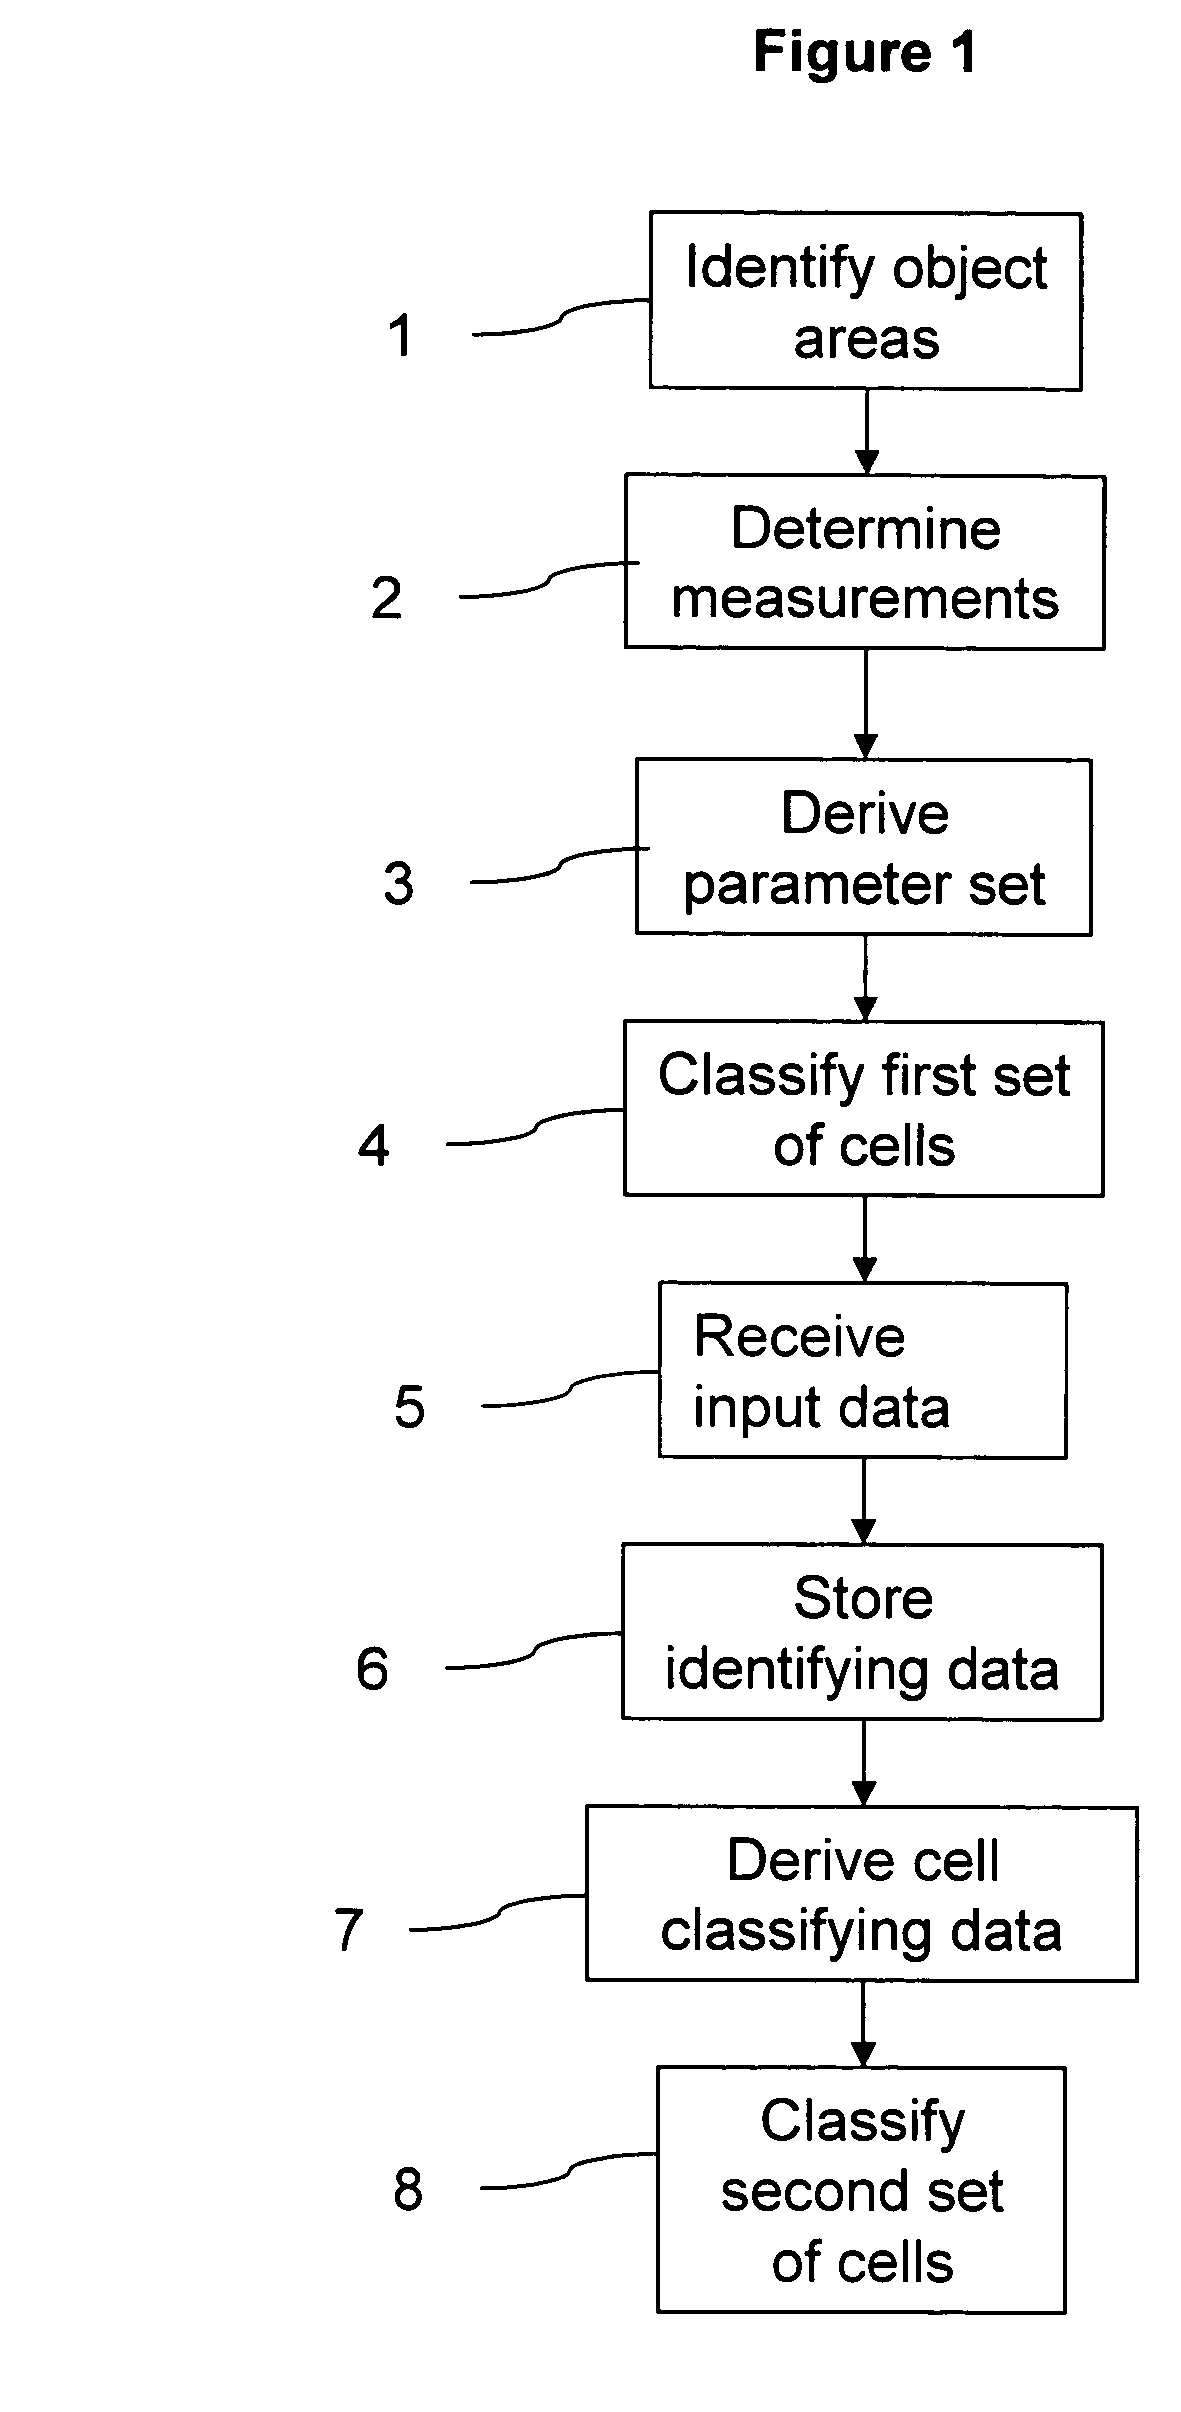
Classification of cells into subpopulations using cell classifying data
a cell and subpopulation technology, applied in the field of cell classification, can solve the problems of obscuring or preventing observation, time-consuming analysis of individual cell responses, and insufficient measurement of cell cycle progression in assays, and achieve the effect of accurate classification of further sets of cells
- Summary
- Abstract
- Description
- Claims
- Application Information
AI Technical Summary
Benefits of technology
Problems solved by technology
Method used
Image

Examples
examples of
PRODUCTION OF STABLE CELL LINES
Example 1
Preparation of DNA Construct
[0167]i) The N-terminal third of the cyclin B1 mRNA (amino acids 1-171), encoding the cyclin B1 destruction box and the NES was amplified with HindIII and BamHI ends using standard PCR techniques and the following primers:
[0168]
(SEQ ID NO: 1)5′- GGGAAGCTTAGGATGGCGCTCCGAGTCACCAGGAAC -3′(SEQ ID NO: 2)5′- GCCGGATCCCACATATTCACTACAAAGGTT -3′.
[0169]ii) The gene for wtGFP was amplified with primers designed to introduce restriction sites that would facilitate construction of fusion proteins. The PCR product was cloned into pTARGET (Promega) according to manufacturer's instructions and mutations (F64L / S175G / E222G) were introduced using the QuikChange site-directed mutagenesis kit (Stratagene). Constructs were verified by automated DNA sequencing. DNA encoding the mutant GFP was then cloned downstream of the cyclin B1 N-terminal region using BamHI and Sa1I restriction sites.
[0170]iii) The cell cycle dependent region of the c...
example 2
Effect of Cell Cycle Blocking Agents on GFP Fluorescence From Cell Cycle Phase Marker Using Transiently Transfected Cells
[0172]U2OS cells (ATCC HTB-96) were cultured in wells of a 96 well microtitre plate. Cells were transfected with a cell cycle reporter construct prepared according to Example 1, comprising a cyclin B1 promoter operably linked to sequences encoding the cyclin B1 D-box, the cyclin B1 CRS, and GFP in a pCORON4004 vector (Amersham Biosciences) using Fugene 6 (Roche) as the transfection agent.
[0173]Following 24 hours of culture, cells were exposed to the specific cell cycle blockers mimosine (blocks at G1 / S phase boundary) or demecolcine (blocks in M phase). Control cells were exposed to culture media alone.
[0174]Cells were incubated for a further 24 hours and then analysed for nuclear GFP expression using a confocal scanning imager with automated image analysis (IN Cell Analysis System, Amersham Biosciences).
[0175]Cells exposed to demecolcine showed increased fluoresc...
example 3
Microinjection of the Construct
[0176]HeLa cells were micro-injected with the construct prepared according to Example 1 and examined by time lapse microscopy. Differential interference contrast (DIC) images were made along with the corresponding fluorescence images. A cell in metaphase showed bright fluorescence in the nucleus. The same cell was imaged similarly at later times in anaphase and late anaphase. The DIC images showed the division of the cell into two daughter cells, the corresponding fluorescence images showed the loss of fluorescence accompanying destruction of the fluorescent construct as the cell cycle progresses.
PUM
| Property | Measurement | Unit |
|---|---|---|
| length | aaaaa | aaaaa |
| length | aaaaa | aaaaa |
| depth resolution | aaaaa | aaaaa |
Abstract
Description
Claims
Application Information