
Method and apparatus for quantitating surface-binding optical resonance profiles

Active Publication Date: 2010-10-26
CYTIVA SWEDEN AB
View PDF15 Cites 2 Cited by
  • Summary
  • Abstract
  • Description
  • Claims
  • Application Information

AI Technical Summary

Benefits of technology

[0055]Accordingly, an object of the present invention is to provide a new mechanism for accurate quantitation of surface-binding optical resonance curves.
[0056]A particular object of the invention is to provide a method for quantitation of surface-binding optical resonance curves that has relatively low computational complexity.
[0057]A further particular object of the present invention is to provide a method for quantitation of surface-binding optical resonance curves that requires a minimal number of scan data points.
[0058]Another particular object of the invention is to provide a mechanism for quantitation of surface-binding optical resonance curves that is less sensitive to shot noise.
[0060]Still another particular object of the invention is to provide a mechanism for quantitation of surface-binding optical resonance curves that provides increased scan speeds.
[0061]Another particular object of the invention is to provide the ability to obtain surface-binding optical resonance results for a sample more quickly than is presently possible.

Problems solved by technology

Disadvantages include that the measurement can be sensitive to the choice of points included in the analysis, potentially leading to distortion of the readings due to noise.
In most cases, however, smoothing offers little or no benefit in well-designed fitting procedures, and can even hurt.
Lowering the baseline will include fewer points in the analysis and may lead to increased noise.
There also may be times when an anomaly appears in the SPR curve, perhaps due to sensor surface fouling.
However, the fundamental disadvantage of the 1st moment technique for SPR is its high sensitivity to intensity or signal baseline shifts (vertical shifts of the SPR curve) due to the inherent asymmetry of SPR resonances.
This method also tends to be sensitive to sensor surface fouling.
This method is susceptible to alterations in the overall shape of the SPR curve and it does not directly determine the minimum point.
It uses very little of the resonance curve data for each determination, and thus has poor noise transfer performance.
This is then similar to method (1), but with poorer noise performance since, again, only a relatively small subset of the data is used.
However, since it only uses a relatively small number of points on the curve, it can be susceptible to the selection of points to be included in the calculation.
This can sometimes lead to occasional anomalies in the analysis results (noise).
This method works fairly well, especially with respect to intensity and baseline shifts, but depends on relatively little data and so exhibits sub-optimal noise transfer performance.
As with any method that actually attempts to locate the minimum of the resonance (as opposed to its overall position), it can be sensitive to noise near the bottom.
In other words, higher order polynomials have excess degrees of freedom that translate into increased noise injection into the shift determination.
In practice, tight data point spacing is required, but the needed angle scan range can be fairly limited.
Poorly implemented, it can exhibit very poor noise performance.
It is essentially equivalent to method (2) (point of specific reflectance / signal) for small shifts, but, unlike method (2), it cannot accommodate larger shifts.
a) The model calculations are very complex and intensive, particularly for the GSPR case.
b) Nonlinear fits themselves are very compute intensive (beyond the necessary theoretical model evaluations embedded therein), and exhibit instabilities that complicate automated operation.
c) In practice, frequent deviations of resonance shapes from the theoretical ideal are observed. Indeed, the data of Zizlsperger et al. show rather poor fits.
As a corollary, the difficulties of ensuring that future oddities in profile shapes that are not modelable by the chosen functional form do not occur.
c) Degraded noise performance due to the extra shape parameters likely needed to represent the full range of observed profiles.

Method used


Image

  • Method and apparatus for quantitating surface-binding optical resonance profiles
  • Method and apparatus for quantitating surface-binding optical resonance profiles
  • Method and apparatus for quantitating surface-binding optical resonance profiles

Examples


Embodiment Construction

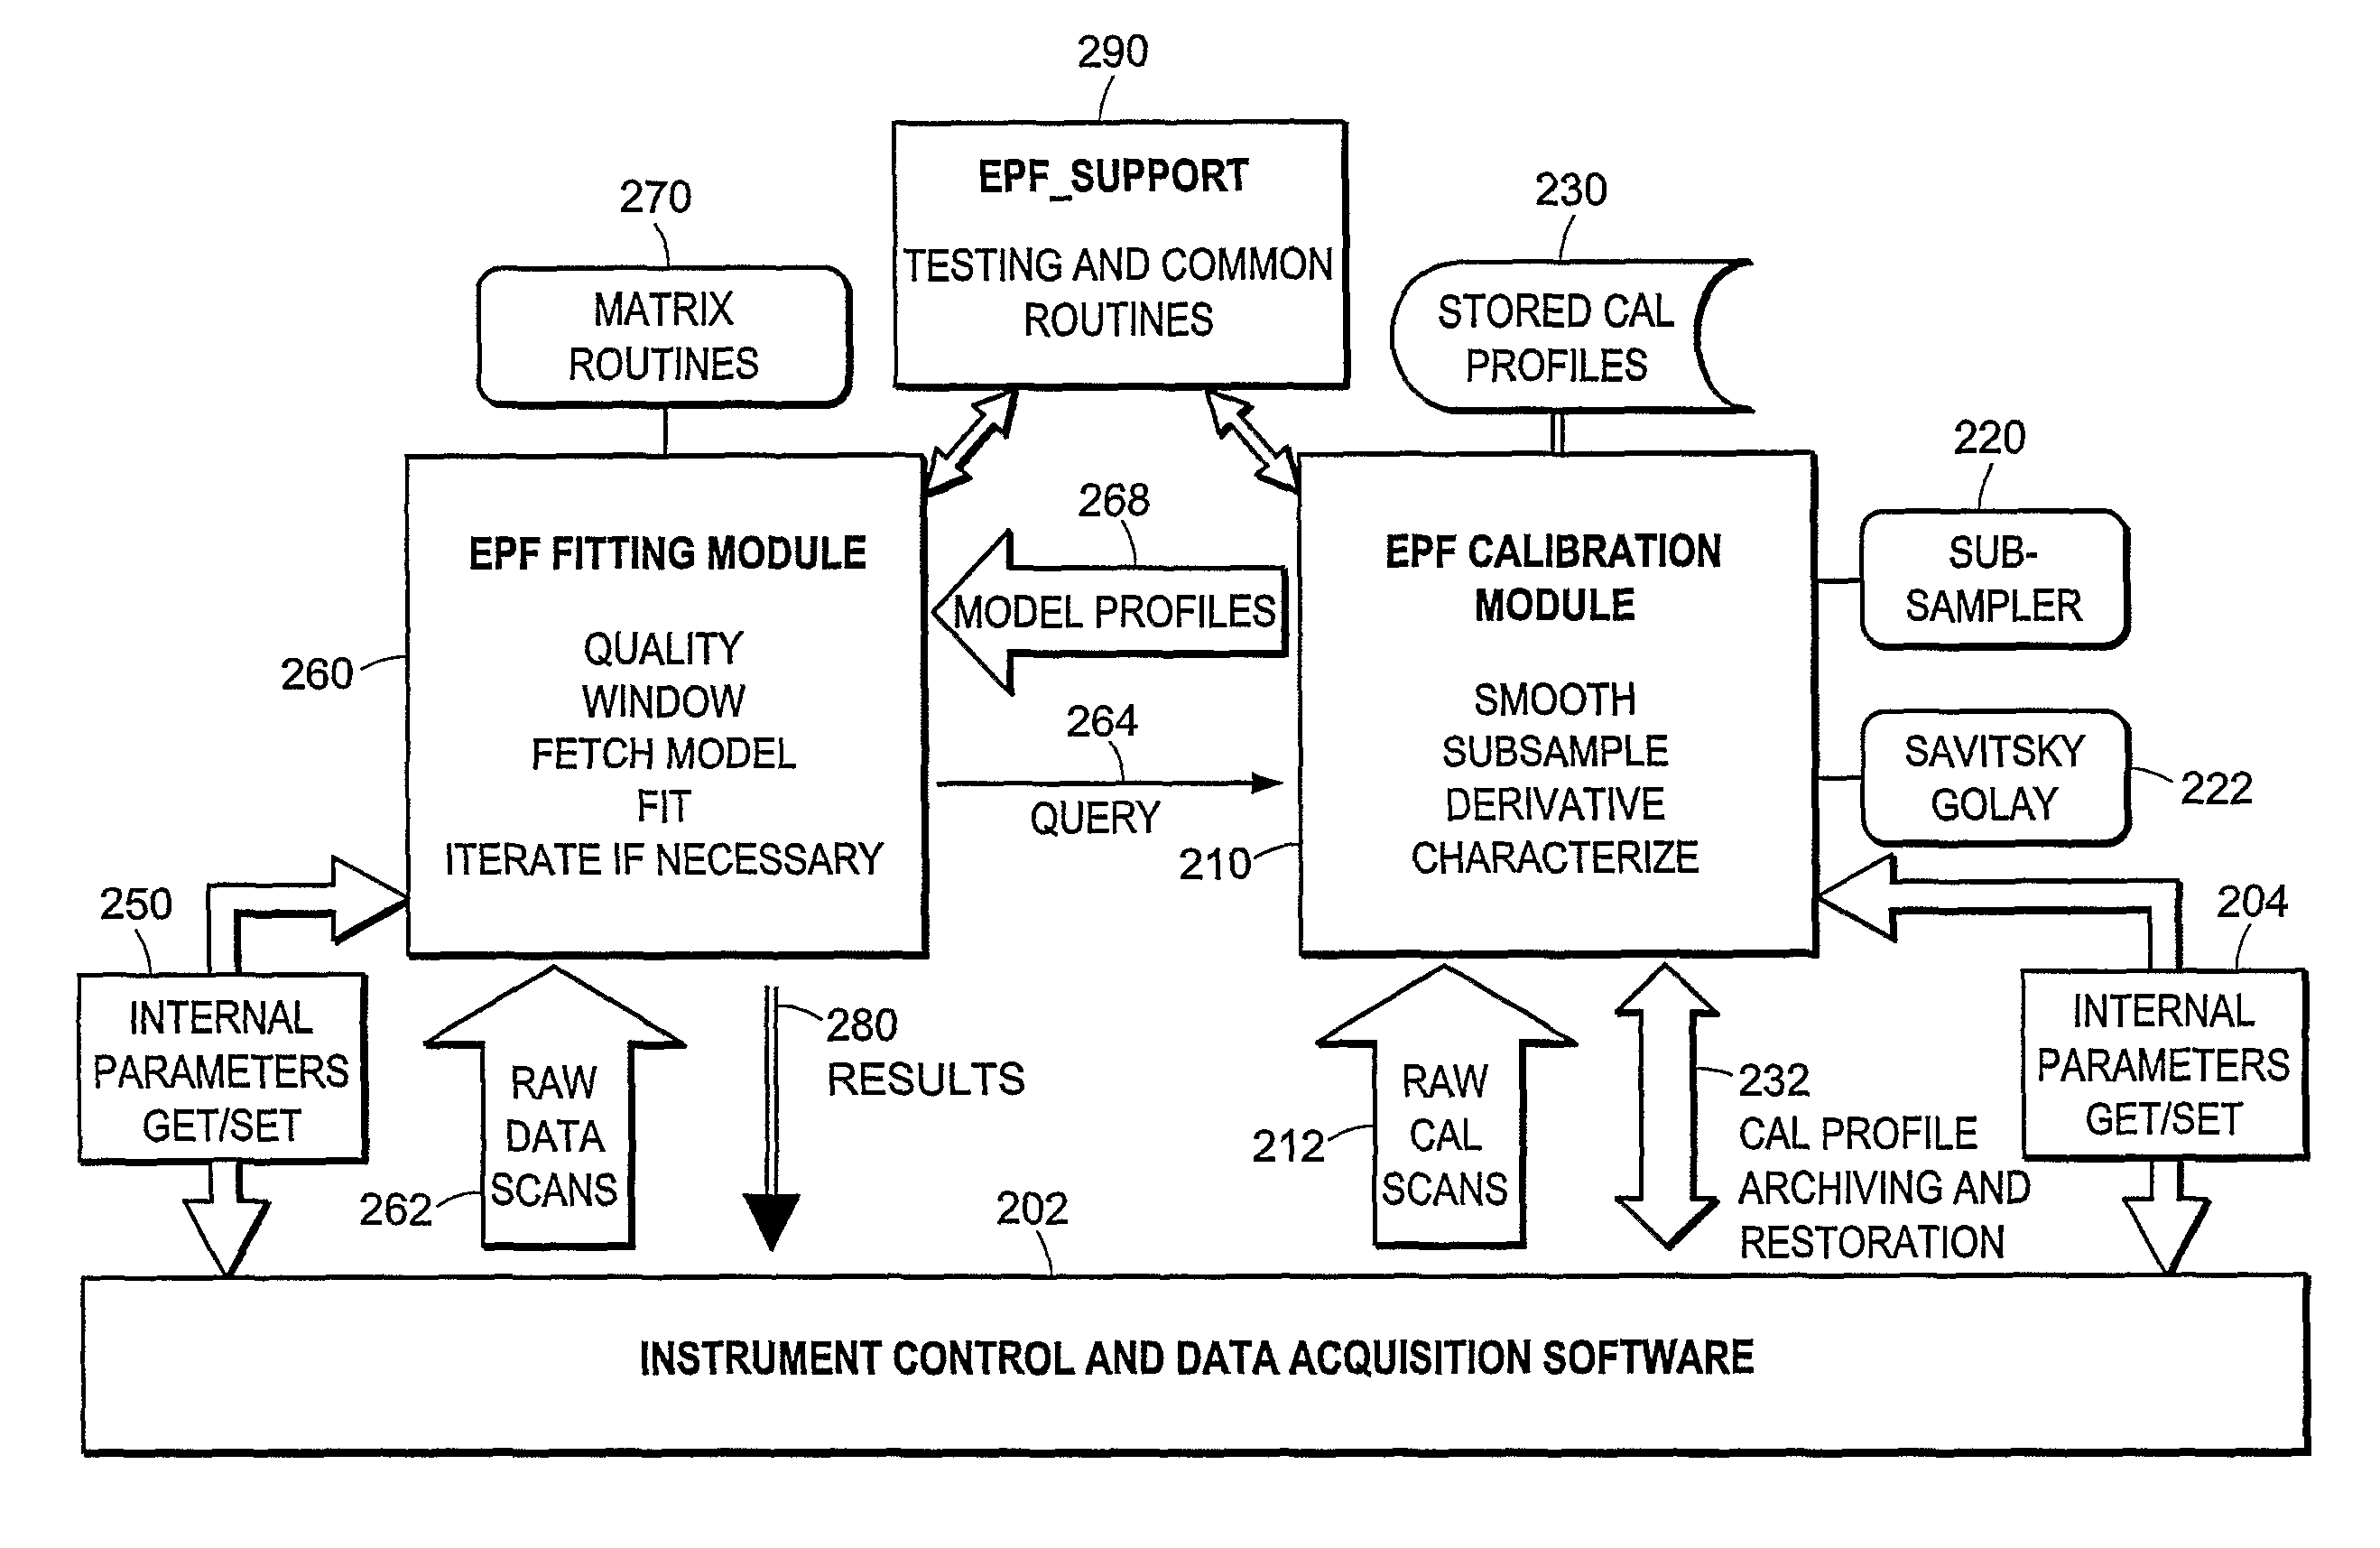
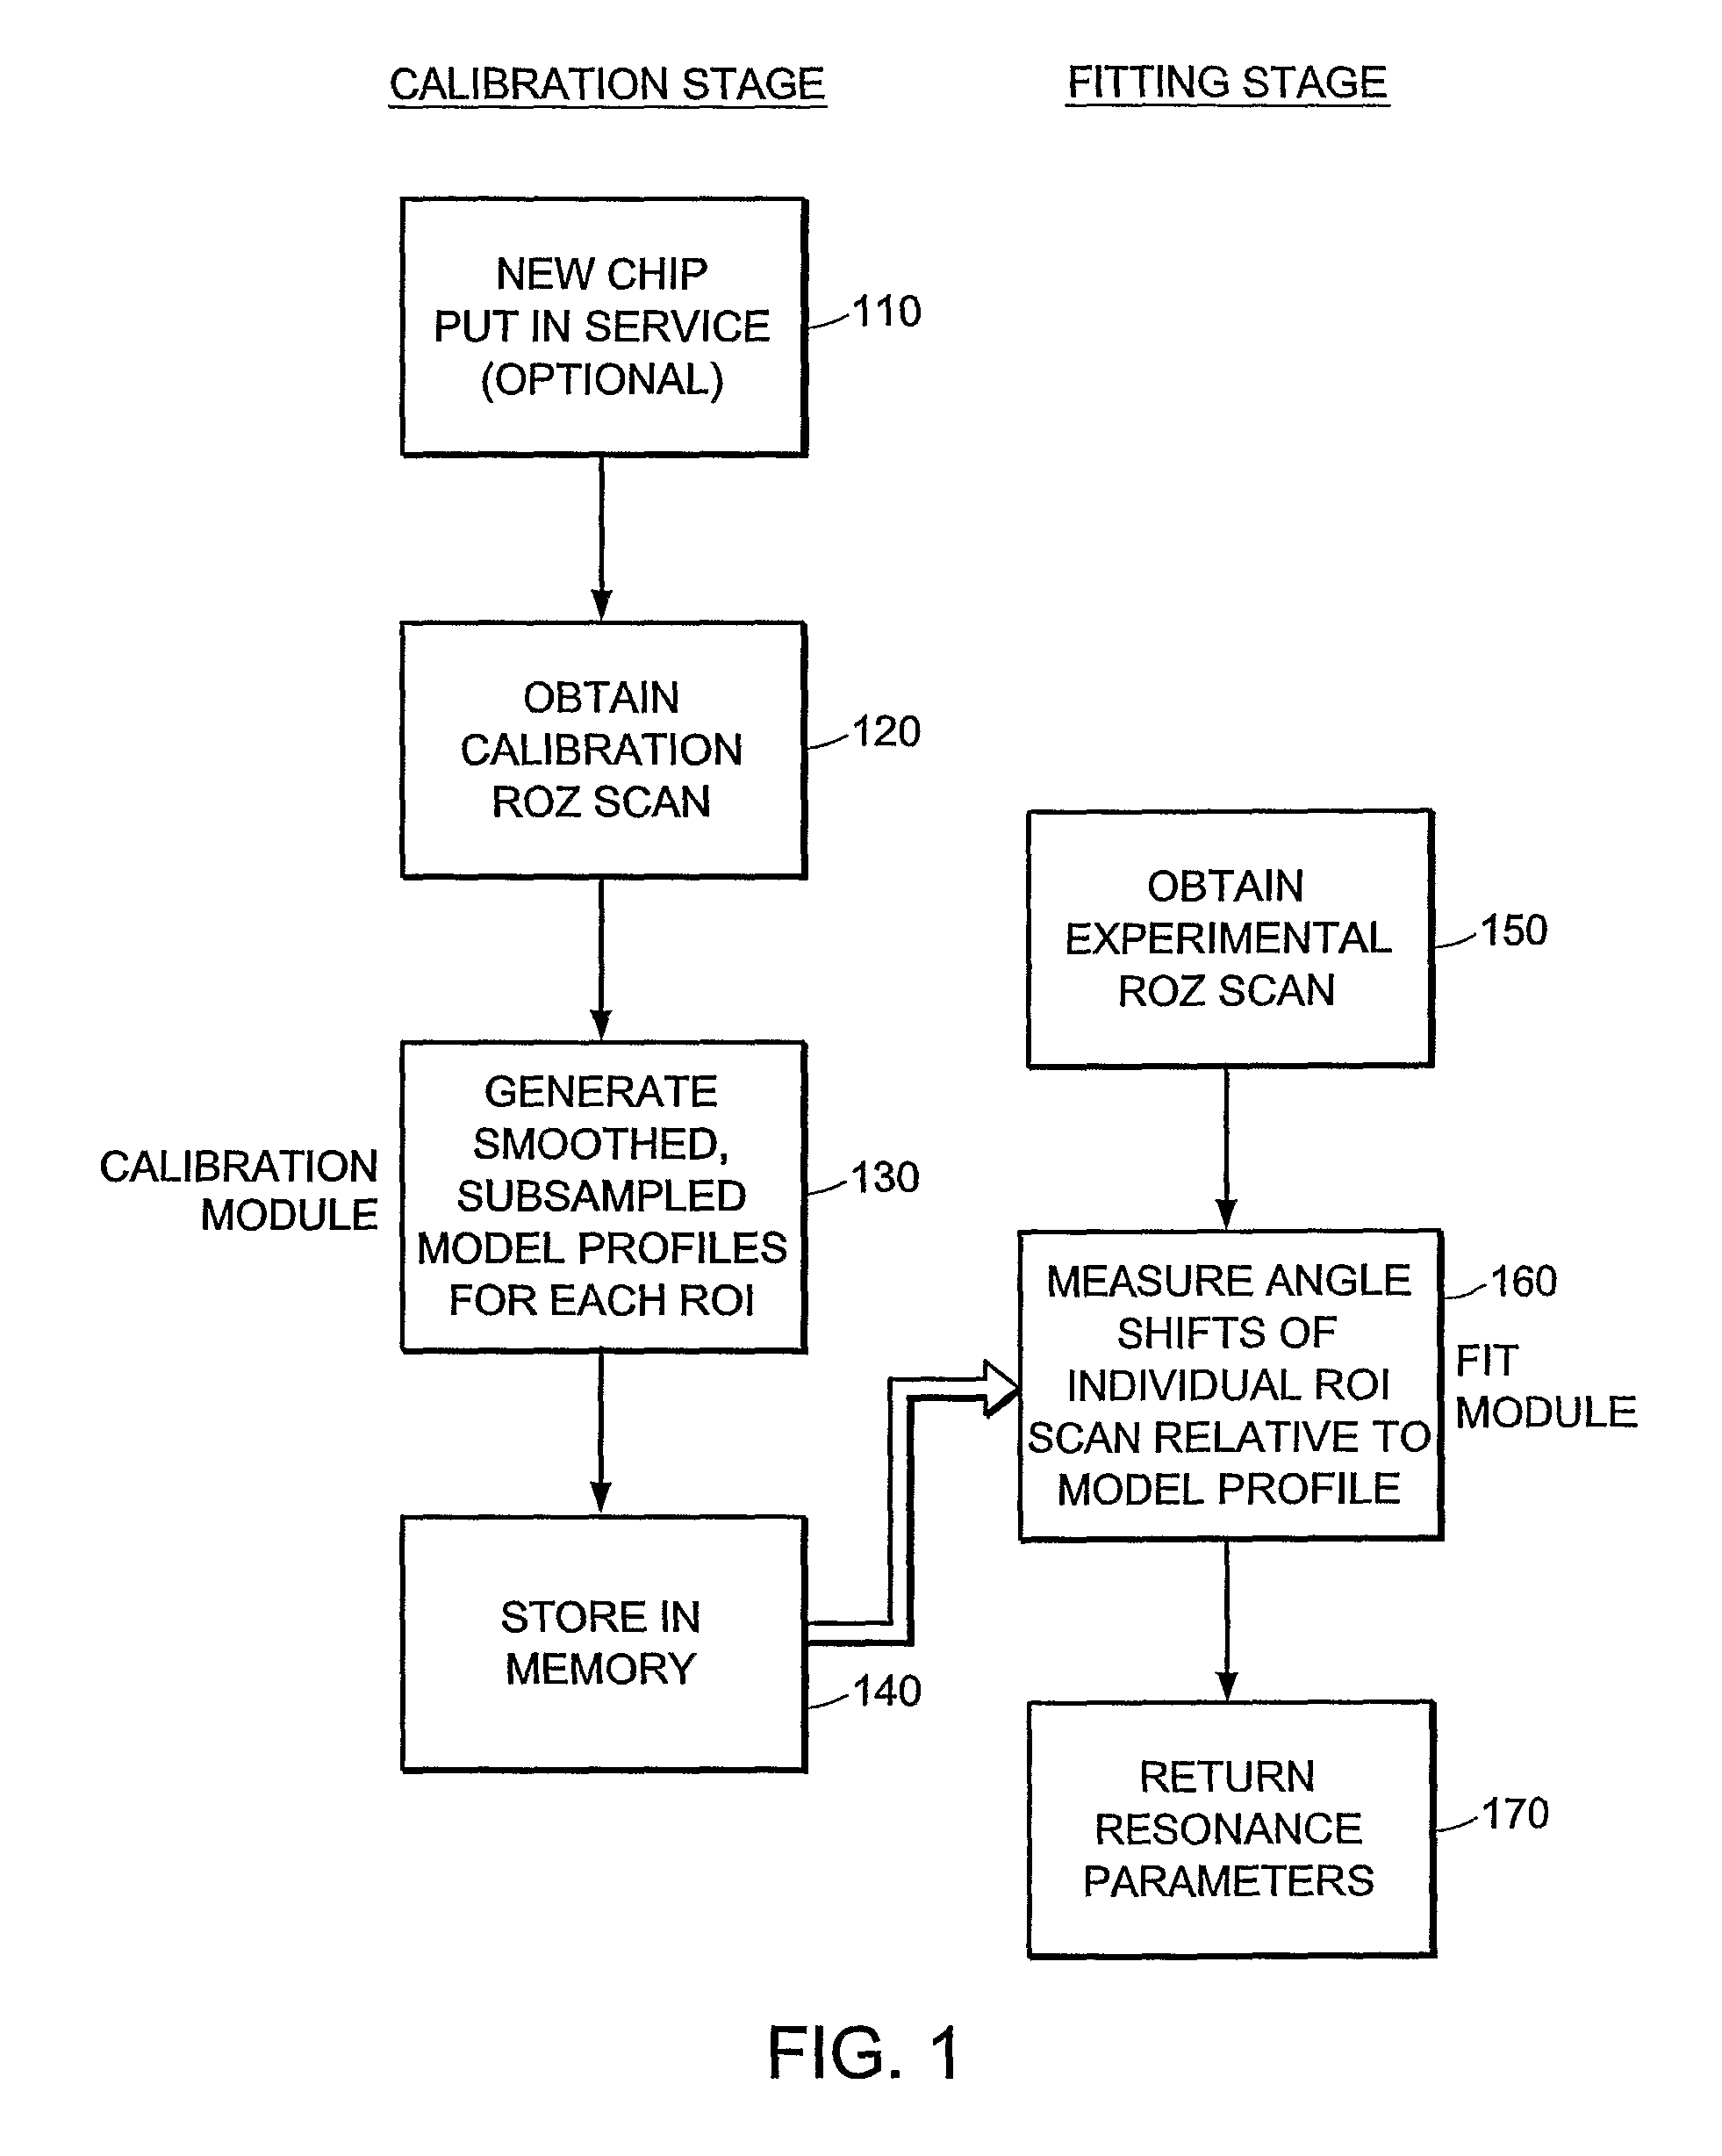
[0087]The current invention utilizes Empirical Profile Fits (EPF) to quantitate surface-binding optical resonance profiles. The EPF peak finding process has two stages, the Calibration stage and the Fit stage. In the Calibration stage, a calibration scan is obtained with relatively fine angle or wavelength spacing over a range sufficient to include full resonance profiles for all regions. Smoothed, subsampled model profiles for each Region of Interest (ROI) are generated, together with first derivative curves and certain diagnostic information. In the Fit stage, individual ROI scans are used for measurement of angle or wavelength shifts relative to the calibration model. The run time scans may be at much coarser angle spacing, may cover entirely different angle ranges than the calibration data, and may have either scan polarity. Resonance shifts, estimated absolute angles or wavelengths, time of resonance minimum, and additional diagnostic and quality information are returned.

[0088]...


PUM


Abstract

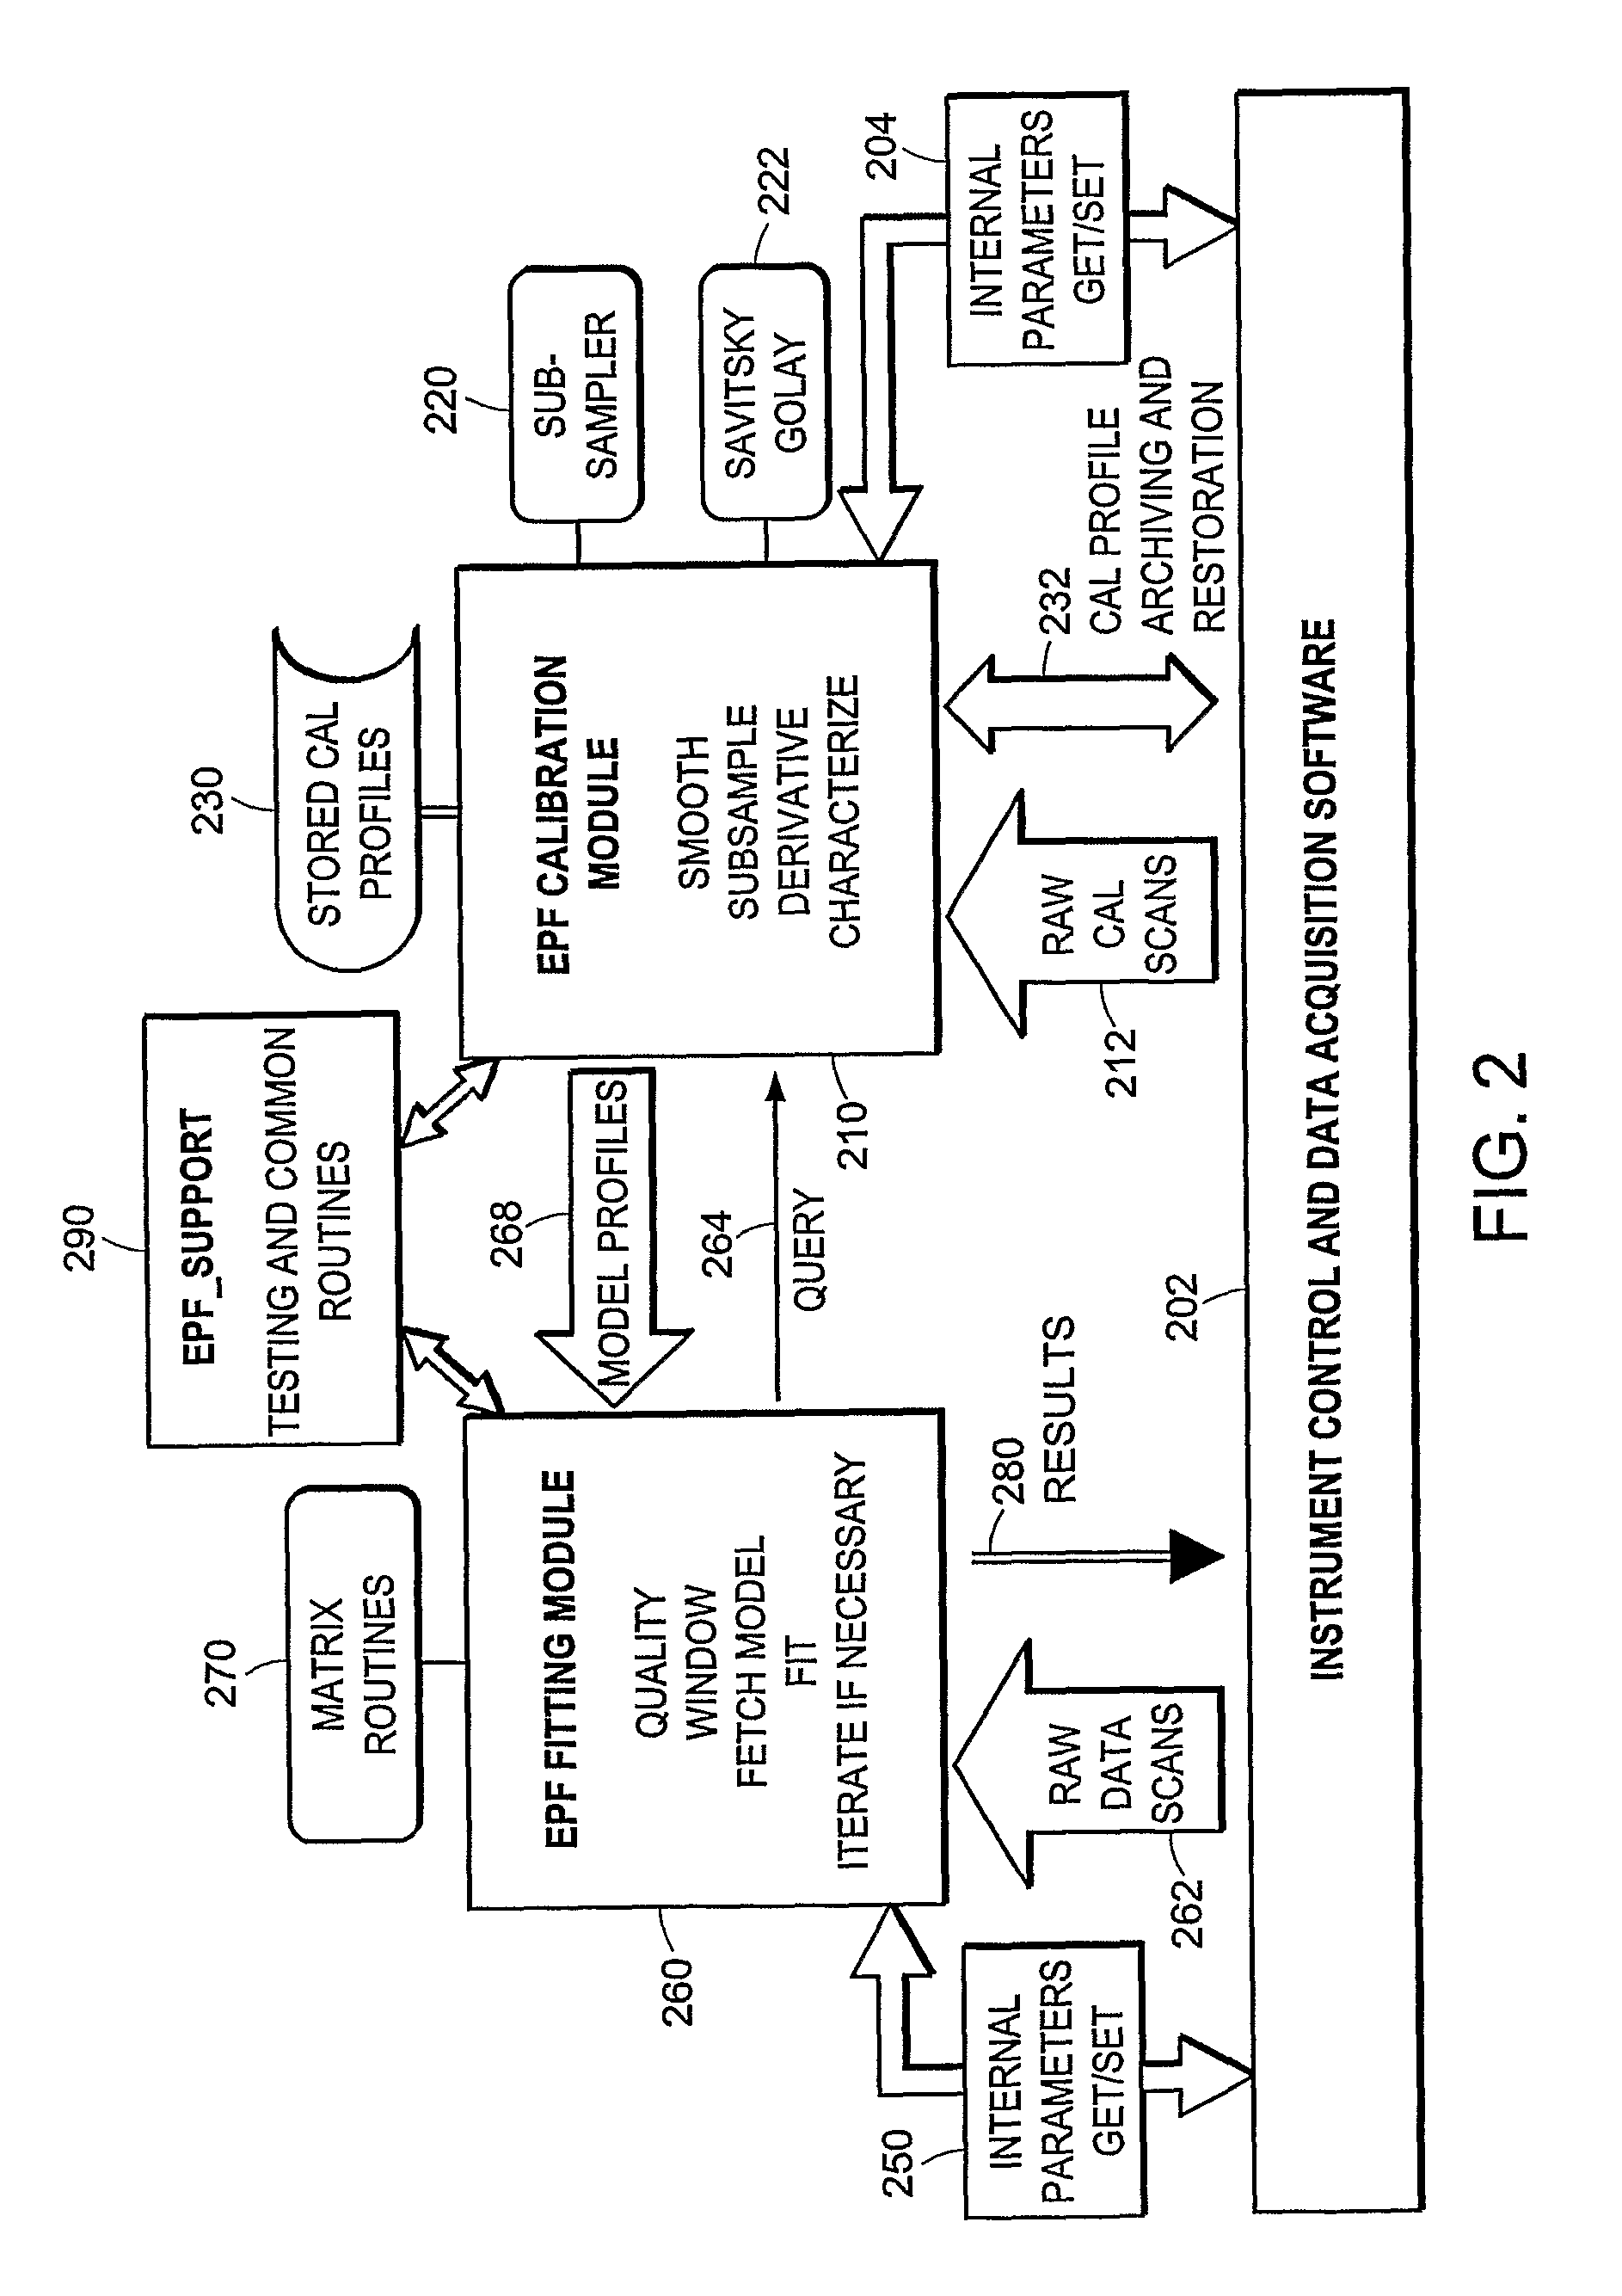
Empirical profile curve fits (260) are used to quantitative the surface optical resonance profiles (268) using two EPF stages of calibration and fit. The calibration surface binding optical resonance scan is obtained with fine angle or wavelength spacing over a range including the full resonance profiles for all regions. The main calibration module (210) together with the first derivative curves and the diagnostic information generates each profile region of interest. The individual ROI scans are used for measurements of the resonance shifts relative to the empirical profile. In a preferred embodiment the instrument control and data acquisition software sets the internal parameters in the EPT calibration module and sends the raw data from a calibration scan to the EPF Calibration module which funnels the data through a sub sampler and a Savitsky-Golan smoothing routine before taking derivatives and characterizing the data to create the empirical profile for the chip (202).

Description

CROSS-REFERENCE TO RELATED APPLICATION[0001]This application claims priority to U.S. Provisional Application 60 / 492,061, filed Aug. 1, 2003.FIELD OF THE INVENTION[0002]This invention relates to data quantitation methods and, in particular, to quantitation of data profiles obtained using optical resonance surface sensors.BACKGROUND OF THE INVENTION[0003]Optical resonance surface sensors are utilized in a number of chemical, pharmacological, and biotechnology research fields, including proteomics and drug discovery. Quantitation of surface-binding optical resonance profiles, such as Surface Plasmon Resonance (SPR) profiles, allows real-time observation and analysis of molecular interactions, providing data uninfluenced by biochemical labeling. As a consequence, optical resonance surface sensors have become widely used for the characterization of biological surfaces and the real-time monitoring of binding events.[0004]At the present time, the most commonly used optical resonance surfac...

Claims


Application Information

Patent Timeline
IPC IPC(8): G01R3/00G01N21/55
CPCG01N21/274G01N21/553G01N21/648
Inventor TRACY, DAVID H.
Owner CYTIVA SWEDEN AB
Learn More