

Method for measuring materials inside human single blood erythrocyte by mocro-fluidic chip chemiluminescence
A microfluidic chip, chemiluminescence technology, applied in chemiluminescence/bioluminescence, analysis by chemical reaction of materials, etc., can solve the problems of inability to perform single-cell analysis, time-consuming, and complicated operation of the analyzer. Simple injection, fast analysis, and high separation efficiency
- Summary
- Abstract
- Description
- Claims
- Application Information
AI Technical Summary
Problems solved by technology
Method used
Image

Examples
Embodiment 1
[0028] (1) Preparation of red blood cell suspension:
[0029] Take 3mL of fresh venous blood samples from normal people in a microcentrifuge tube, then add 3 times the volume of PBS solution, mix it gently, and then centrifuge at 4°C for 10min (1000r / min). Repeat the above steps four times to clarify the upper cell solution, and finally add 3mL PBS solution into the centrifuge tube, and gently blow the cells into a suspension. This suspension is used for single cell analysis.
[0030] (2) Microfluidic chip electrophoretic chemiluminescent detection of mixed standard solutions of hemoglobin (Hb), glutathione (GSH) and cysteine (Cys)
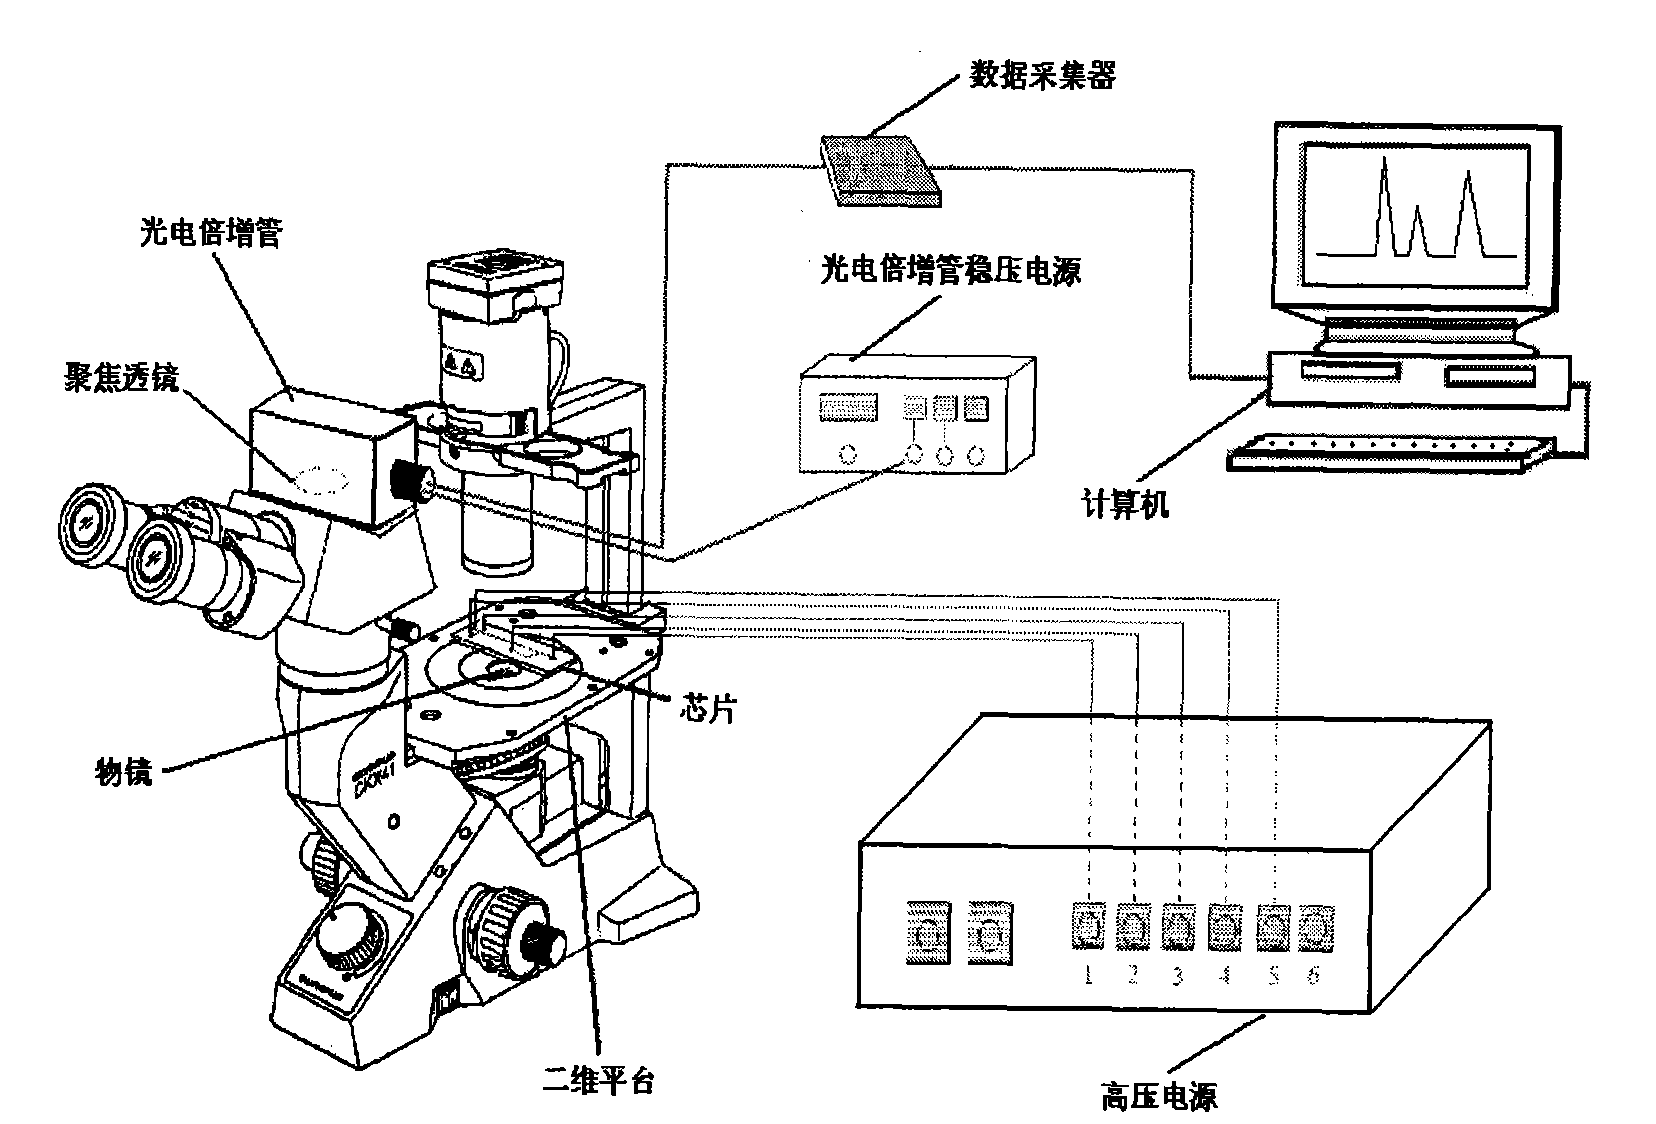
[0031] Before starting, the chip channel was washed with 0.1mol / L sodium hydroxide, ultrapure water and electrophoresis buffer (20mmol / L borax solution containing 3.0mmol / L luminol, pH 10.2) for 10min each, and then observed under a microscope. The chip channel is filled with buffer solution without fine particles and air bubbles. The sample ...
Embodiment 2
[0036] Determination of single red blood cells in patients with benign tumors.
[0037] Fresh venous blood samples from patients with benign tumors were used instead of normal human blood samples, and the separation and detection were carried out according to the steps in Example 1, and the experimental conditions were the same as in Example 1. Figure 5 Shown are: (A) the electrophoresis spectrum of a single red blood cell in a patient with benign thyroid tumor; (B) the electrophoresis spectrum of a single red blood cell in a patient with benign breast tumor; (C) the electrophoresis spectrum of a single red blood cell in a patient with benign gastric tumor. The corresponding peaks in the figure are: peak 1 is glutathione (GSH), and peak 2 is hemoglobin (Hb).
Embodiment 3
[0039] Determination of single red blood cells in patients with malignancy.
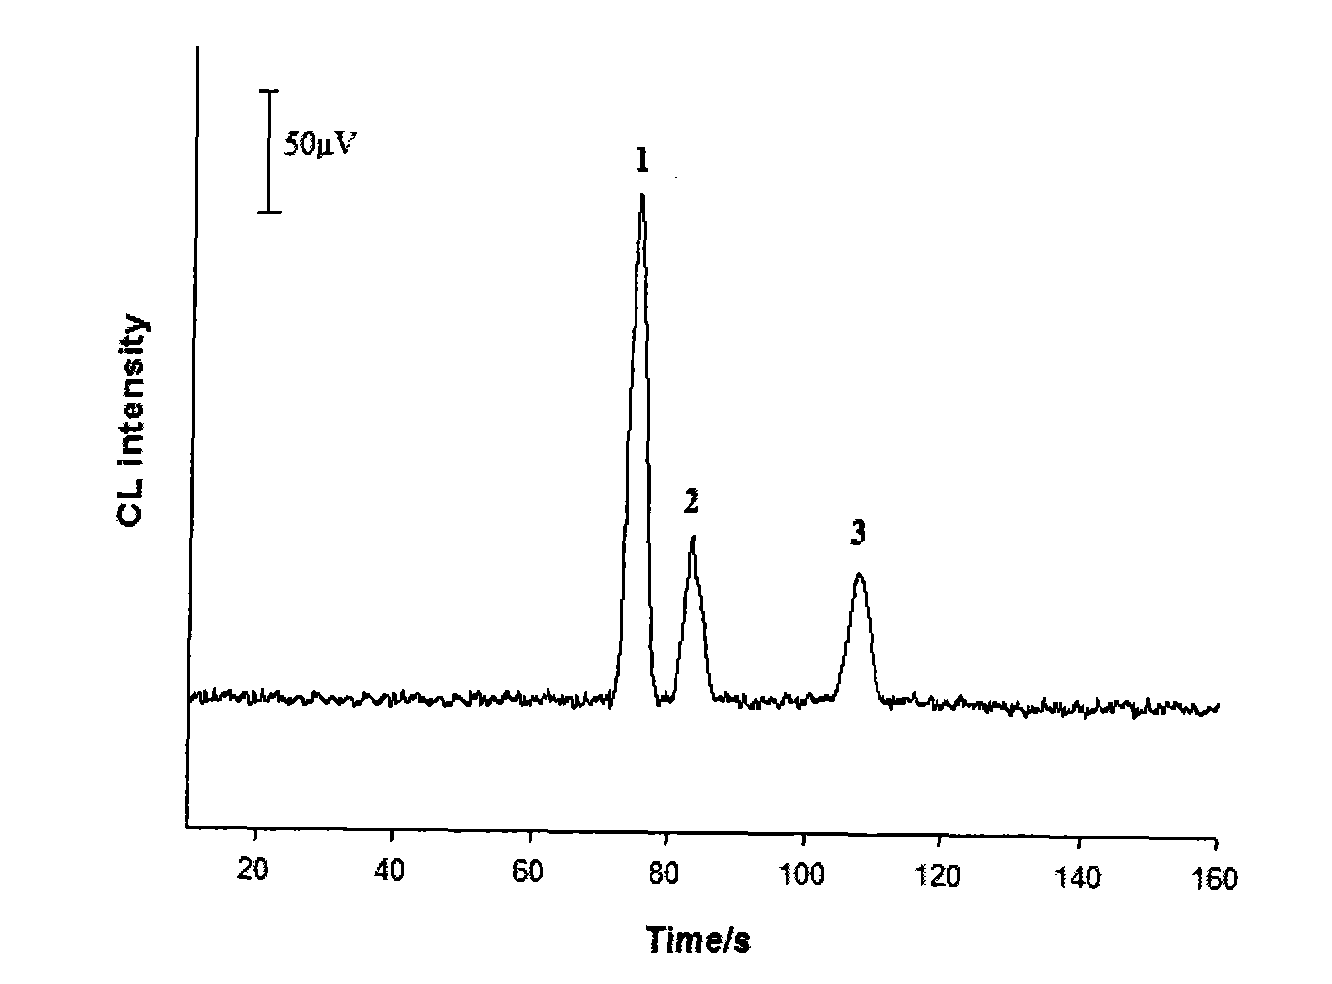
[0040] Fresh venous blood samples from patients with malignant tumors were used instead of normal human blood samples, and the separation and detection were carried out according to the steps in Example 1, and the experimental conditions were the same as in Example 1. Figure 6 Shown are: (A) the electrophoresis spectrum of a single red blood cell of a liver cancer patient; (B) the electrophoresis spectrum of a single red blood cell of a patient with thyroid cancer; (C) the electrophoresis spectrum of a single red blood cell of a breast cancer patient. The corresponding peaks in the figure are: peak 1 is cysteine (Cys), peak 2 is glutathione (GSH), and peak 3 is hemoglobin (Hb).
PUM
 Abstract
Description
Claims
Application Information