

Method for improving differential absorption spectrum on-line monitoring sensitivity
A technology of differential absorption spectroscopy and monitoring sensitivity, applied in absorption/scintillation/reflection spectroscopy, color/spectral characteristic measurement, spectrum investigation, etc., which can solve problems such as effective signal overlap, difficulty in low-pass characteristics, and no basis for selection judgment.
- Summary
- Abstract
- Description
- Claims
- Application Information
AI Technical Summary
Problems solved by technology
Method used
Image

Examples
Embodiment 1
[0059] In the continuous monitoring system of flue gas emissions from fixed pollution sources, the gaseous pollutants in flue gas emissions—sulfur dioxide (SO 2 ), nitrogen dioxide (NO 2 ) and nitric oxide (NO) were monitored online by differential absorption spectroscopy.
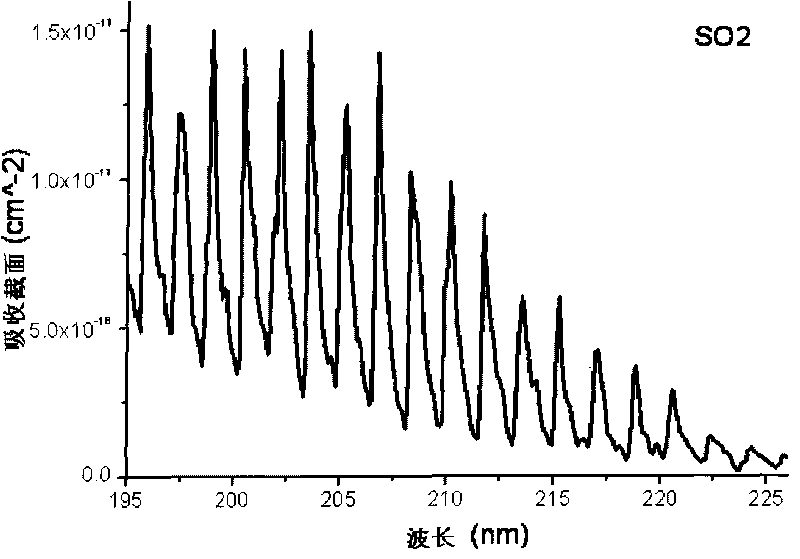
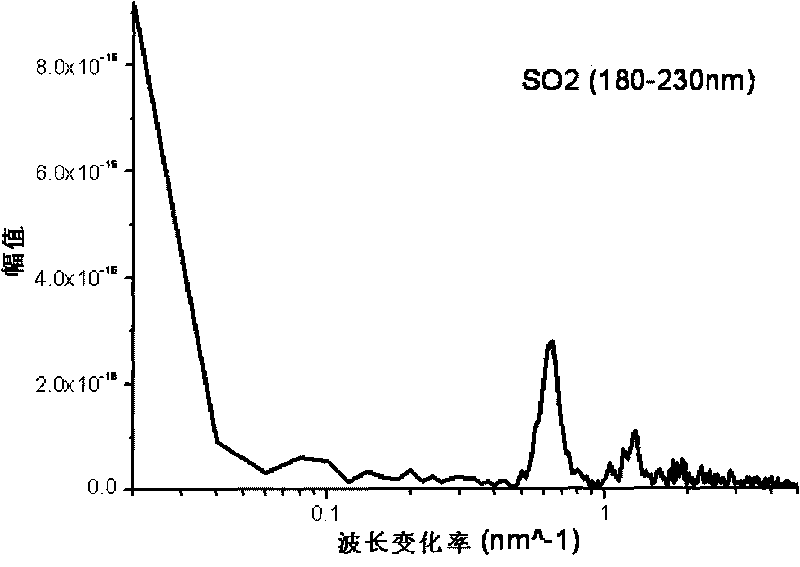
[0060] Such as the standard absorption cross section of sulfur dioxide in the range of 200-250nm (such as figure 1 Shown) do frequency domain transformation, get the frequency domain map as figure 2 shown by figure 2 OK SO 2 The characteristic change interval of the gas is (0.5-0.8cm -1 ).
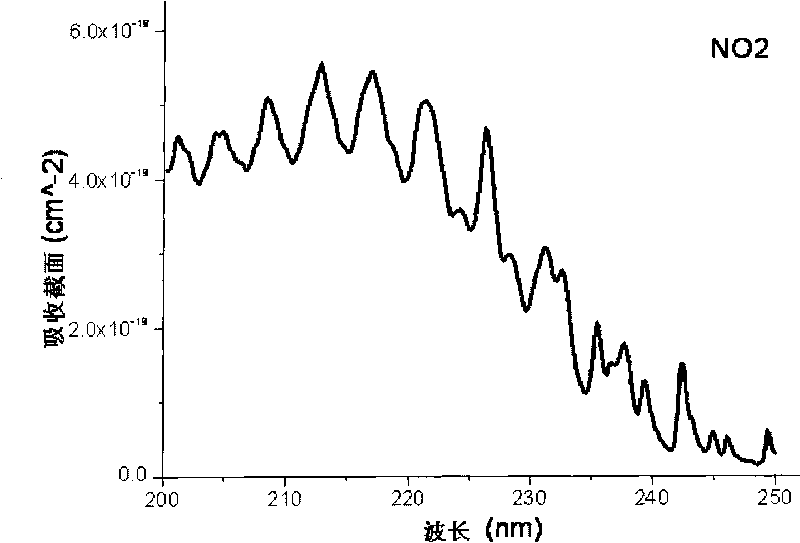
[0061] For example, the standard absorption cross section of nitrogen dioxide in the range of 200-250nm (such as image 3 Shown) do frequency domain transformation, get the frequency domain map as Figure 4 shown by Figure 4 OK NO 2 The characteristic change interval of the gas is (0.16-0.2cm -1 ).
[0062] For example, the standard absorption cross section of nitric oxide in the range of 200-250nm (such ...
Embodiment 2
[0069] As shown in Example 1, in the continuous monitoring system for flue gas emissions from fixed pollution sources, the gaseous pollutants in the flue gas emissions—sulfur dioxide (SO 2 ), nitrogen dioxide (NO 2 ) and nitric oxide (NO) were monitored online by differential absorption spectroscopy.
[0070] For example, the standard absorption cross sections of sulfur dioxide, nitrogen dioxide, and nitrogen monoxide in the range of 200-250nm (respectively as figure 1 , 3 and 5) do frequency domain transformation to obtain frequency domain diagrams as figure 2 , 4 As shown in and 6, it can be determined that the total characteristic changes of the three gases of sulfur dioxide, nitrogen dioxide and nitrogen monoxide are two intervals (0.07-0.3cm -1 ) and (0.6-0.7cm -1 ), so the comb filter can be used to analyze the spectrum Figure 10 Carry out data processing, and the SO can be calculated by formula (8) 2 Concentration measured as SO 2 is 422ppm and NO is 205ppm. ...
Embodiment 3
[0072] In the air quality monitoring system, the trace gas benzene (C 6 h 6 ), formaldehyde (HCHO), ozone (O 3 ), sulfur dioxide (SO 2 ) and so on for long optical path measurements.
[0073] Perform frequency domain transformation on the standard absorption cross section of benzene in the range of 239-270nm, and determine the characteristic change of benzene from the frequency domain diagram to be 0.16-5cm -1 .
[0074] Perform frequency domain transformation on the standard absorption cross section of formaldehyde in the range of 250-356nm, and determine the characteristic change of formaldehyde from the frequency domain diagram to be 0.07-0.2cm -1 .
[0075] Perform frequency domain transformation on the standard absorption cross section of ozone in the range of 240-300nm, and determine the characteristic change of ozone from the frequency domain diagram to be 0.26-0.6cm -1 .
[0076] Perform frequency domain transformation on the standard absorption cross section of...
PUM
 Abstract
Description
Claims
Application Information