Near-infrared spectral detection method for residual content of solvent in polyurethane elastic fiber filaments
A technology of near-infrared spectroscopy and detection methods, which is applied in the field of industrial analysis, can solve problems that have not been reported, and achieve the effects of high sensitivity, good correlation, and shortened detection cycle
- Summary
- Abstract
- Description
- Claims
- Application Information
AI Technical Summary
Problems solved by technology
Method used
Image
Examples
Embodiment 1
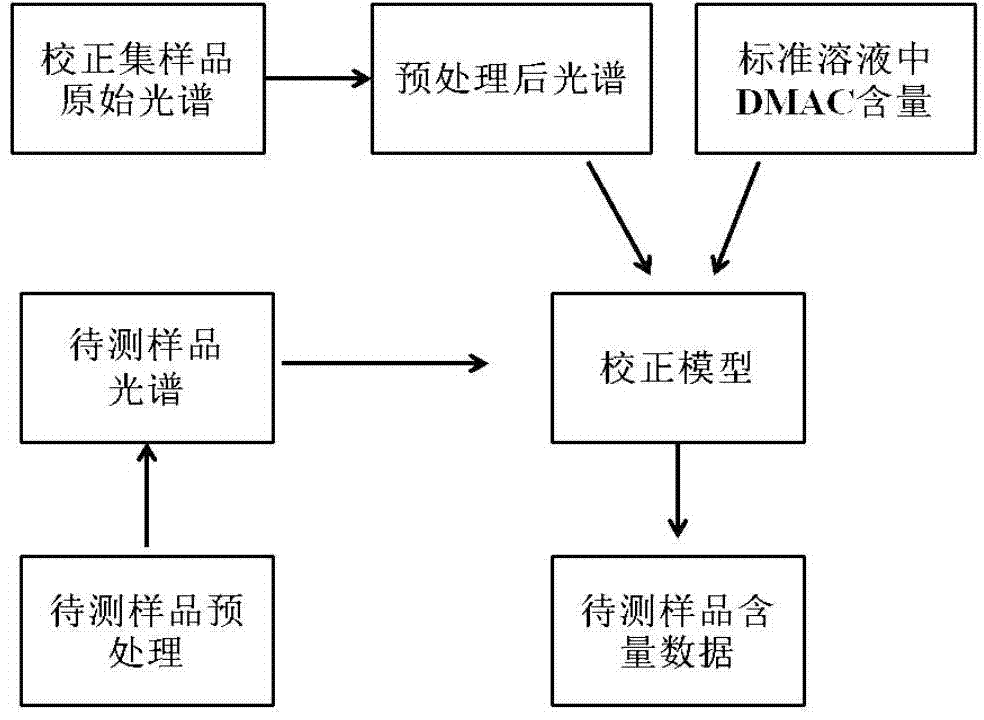
[0035] The establishment and application process of the near-infrared spectrum model described in the present invention are as attached figure 1 ,details as follows:
[0036] Instrument conditions and processing of spandex prepolymer samples:
[0037]Instrument: The near-infrared spectrum was collected by MB3600 Fourier transform near-infrared spectrometer of ABB company in Switzerland, which is equipped with Horizon MB analysis software, quartz liquid cell and InGaAs detector. The spectra of each sample are obtained by averaging 32 scans at a resolution of 4. The scanning range is 12000~4000cm -1 .
[0038] Sample: The sample used in the experiment is the spandex yarn collected during the spandex production process, and the extract is extracted by acetone for detection.
Embodiment 2
[0040] Sample near-infrared spectrum measurement:
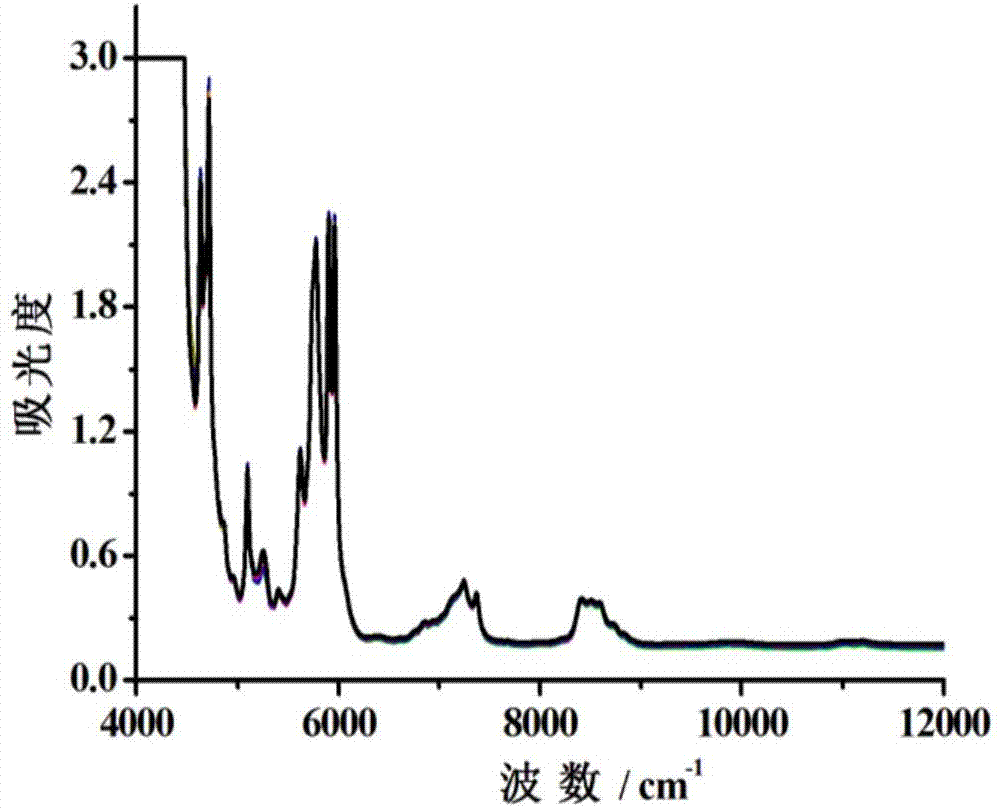
[0041] In this experiment, a quartz liquid absorption cell was used. Pour different concentrations of DMAC acetone standard solutions into the liquid absorption cell, keep the temperature at 25±0.5°C, put them into the detection cell, and collect the spectrum of the sample. The same sample was scanned 32 times, according to After averaging, the final spectrogram is obtained, as shown in the attached figure 2 .
Embodiment 3
[0043] predict:
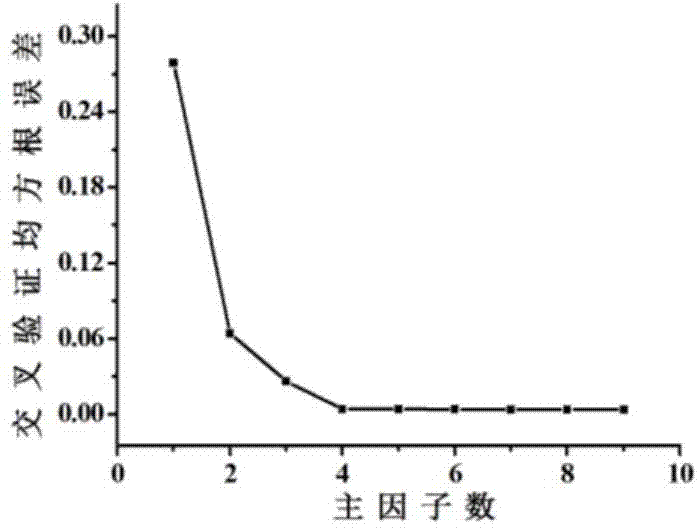
[0044] figure 2 Shown are the raw data of the spectrum, normalized and normalized, confirming 4484-5095cm -1 、5579-6167cm -1 、8212-9014cm -1 、10652-11448cm -1 The four spectral detection ranges are used as modeling bands, and the quantitative calibration model is established by segmenting using the PLS method. In order to avoid the phenomenon of "overfitting", the leave-one-out cross-validation method is used to reasonably select the number of principal factors. The number of principal factors obtained by cross-validation of the two-stage DMAC content is shown in Figure 3, and the optimal number of principal factors is 4 (0- 1.7878%, see Figure 3(a)), 5 (1.7878%-9.4362%, see Figure 3(b)).
PUM
 Abstract
Description
Claims
Application Information
 - R&D
- Intellectual Property
- Life Sciences
- Materials
- Tech Scout
- Unparalleled Data Quality
- Higher Quality Content
- 60% Fewer Hallucinations
Browse by: Latest US Patents, China's latest patents, Technical Efficacy Thesaurus, Application Domain, Technology Topic, Popular Technical Reports.
© 2025 PatSnap. All rights reserved.Legal|Privacy policy|Modern Slavery Act Transparency Statement|Sitemap|About US| Contact US: help@patsnap.com


