Method for rapidly detecting fluorinions in environment
A technology for detecting environment and fluoride ions, applied in the field of analytical chemistry, can solve the problems of low sensitivity, high cost of fluoride ion nuclear magnetic resonance, limited application and development, etc., and achieve the effect of simple operation, rapid and highly selective detection, and good stability.
- Summary
- Abstract
- Description
- Claims
- Application Information
AI Technical Summary
Problems solved by technology
Method used
Image
Examples
Embodiment 1
[0036] Preparation of colorimetric probes:
[0037]
[0038] Dissolve 185mg (1mmol) of 2-amino-6-chlorobenzothiazole, 232mg (1.2-1.5mmol) of 4-(diethylamino) salicylaldehyde and 3 drops of acetic acid in 50mL of absolute ethanol, and heat to reflux for 10 reactions After 1 hour, the crude product was obtained by filtration under reduced pressure, and then recrystallized with absolute ethanol to obtain a light yellow pure product with a yield of 91%.
[0039] 1 HNMR (400MHz, CDCl 3 ):12.64(s,1H),8.93(s,1H),7.79-7.75(m,2H),7.40-7.37(dd,J 1 =8.4Hz,J 2 =2Hz, 1H), 7.26-7.24(d, J=8.4Hz, 1H), 6.33-6.19(dd, J 1 =9.2Hz,J 2 =2.4Hz, 1H), 6.184(s, 1H), 3.47-3.41(q, J=7.2Hz, 4H), 1.26-1.22(t, J=7.2Hz, 6H); 13 CNMR (101MHz, CDCl 3 ): 136.22, 129.91, 127.07, 122.66, 121.15, 108.78, 105.64, 97.46, 45.01, 12.73; ESI-MS calculated value: 359.9, measured value: 359.9.
Embodiment 2
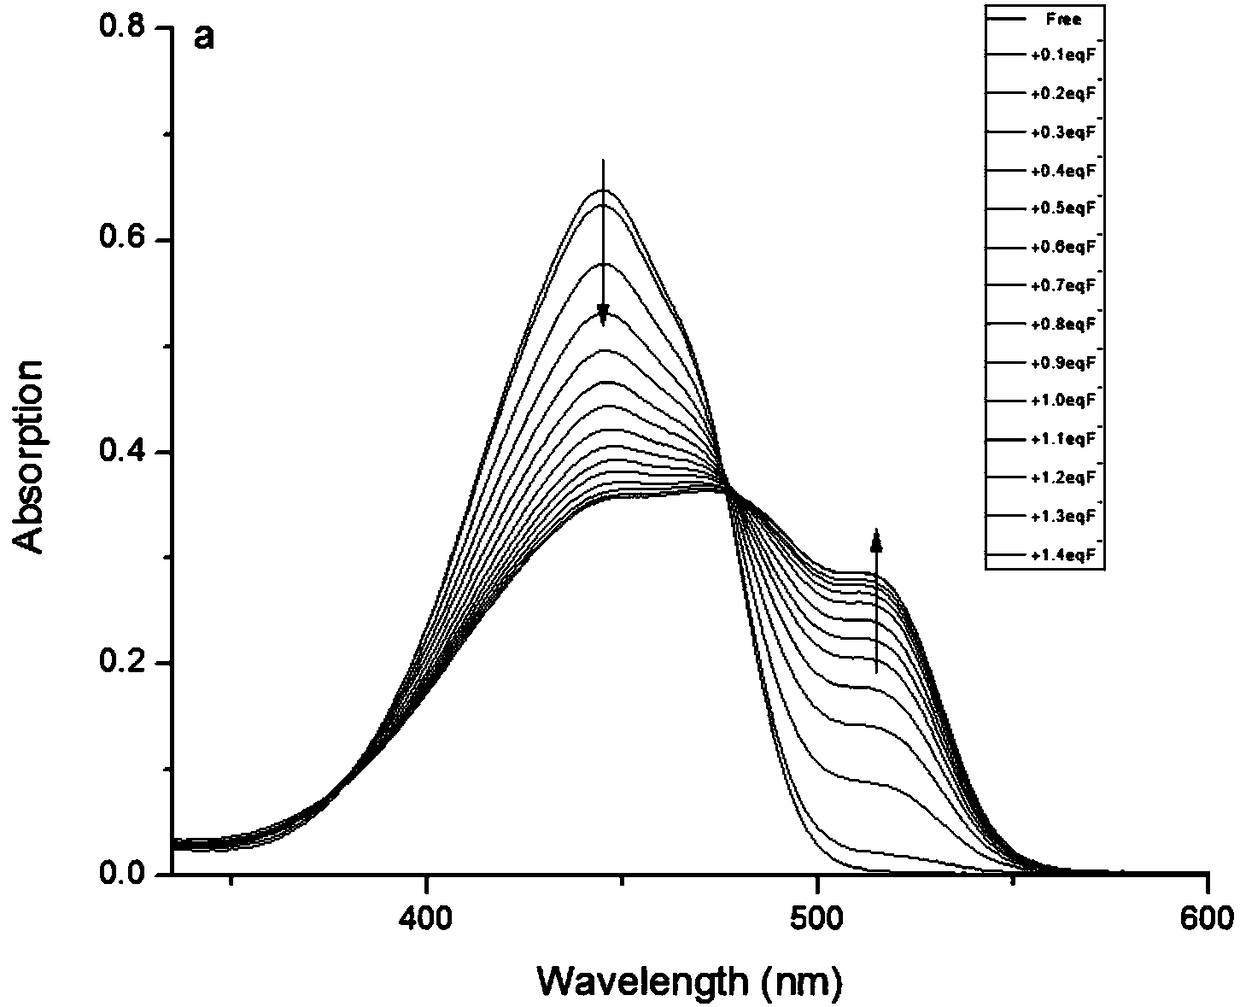
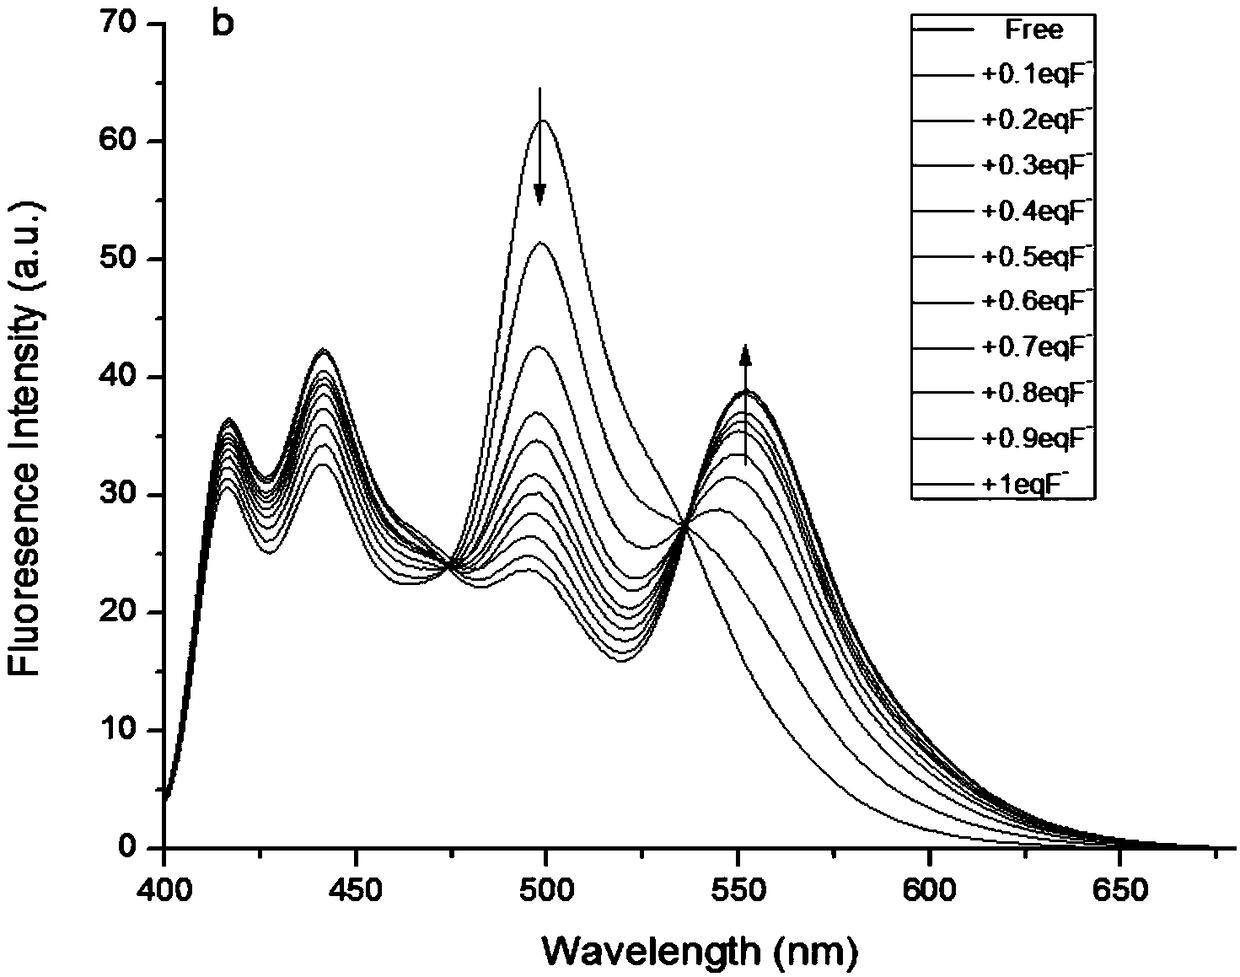
[0041] Test method: (a) Different concentrations of F - (0-10μM) compared to the influence of color fluorescent probe (10μM) on the absorption spectrum; (b) different concentrations of F - (0-10 μM) compared to the effect of the color fluorescent probe (10 μM) on the emission spectrum. The above determinations were carried out in DMSO, and all spectroscopic tests were performed at 25°C F - Measured immediately after addition. See results figure 1 and figure 2 .
[0042] From figure 1 It can be seen that with the F in the colorimetric fluorescent probe solution - As the concentration increases, the peak at 445nm of the absorption spectrum decreases, while a new peak occurs at 516nm, and the intensity increases, and at 0-10μM F - There is a good linear relationship between the concentration range and the absorption value. From figure 2It can be seen that with the F in the colorimetric fluorescent probe solution - As the concentration increases, the peak at 500nm of t...
Embodiment 3
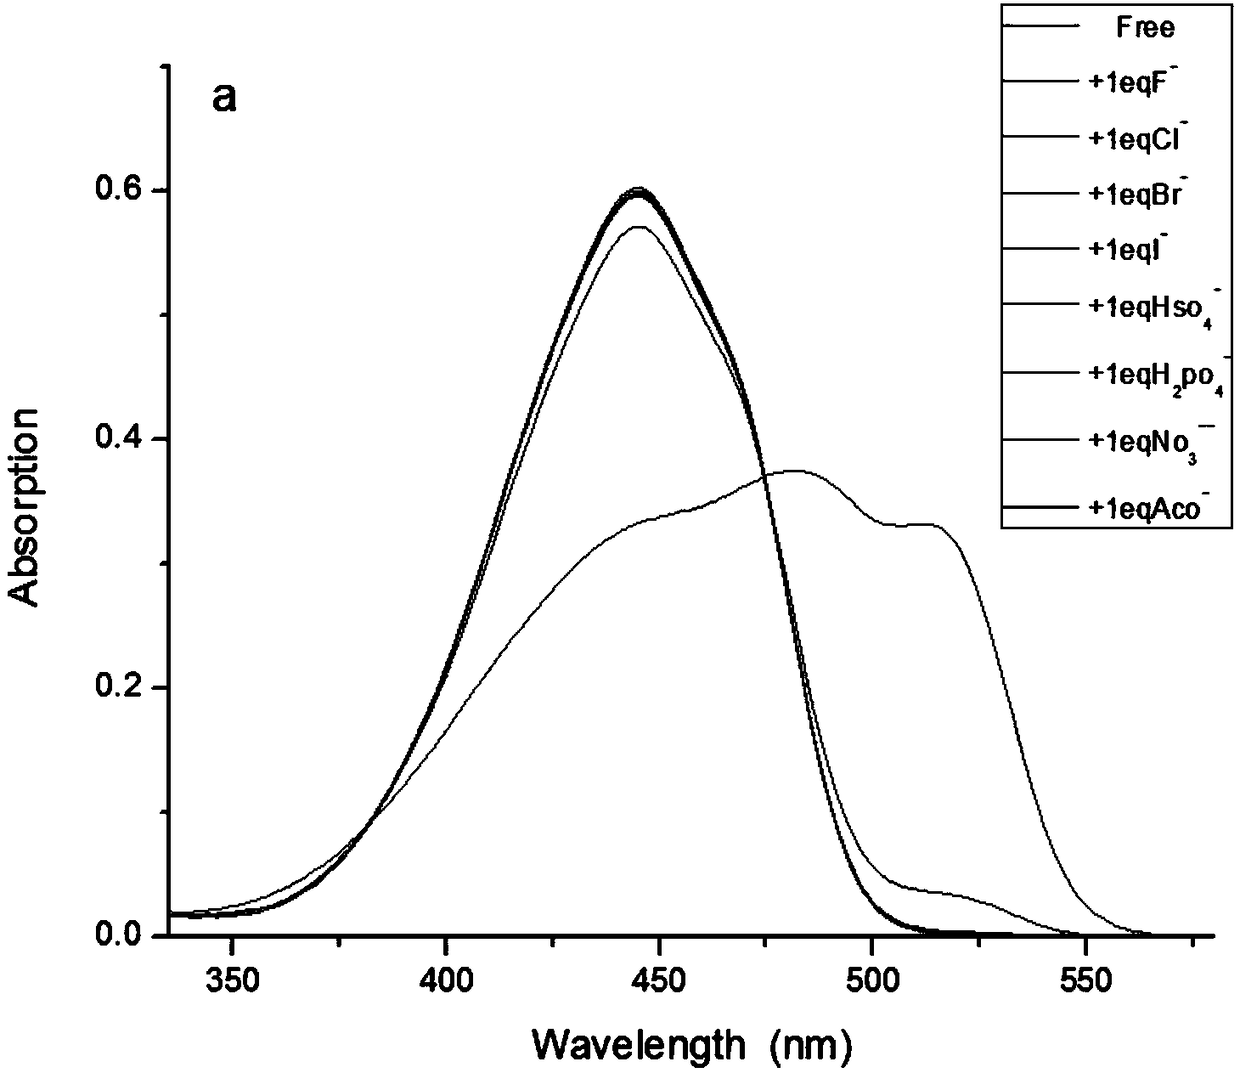
[0044] Effects of different analytes (20 μM) on the UV absorption spectrum and fluorescence emission of the probe (10 μM). Analytes include: Fluoride F - , Chloride ion Cl - , bromide ion Br - , iodide ion I - , hydrogen sulfate ion HSO 4 - , nitrate ion NO 3 - , dihydrogen phosphate ion H 2 PO 4 - and acetate ion AcO - , their concentration was 20 μM. All test conditions are done in DMSO, and all spectra are at 25°C F - Measured immediately after addition. Pipette 100 μL of the probe stock solution (1 mM) into a 10 mL volumetric flask, dry it, add 9 mL of dimethyl sulfoxide, then pipette 20 μL of the above analyte stock solution (10 mM) into the volumetric flask, and then use dimethylsulfoxide Dilute to 10mL with sulfoxide. Shake well and measure immediately. The result is as image 3 and Figure 4 shown.
[0045] From image 3 and Figure 4 It can be seen that the probe has high selectivity to fluoride ions and can react with fluoride ions transferably. ...
PUM
 Abstract
Description
Claims
Application Information
 - R&D
- Intellectual Property
- Life Sciences
- Materials
- Tech Scout
- Unparalleled Data Quality
- Higher Quality Content
- 60% Fewer Hallucinations
Browse by: Latest US Patents, China's latest patents, Technical Efficacy Thesaurus, Application Domain, Technology Topic, Popular Technical Reports.
© 2025 PatSnap. All rights reserved.Legal|Privacy policy|Modern Slavery Act Transparency Statement|Sitemap|About US| Contact US: help@patsnap.com


