Method for detecting photo ionization microscopic imaging of Rydberg atoms
A technology of microscopic imaging and photoionization, which is applied in the field of photoelectric information, can solve the problems that have not been reported, and achieve the effect of clear physical image, short time and clear interference pattern
- Summary
- Abstract
- Description
- Claims
- Application Information
AI Technical Summary
Problems solved by technology
Method used
Image
Examples
Embodiment 1
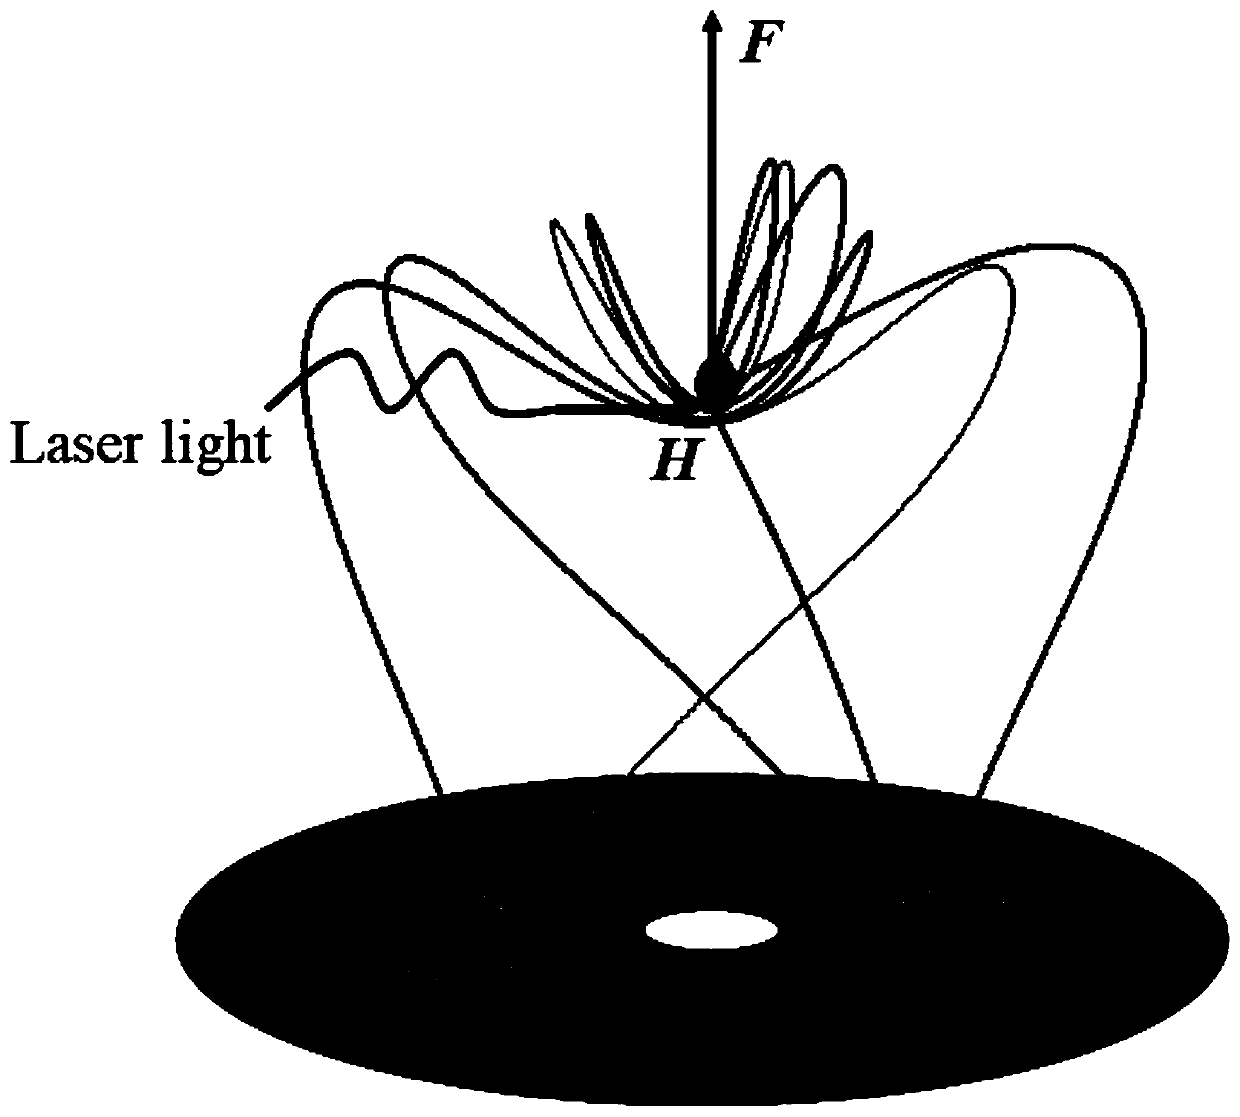
[0048] S1. Irradiate hydrogen atoms with a beam of laser light to transition electrons from the ground state to a highly excited state;
[0049] S2. Apply an external oscillating electric field, and write the Hamiltonian of photoionized electrons in the oscillating electric field and the Coulomb field:
[0050]
[0051] The Hamiltonian is scaled as follows:
[0052]
[0053]
[0054] Get the Hamiltonian after scale transformation:
[0055]
[0056] In order to eliminate the singularity of the above equation at the origin, the parabolic coordinate (u, v) and its conjugate momentum are introduced, defined as:
[0057]
[0058] in:
[0059]
[0060] Give a new scaled time variable:
[0061] dτ / dt=1 / (u 2 +v 2 ) (6)
[0062] We get the actual Hamiltonian as:
[0063] h=(u 2 +v 2 )(H-ε) (7)
[0064]
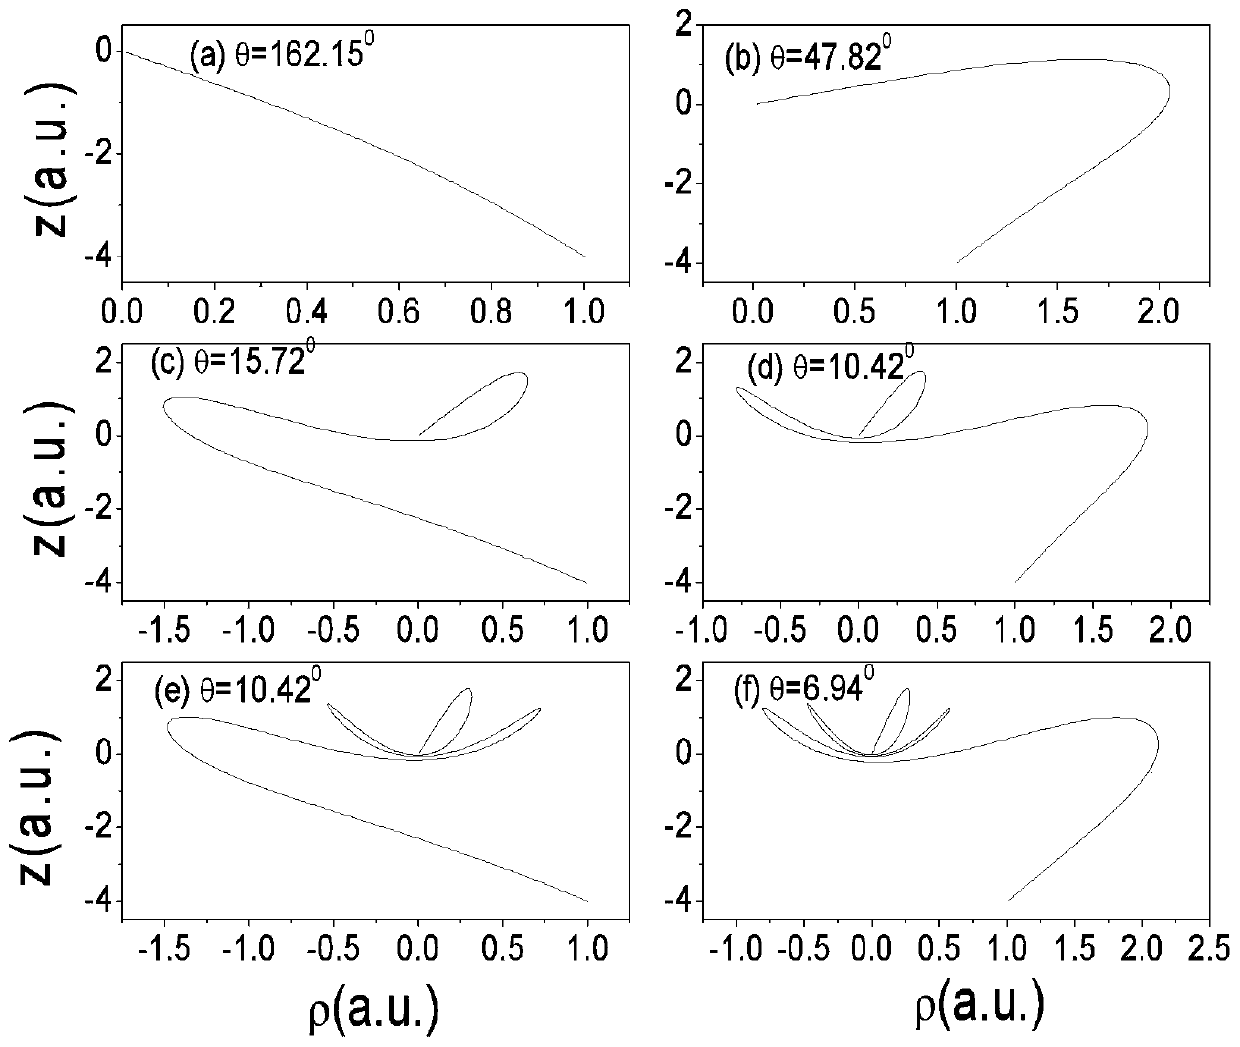
[0065] Assume that ionized electrons exit at an angle θ i Emit from origin:,
[0066] θ i =tan -1 (ρ / z)=2tan -1 (v / u) (9)
[0067] It is the angle ...
Embodiment 2
[0082] Similar to Example 1, the difference is that in step 5, the position of the detection plane and the scale energy of the Rydberg hydrogen atom, z, are fixed. 0 =4.0s.u.≈4.8um, the scale energy of Rydberg hydrogen atom ε=-0.1, changing the frequency of the oscillating electric field, realizes the regulation of photoionization microscopic interference imaging. Assume that the frequency of the oscillating electric field varies between 0.01π and 0.09π. The result is as Figure 4-7 shown. Figure 4 The distribution curves of t-ρ on the detection plane are given in the electric field with different oscillation frequencies.
[0083] from Figure 4 It can be seen that as the frequency of the oscillating electric field increases, the trajectory of the photoionized electrons arriving at a point on the detection plane decreases, and the maximum collision radius of the electrons reaching the detection plane decreases.
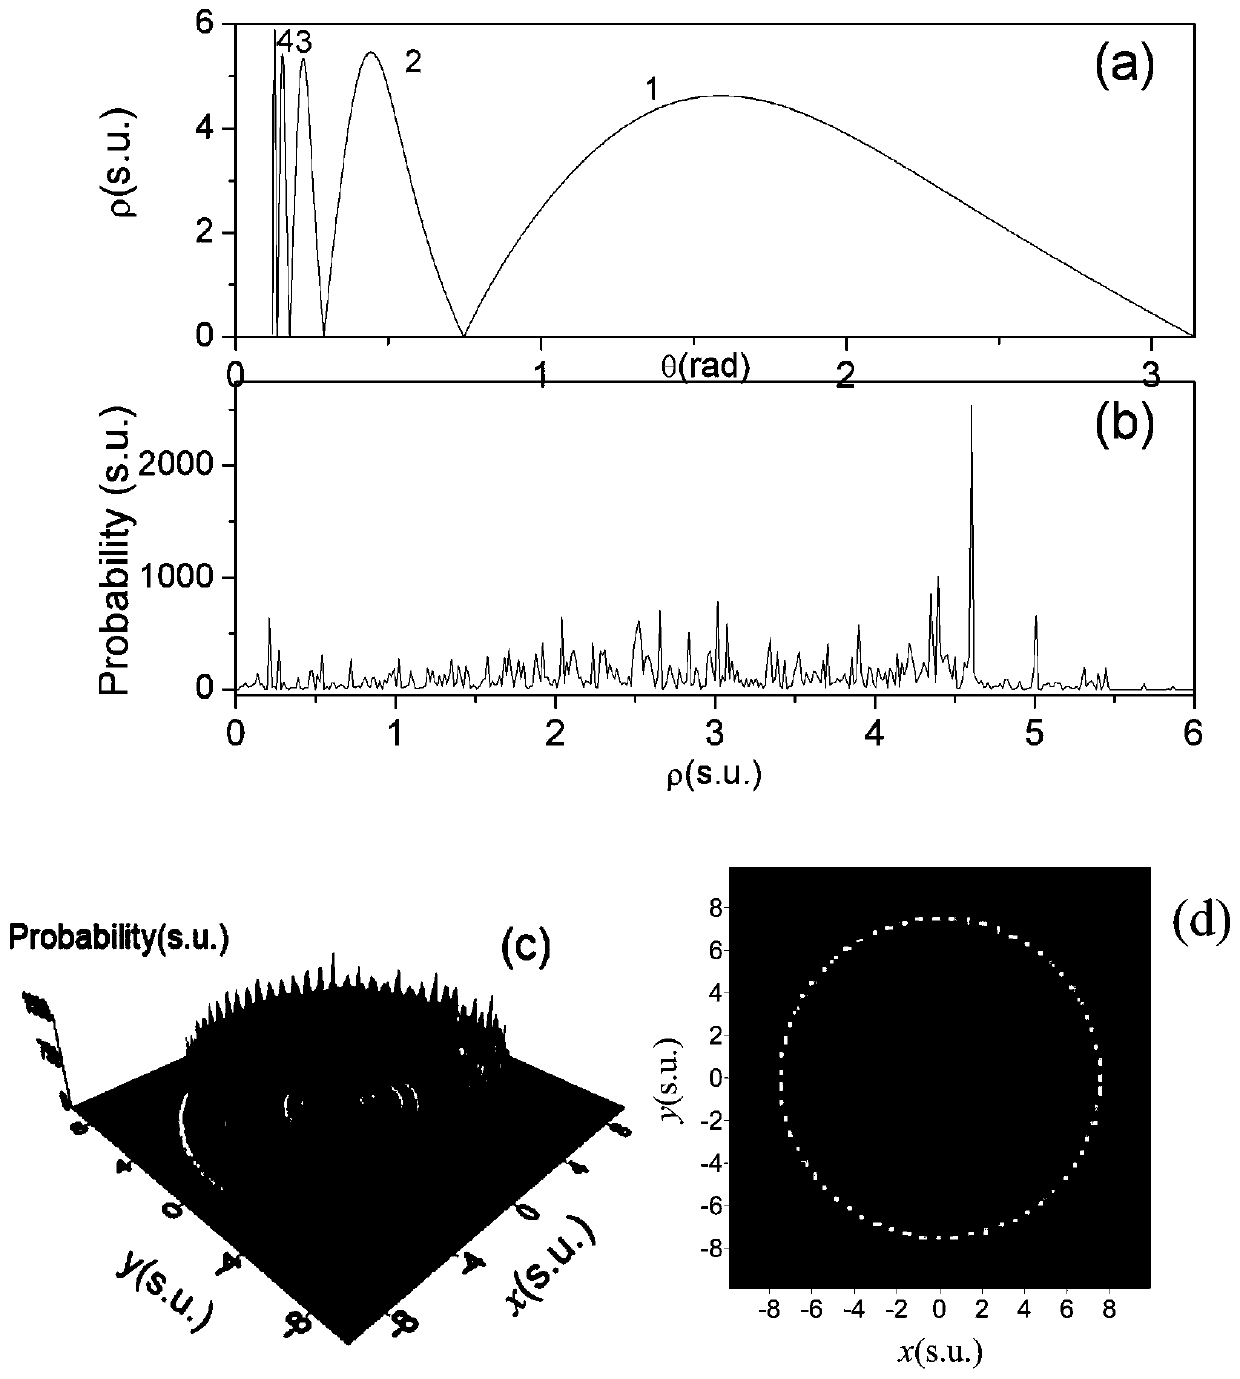
[0084] Figure 5 The two-dimensional electron probability ...
Embodiment 3
[0087] Similar to Embodiments 1 and 2, the difference is that in step 5, the position of the detection plane and the frequency of the oscillating electric field are fixed, z 0 =4.0s.u.≈4.8um, ω=0.05π, change the scale energy of Rydberg hydrogen atoms, and realize the regulation of photoionization micro-interference imaging. Assume that the scale energy of the Rydberg hydrogen atom varies between -0.01 and -1.0. The result is as Figure 8-11 shown. Figure 8 The ρ-θ distribution curves of photoionized electrons arriving on the detection plane are given when the Rydberg hydrogen atoms take different scale energies. Figure 9 The two-dimensional probability density distribution curve of Rydberg hydrogen atoms reaching the detection plane in an oscillating electric field is given as a function of the scale energy. Figure 10 and 11 The three-dimensional probability density distribution curve of Rydberg hydrogen atoms reaching the detection plane in the oscillating electric fie...
PUM
 Abstract
Description
Claims
Application Information
 - R&D
- Intellectual Property
- Life Sciences
- Materials
- Tech Scout
- Unparalleled Data Quality
- Higher Quality Content
- 60% Fewer Hallucinations
Browse by: Latest US Patents, China's latest patents, Technical Efficacy Thesaurus, Application Domain, Technology Topic, Popular Technical Reports.
© 2025 PatSnap. All rights reserved.Legal|Privacy policy|Modern Slavery Act Transparency Statement|Sitemap|About US| Contact US: help@patsnap.com


