Hemoglobin analysis method and system based on microscopic amplification digital image

A hemoglobin and microscopic amplification technology, applied in image analysis, analysis materials, image data processing, etc., can solve the problems of lower overall efficiency, complicated manipulation process, inability to analyze results into deeper cell levels, etc., to achieve accuracy High, accurate volume measurement, and the effect of keeping the cell shape intact

Active Publication Date: 2022-07-22
SHENZHEN ANLV MEDICAL TECH CO LTD
View PDF19 Cites 4 Cited by
  • Summary
  • Abstract
  • Description
  • Claims
  • Application Information

AI Technical Summary

Problems solved by technology

In the above-mentioned measurement process of hemoglobin, because hemolytic agent is needed to dissolve hemoglobin from the target cells, the hemolysis process will destroy the overall structure of the cells. Therefore, in the process of blood analysis, it is usually considered to count the blood cells first, and then perform Hemolysis; the whole blood analysis process is limited by this and must be carried out in a specific order; and the addition of hemolytic agents in the middle process also makes the entire manipulation process more complicated and reduces the overall efficiency
[0005] In the prior art, when the hemoglobin content HGB is detected, hemolysis needs to be performed first, so the opportunity to accurately obtain the hemoglobin in a single red blood cell is also lost. Therefore, the hemoglobin content HGB output by the traditional blood cell analyzer can only output a quantitative analysis for the sample. The results of the quantitative analysis cannot be accurately penetrated to the level of a single red blood cell, nor can the analysis results be entered into a deeper cell level

Method used


Image

  • Hemoglobin analysis method and system based on microscopic amplification digital image
  • Hemoglobin analysis method and system based on microscopic amplification digital image
  • Hemoglobin analysis method and system based on microscopic amplification digital image

Examples


Embodiment Construction

[0072] The content of the present invention will be further described in detail below with reference to the accompanying drawings. It should be noted that the numbers with serial numbers in the method steps in the present application are only for identification and distinction, and do not necessarily represent a sequence relationship in time or space.

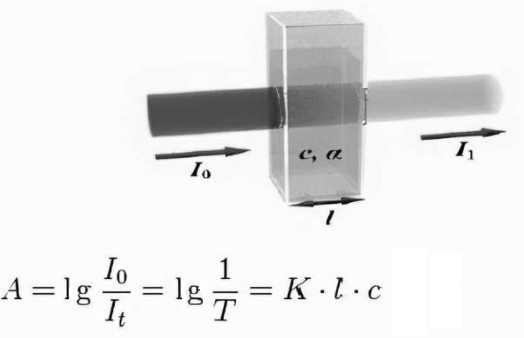
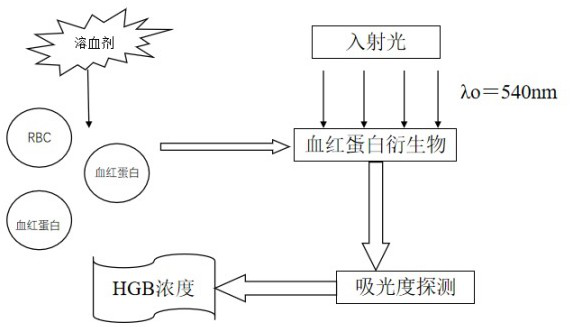
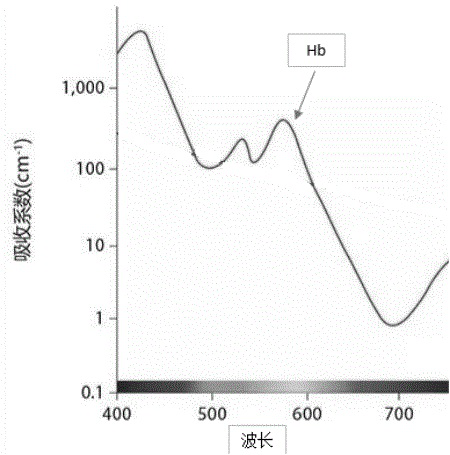
[0073] With the advancement of artificial intelligence (AI), AI algorithms are more and more widely used in digital image processing. In the field of blood cell analysis, there is no product that uses AI algorithms for cell parameter analysis based on digital images of blood samples. , especially the use of microscopically magnified digital images for the analysis and determination of hemoglobin concentration and content. Analytical determination of hemoglobin concentration usually requires the use of the optical absorption properties of blood; such as image 3 Shown is a schematic diagram of blood absorption spectrum; in the ...


PUM

PropertyMeasurementUnit
wavelengthaaaaaaaaaa

Abstract

The invention discloses a hemoglobin analysis method based on a microscopic amplified digital image. The first absorbance alpha1 of the target cell is equal to 1g (the average gray value Gb of the blank area/the average gray value Gc of the target cell area); and obtaining the hemoglobin content CH = of the target cell. The hemoglobin content CH of the target cell is equal to the first absorbance alpha1 * the target cell area STC * the first hemoglobin content correction coefficient CHGB1. By combining the Beer-Lambert law and microscopic magnification digital images, the hemoglobin content of a single target cell can be accurately obtained, so that the visual angle of clinically observing the hemoglobin content goes deep from the total sample hemoglobin content to the hemoglobin content of a single cell level, and the statistical analysis of the single hemoglobin content can be developed. And a deeper layer of valuable information is obtained for clinic. And the whole measurement system is extremely simple, a light path and a liquid path are free from maintenance, the operation and control processes are also extremely simple, and the comprehensive efficiency of hemoglobin detection is greatly improved.

Description

technical field [0001] The present application belongs to the technical field of obtaining the characteristics and parameters of each component in a target sample based on a microscopically magnified digital image of a cell suspension, in particular to the technical field of analyzing specific components in cells based on a digital image, and in particular to the use of microscopic magnification of a cell suspension The technical field of digital image analysis of hemoglobin content. Background technique [0002] Beer-Lambert law is one of the principles commonly used in the determination of various substances. like figure 1 The physical meaning is that when a beam of parallel monochromatic light vertically passes through a uniform non-scattering light-absorbing material, its absorbance A is proportional to the concentration c of the light-absorbing material and the thickness b of the absorption layer, and is proportional to the transmittance T Anticorrelation. Mathematic...

Claims


Application Information

Patent Timeline
Patent Type & Authority Applications(China)
IPC IPC(8): G01N15/10G01N21/31G01N21/84G01N33/50G06T7/00G06T7/62
CPCG01N15/10G01N21/31G01N21/84G01N33/5005G06T7/0012G06T7/62G01N2015/1006G06T2207/10061
Inventor 王志平刘亚慧房祥飞汪椿树
Owner SHENZHEN ANLV MEDICAL TECH CO LTD
Why Eureka
Try Eureka