Sealed container, manufacturing method therefor, gas measuring method, and gas measuring apparatus
Inactive Publication Date: 2005-01-27
CANON KK +1
6 Cites 12 Cited by
AI-Extracted Technical Summary
Problems solved by technology
Such image display devices face a major problem of an image display life.
However, a gas absorbing power of the barium getter inside an actual panel is hard to estimate from the basic properties.
Accordingly, as a method of measuring a life of an image display device, it is a problem of urgency to establish a method of measuring a life of a getter, in which an influence of a gas exerted to a device when an image is displayed is evaluated (an emission gas rate is accurately measured for each type of gas) while a vacuum state of the image display device is maintained.
However, it is difficult to place a large apparatus such as a flat panel display inside the vacuum chamber for the measurement.
If the measuring apparatus is manufactured to be adapted for such a large apparatus, a huge manufacturing cost is required, making it hard to implement such arrangement.
However, in JP 07-226159 A, a mass spectrometer is not used for the gas measurement, thereby making it impossible to measure an emission gas rate for each type of gas, and a gas to be adsorbed to a getter cannot be supplied, thereby making it impossible to accurately evaluate a life of a CRT.
However, a ...
View moreMethod used
Also, in the case of measuring the partial pressure of each type of gas, the mass spectrometers are respectively provided as necessary to the two measuring chambers divided by the orifice. Therefore, the emission gas rates of the types of gases having the same molecular weight (mass number) such as CO and N2 can be easily separated by solving the simultaneous equations based on a relational expression between the pressure and a peak intensity by use of a cracking pattern. Thus, the measurement of the emission gas rate of each type of gas becomes possible. Accordingly, if the emission gas rate is measured in one image display device, the emission gas rate in another image display device can be easily predicted.
Formed on the phosphor 207 is the metal back 206. The metal back 206 is composed of a conductive thin film containing Al or the like. The metal back 206 reflects light traveling toward the rear plate 201 as the electron source among the lights generated in the phosphor 207, thereby improving a luminance. Further, the metal back 206 imparts conductivity to an image display area of the face plate 210 to prevent charges from being accumulated, and serves as an anode electrode with respect to the surface conduction electron-emitting device 209 of the rear plate 201. The metal back 206 also has a function of preventing the phosphor 207 from being damaged by ions generated when gases remaining inside the face plate 210 and the envelope 211 are ionized by electron beams.
Further, by introducing the getter adsorption gas from the gas chamber as necessary, a constant amount of gas can be supplied to the image display device at a fixed rate. Accordingly, the total adsorption gas amount of the getter can be quantitatively evaluated with high precision.
Further, the exhaust pipe having the vacuum isolating member for connecting to the measuring apparatus is previously provided to the plate. Accordingly, the degasification can be sufficiently performed on the display device, the degasification from the member composing the display device can be suppressed to a minimum, and the emission gas rate at the time when an image is displayed in the image display device can be accurately measured.
Further, there is no trouble such as a leak or a damage which occurs when the image display device that has become a sealed container is formed with a hole later and attached with the exhaust pipe for measurement. In addition, glass fragments generated at the time of puncturing the glass are kept from being scattered inside the image display device, thereby suppressing discharge due to foreign matters such as glass fragments when displaying an image.
If the region to which the getter is not formed is provided as necessary to part of the plate including the phosphor and the getter, by measuring the emission gas rate of the getter adsorption gas in the region to which the getter is not formed at the time of displaying an image in the region for a short period of time, the attenuation index of the emission gas rate of the getter adsorption gas can be obtained. Next, by measuring the total adsorption gas amount of the getter according to introduction of the getter adsorption gas, the relational expression between the attenuation index of the emission gas rate of the getter adsorption gas and the total adsorption gas amount of the getter is solved. Accordingly, the getter lifetime can be easily calculated, and the l...
View moreBenefits of technology
Further, by introducing the getter adsorption gas from the gas chamber, a constant amount of gas can be supplied to the container at a fixed rate. Accordingly, the total adsorption gas amount of the getter can be quantitatively evaluated with high precision.
Further, if each type of gas is introduced in a constant amount at a fixed rate, an arbitrary gas is introduced to display an image, thereby making it possible to accurately evaluate the influences of the type of gas on the electron-emitting characteristics of the electron source.
If the region to which the getter is not formed is provided to part of the plate including the phosphor and the getter, by measuring the emission gas rate of the getter adsorption gas in the region to which the getter is not formed at the time of displaying an image in the region for a short period of time, t...
View moreAbstract
In order to be capable of high-precision gas measurement and evaluating influences of a gas on an electron source, and to predict a life of an image display device with high precision for a short period of time, there is provided a sealed container which is capable of maintaining an inside thereof to a lower pressure than an atmospheric pressure, and is used for an image display device including in the inside: a phosphor; an electron-emitting device for causing the phosphor to emit light; and a getter, the sealed container including an exhaust pipe having a breakable vacuum isolating member on at least one side of the image display device. Accordingly, after the exhaust pipe is connected to a gas measuring apparatus, by vacuum-exhausting the gas measuring apparatus and breaking the breakable vacuum isolating member, it is possible to perform a gas measurement on the image display device by using a measuring chamber having an orifice having a known conductance and installed in part of an exhaust channel of the gas measuring apparatus for vacuum-exhausting the image display device.
Application Domain
Technology Topic
Image
Examples
- Experimental program(3)
Example
EXAMPLE 1
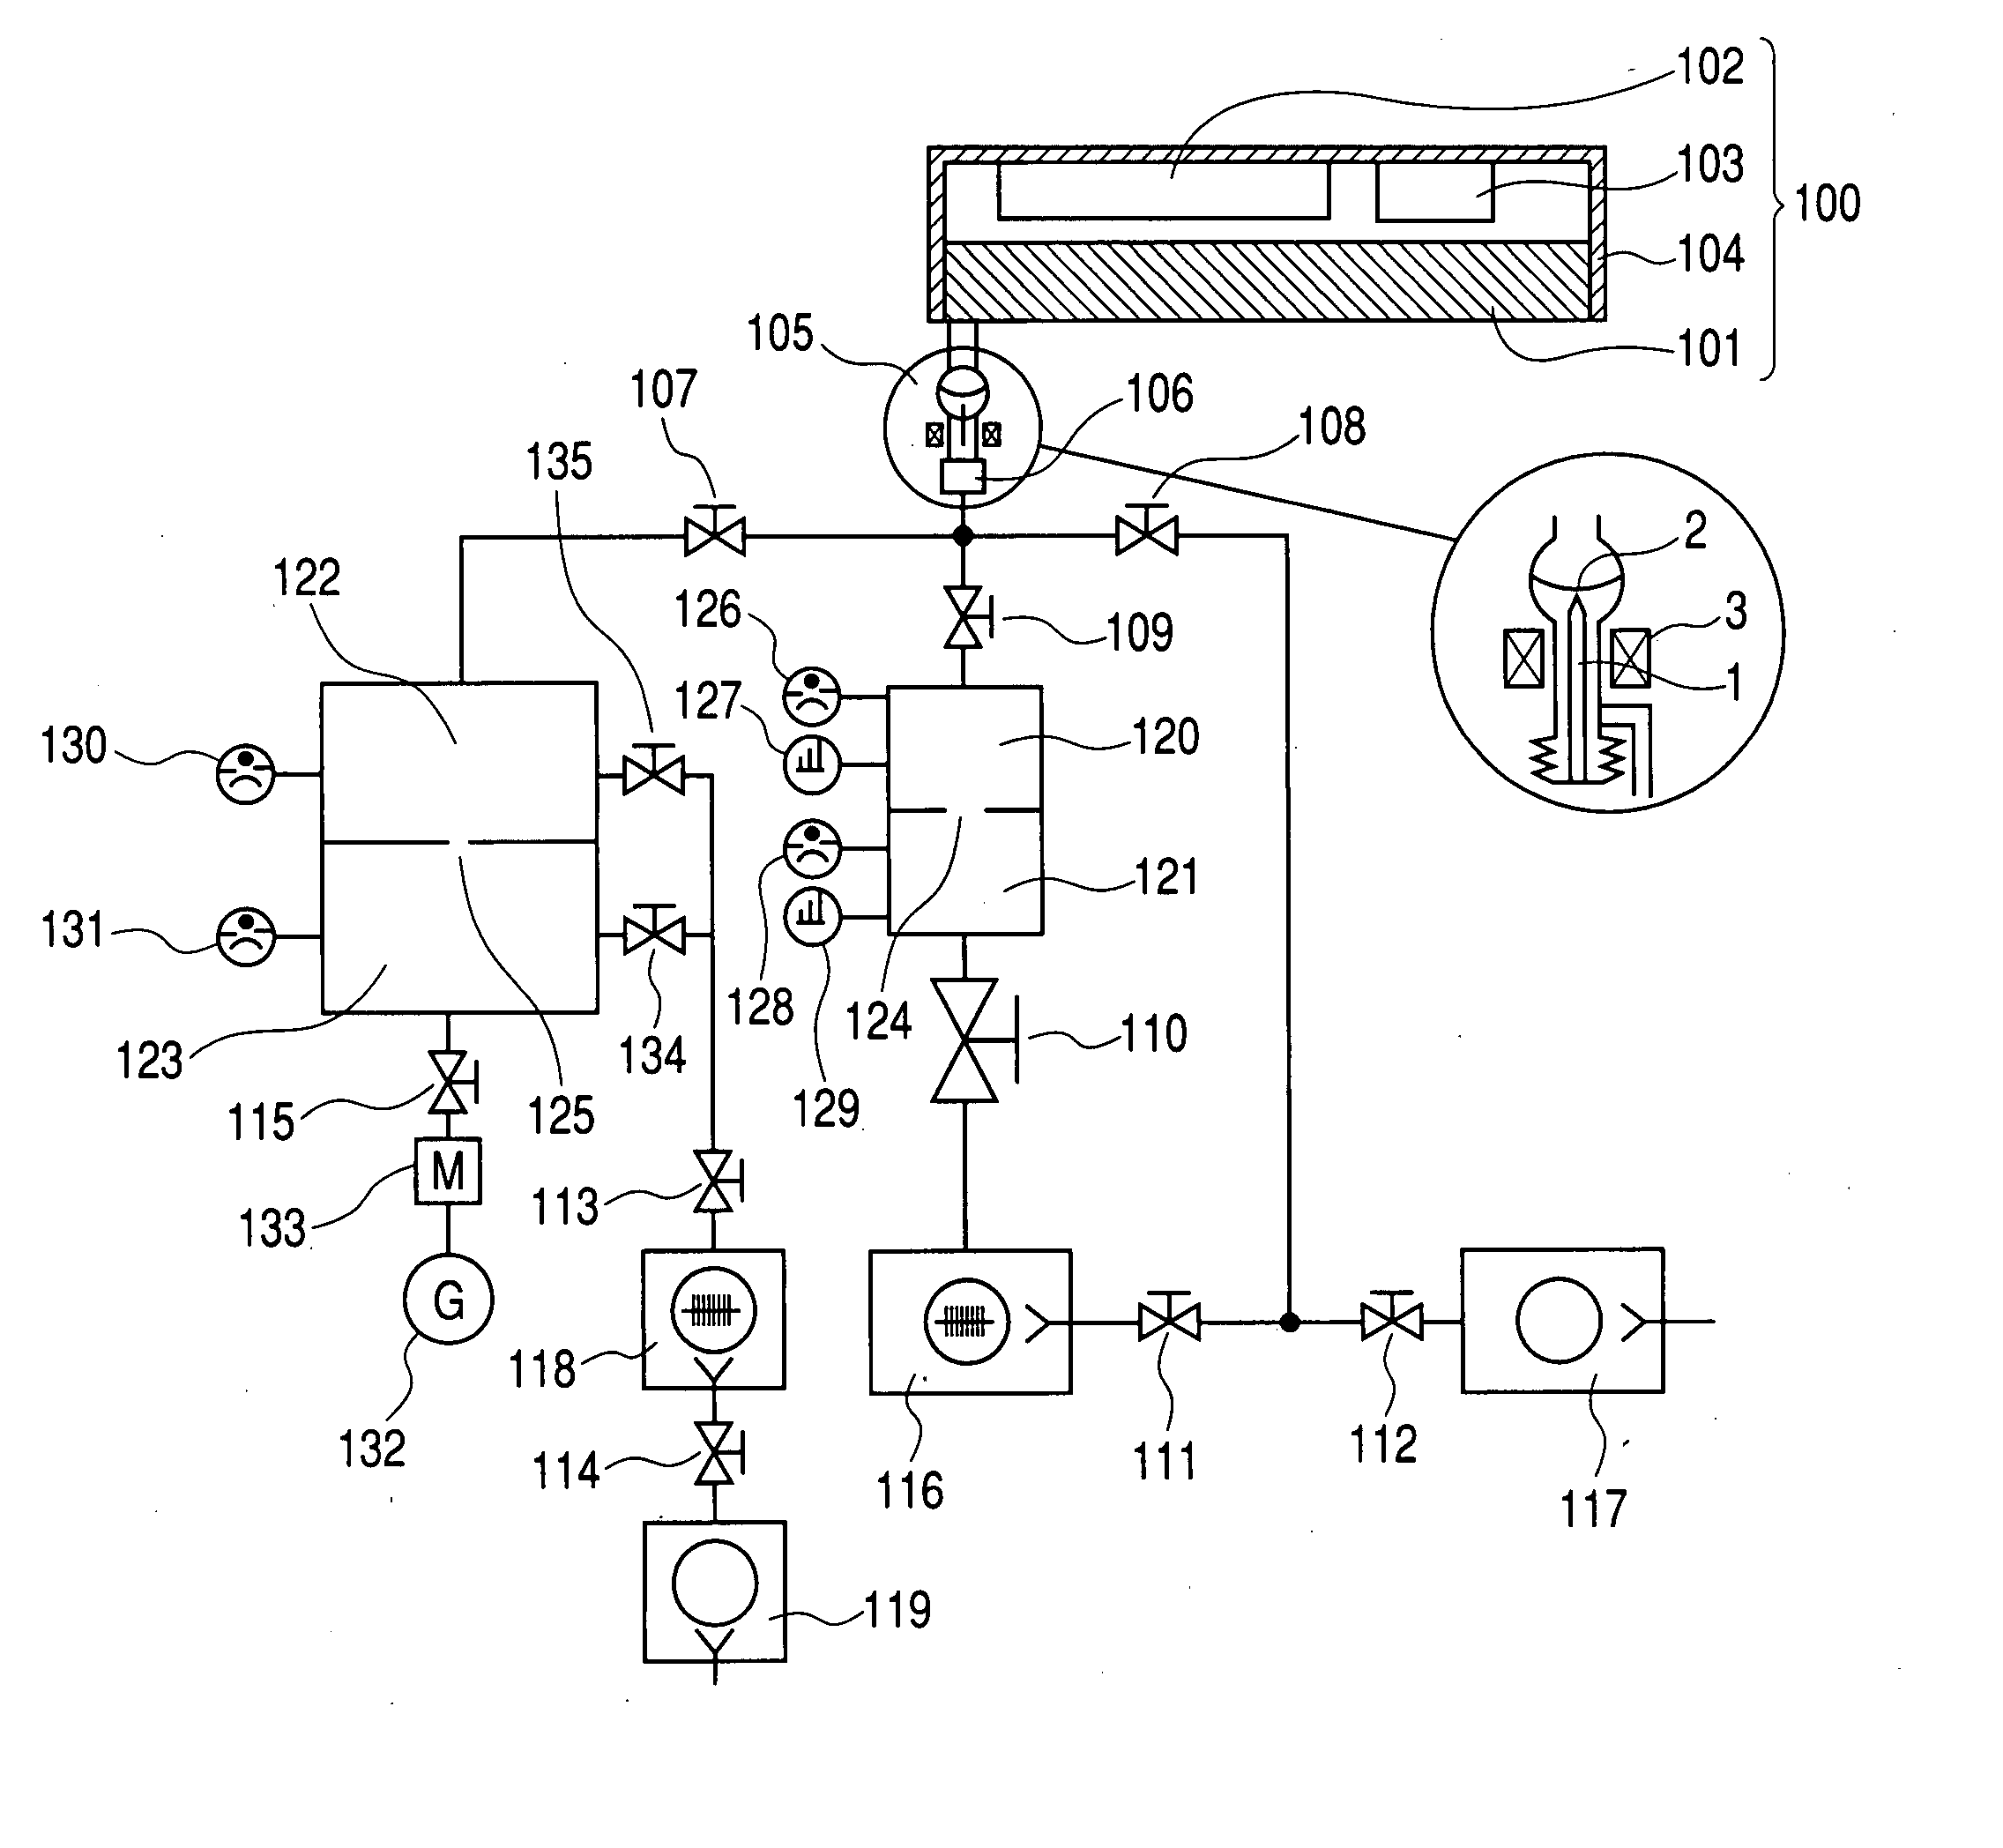
Referring to FIG. 8, the gas measuring method using the measuring apparatus for the image display device is described. Also, referring to FIGS. 2 to 7, a method of manufacturing the sealed container as the image display device that has undergone the gas measurement is described.
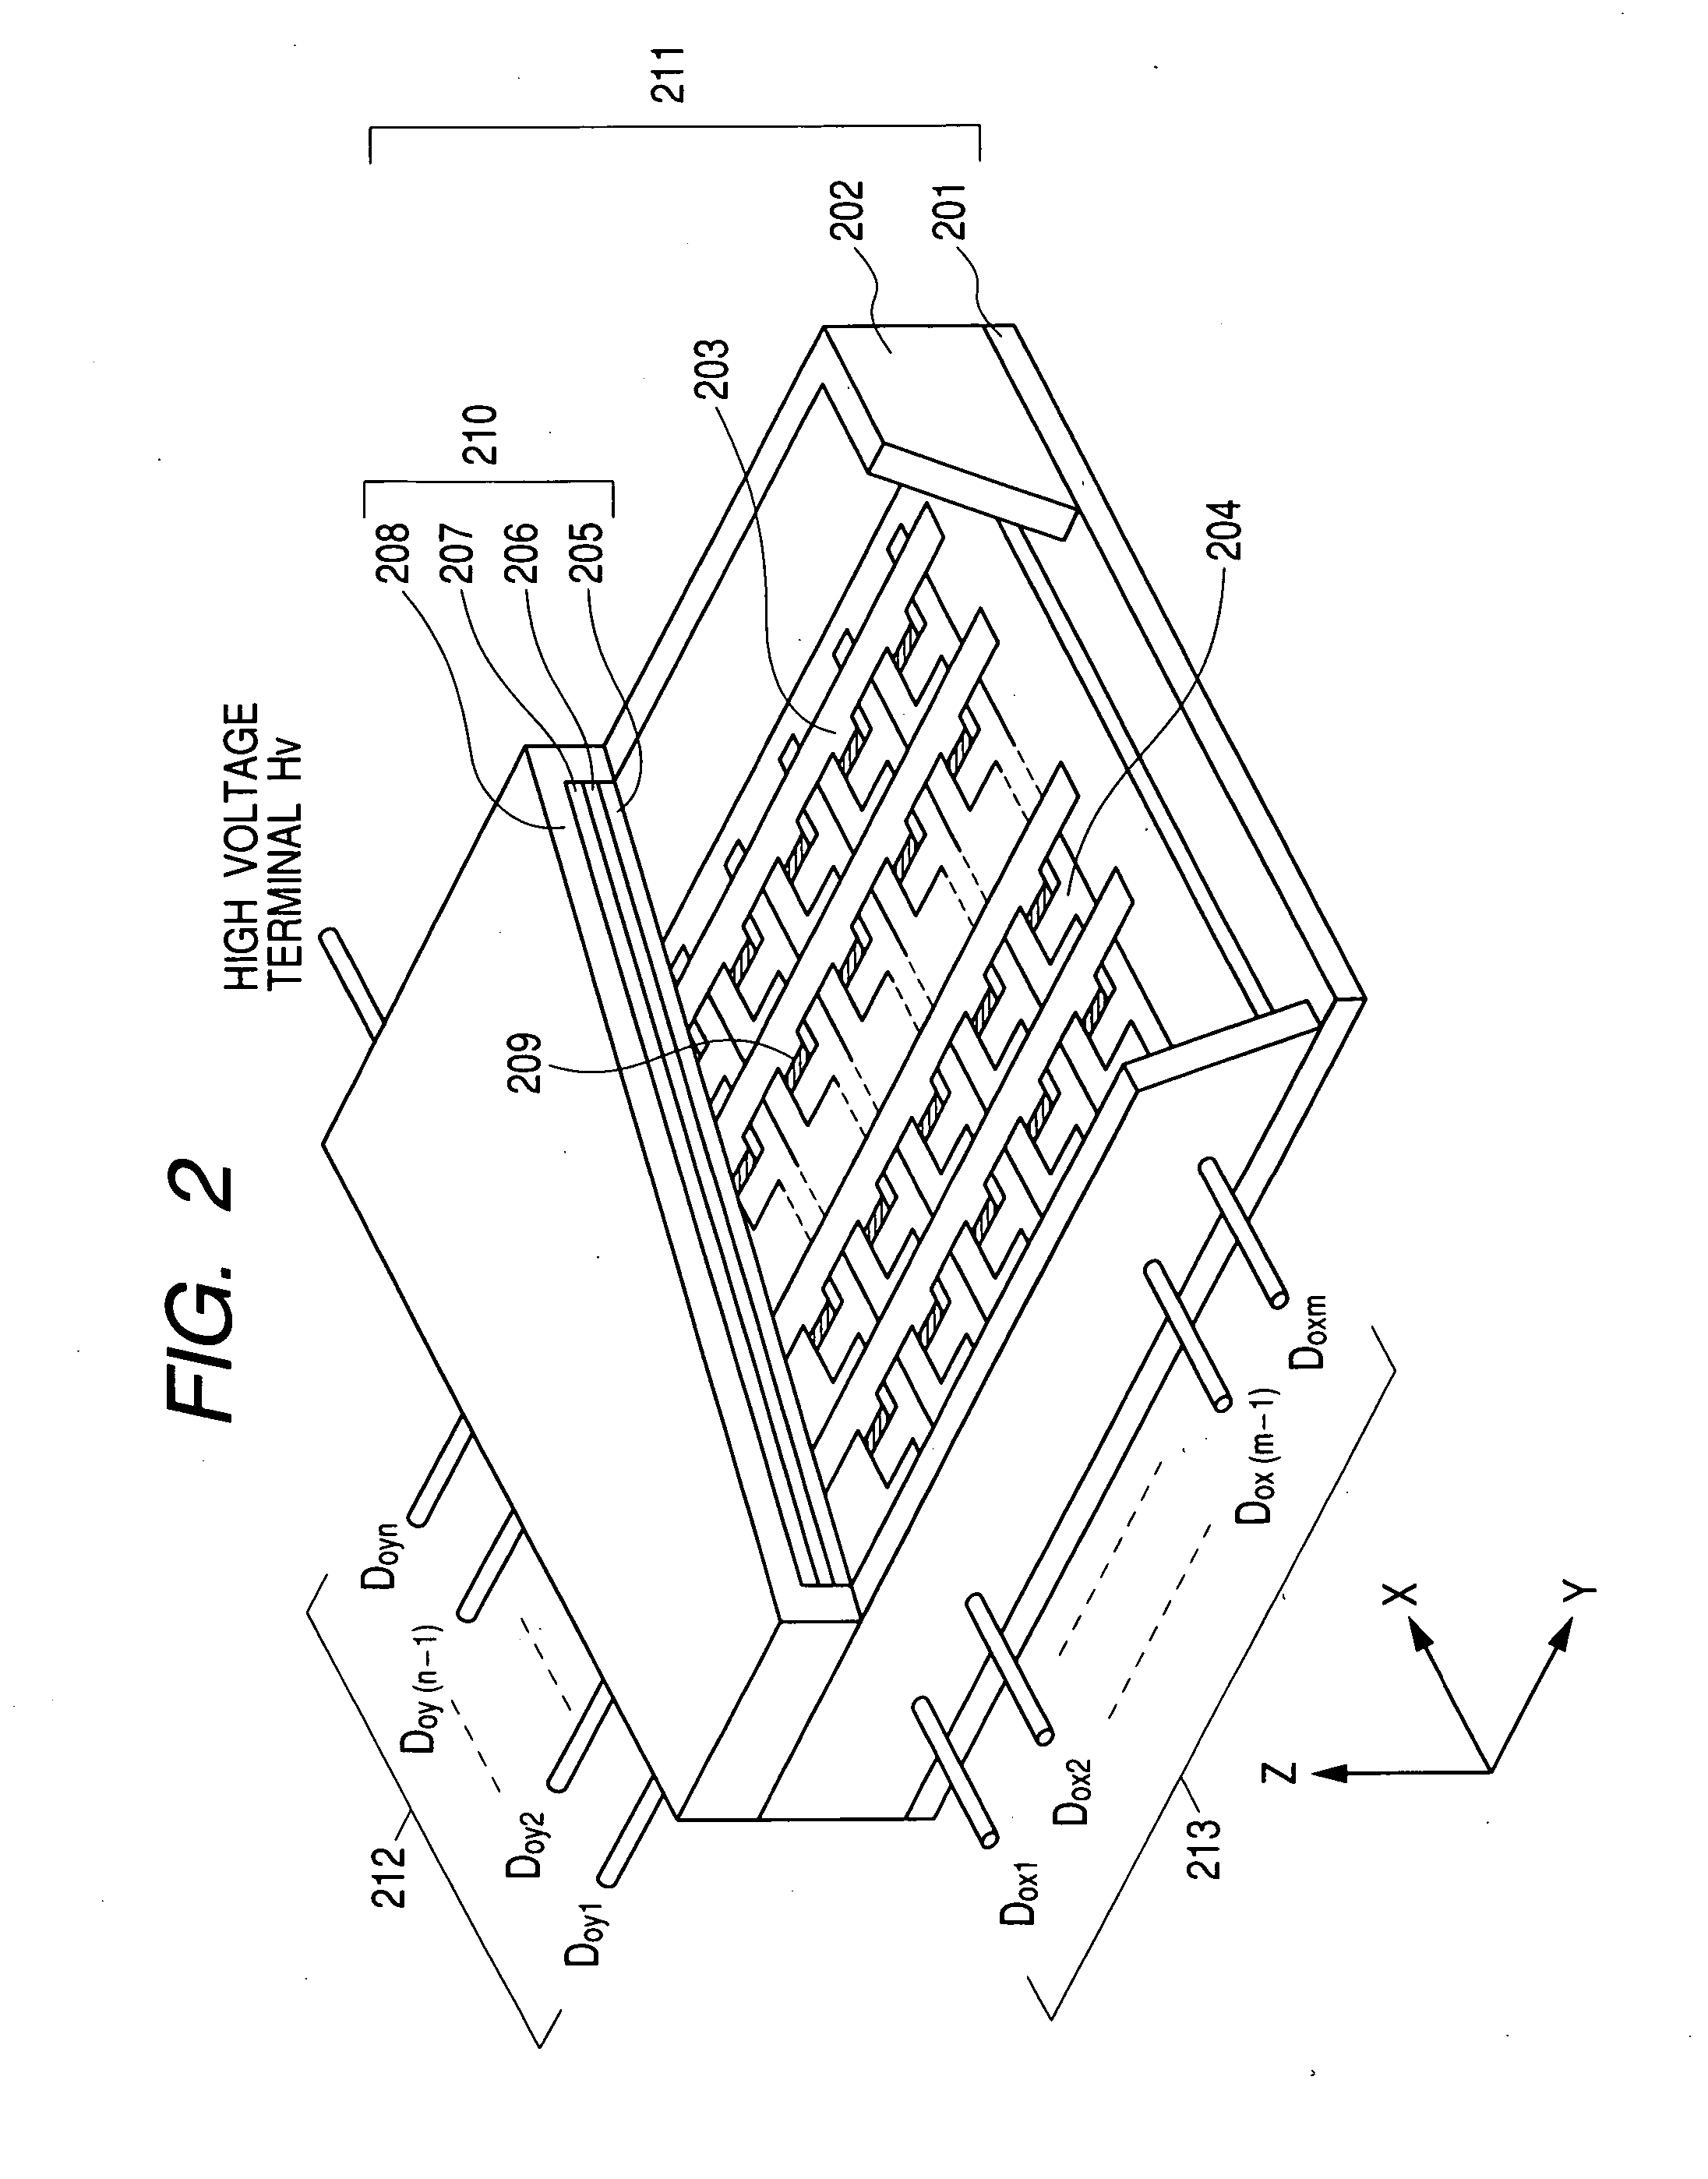
First, description will be made of the method of manufacturing the sealed container as the image display device. As the rear plate 201, soda glass (SL; manufactured by Nippon Sheet Glass Co., Ltd.) having a thickness of 2.8 mm and a size of 240 mm×320 mm was used. As the face plate 210, soda glass (SL; manufactured by Nippon Sheet Glass Co., Ltd.) having a thickness of 2.8 mm and a size of 190 mm×270 mm was used.
As the device electrodes 401 and 403 of the surface conduction electron-emitting device 209 as the electron source, a platinum film was formed on the rear plate 201 by the evaporation method, and processed by the photolithography technique (including processing techniques such as etching and lift-off) into a shape in which the film thickness is 100 nm, the inter-device-electrode interval L is 2 μm, and the length W of the device electrode is 300 μm.
After application of a solution containing organic palladium (CCP-4230; manufactured by Okuno Pharmaceutical Co., Ltd.) as the organometallic solution, the resultant film was subjected to heat treatment at 300° C. for 10 minutes to form a fine particle film composed of fine particles (with an average particle diameter of 8 nm) containing palladium as a main component. The fine particle film-was processed by the photolithography technique (including the processing techniques such as etching and lift-off) to form the conductive thin film 404 having a size of 200×100 μm.
Subsequently, Ag paste ink was printed and baked to form the upper wirings 301 (100 wirings) having a width of 500 μm and a thickness of 12 μm, and the lower wirings 302 (600 wirings) and the wiring pads 304 (60000 pads) which have a width of 300 μm and a thickness of 8 μm. A glass paste was printed and baked (at a baking temperature of 550° C.) to form the interlayer insulating film 303 having a thickness of 20 μm.
After being vacuum-exhausted by a dedicated apparatus, the rear plate 201 was applied with a voltage pulse having a triangular waveform (a base of 1 msec, a period of 10 msec, and a peak value of 5 V) for 60 sec to form the electron-emitting section 402 (forming operation). Further, benzonitrile was introduced therein to perform activation.
On the other hand, as shown in FIG. 6, the single through hole 604 for the exhaust pipe 105 provided with the breakable vacuum isolating member having a hole diameter Φ of 9.0 mm was formed in the face plate 210. In the face plate 210, green phosphor (P22GN4; manufactured by Kasei Optonix, Ltd.) was applied thereto as the phosphor 207, and further aluminum having a thickness of 200 nm was formed thereto as the metal back 206 by using a polymer filming method.
With regard to the exhaust pipe 105 having the breakable vacuum isolating member 602 shown in FIG. 6, a glass plate having a diameter of 9.95 mm and a thickness of 1 mm was inserted into a glass exhaust pipe having a thickness of 1 mm, an outer diameter of 12 mm (an inner diameter of 10 mm), and a length of 100 mm at a portion 30 mm apart from an end portion of the glass exhaust pipe. The glass exhaust pipe was heated from its outside by a gas burner. After glass was melted and the glass plate inside the glass exhaust pipe became soft, a thin glass film (approximately 0.3 mm) for dividing the exhaust pipe, that is, breakable seal glass 602 was obtained by blowing from one end of the glass exhaust pipe. After that, the bellows 601 made of a stainless steel was connected to the glass exhaust pipe by using the silver brazing alloy member while securing airtightness. Only the face plates that are used as the measurement sample among a large number of face plates were attached with the exhaust pipe 105.
As the frit glass 603 to be applied to the portion formed with the through hole 604 in which a bellows 601 end of the exhaust pipe 105 and the face plate 210 contact each other, LS-3081 manufactured by Nippon Electric Glass Co, Ltd. was used, and heated in a baking furnace at 410° C. for 20 minutes to be fixed.
The shape of the supporting frame 202 has a thickness of 6 mm, an outer size of 150 mm×230 mm, and a width of 10 mm, and soda glass (SL; manufactured by Nippon Sheet Glass Co., Ltd.) was used as a material of the supporting frame 202. In order to seal-bond the supporting frame 202 and the rear plate 201, LS-3081 manufactured by Nippon Electric Glass Co, Ltd. was used as the frit glass, and heated in the baking furnace at 410° C. for 20 minutes to be fixed. The plate obtained by seal-bonding the supporting frame 202 and the rear plate 201, and the face plate 210 having the exhaust pipe 105 were introduced into a vacuum chamber (not shown). After the pressure was reduced to equal to or less than 1×1−5 Pa, the plates were heated at 300° C. for 10 hours, and subjected to degasification. After cooling, the face plate 210 having the exhaust pipe 105 was subjected to the electron-beam cleaning. After that, a Ba film that is active as the getter film 205 was formed by evaporation over the entire metal back 206 film.
On the other hand, after cooling the plate obtained by seal-bonding the supporting frame 202 and the rear plate 201, and the face plate 210 having the exhaust pipe 105 were bonded to each other by using In or an In alloy as a bonding material, and heated to 200° C. for seal-bonding, obtaining the sealed container. After that, the sealed container was cooled down to the room temperature, and taken out of the vacuum chamber that has undergone an atmosphere leak.
In the sealed container and the breakable vacuum isolating member 602 which were manufactured as described above, neither crack nor fissure has developed. This sealed container was connected to the voltage applying device 102 and the high-voltage applying device 103 through cables so as to be able to display an image, and those were received in the external frame 104 to assemble the image display device. The sealed container other than the measurement sample was assembled in accordance with the similar steps to manufacture the image display device.
FIG. 8 shows how the image display device 100 assembled as the measurement sample is connected to the gas measuring apparatus through the exhaust pipe 105. In FIG. 8, reference numeral 801 denotes a luminance meter for measuring a brightness at the time of image display; 802, a thermostatic chamber capable of heating up to 100° C.; and 803, a device baking system capable of heating to a given temperature up to 300° C. The other members that are the same as those shown in other figures are denoted by the same reference numerals. Further description will be made of the main part members. As the first ionization vacuum gauge 126, the second ionization vacuum-gauge 128, the third ionization vacuum gauge 130, and the fourth ionization vacuum gauge 131, an extractor gauge IE514 manufactured by Leybold Vacuum Japan Co., Ltd. was used. As the first mass spectrometer 127 and the second mass spectrometer 129, a quadrupole mass spectrometer H200M manufactured by Leybold Vacuum Japan Co., Ltd. was used. As the turbo-molecular pumps 116 and the turbo-molecular pump 118, TH250M manufactured by Osaka Vacuum, Ltd. was used. As the dry pump 117 and the dry pump 119, DS500L manufactured by Mitsubishi Electric Corporation was used. Further, as an orifice plate of the measuring chamber, a nickel plate having a thickness of 0.6 mm was used, and a hole having a diameter Φ of 6 mm was formed therein as the orifice 124. The conductance at this time is 2.976×10⁻³ m3/sec. As an orifice plate of the gas chamber, a nickel plate having a thickness of 0.6 mm was used, and a hole having a diameter Φ of 0.6 mm was formed therein as the orifice 125. The conductance at this time is 1.628×10⁻⁵ m3/sec.
Next, description will be made of the measuring method for an emission gas rate. In advance, the valves 107 to 109 were closed, the valves 110 to 115, 134, and 135 were opened, the turbo-molecular pumps 116 and 118 and the dry pumps 117 and 119 were activated, and the spaces inside the first measuring chamber 120, the second measuring chamber 121, the first gas chamber 122, and the second gas chamber-123 were each vacuum-exhausted to a pressure equal to or less than approximately 10−5 Pa. Then, the valve 115 was closed. One end of the exhaust pipe 105 was connected to the exhaust pipe adapter 106 using the O-ring. Subsequently, the valves 110 and 111 were closed and the valve 108 was opened to vacuum-exhaust a space before a breakable vacuum isolating member section of the exhaust pipe 105 to approximately 1 Pa. The valve 108 was then closed and the valves 109 to 111 were opened to be vacuum-exhausted to a pressure equal to or less than 10−5 Pa by the turbo-molecular pump. The first ionization vacuum gauge 126, the first mass spectrometer 127, the second ionization vacuum gauge 128, and the second mass spectrometer 129 were activated. After that, a leak check was performed with respect to He, but no leak was detected.
Next, the entire gas measuring apparatus was heated in the device baking system 803 at 200° C. for 10 hours, and subjected to the degasification of the components and the measuring systems.
Next, the breakable vacuum isolating member 602 was broken by being punctured with a rod made of SUS (not shown) whose forward end is incisive and which was provided to the lower portion of the exhaust pipe adapter 106. After breakage, when the values of the first ionization vacuum gauge 126 and the second ionization vacuum gauge 128 were stabilized, the first mass spectrometer 127 and the second mass spectrometer 129 were used to measure the first measuring chamber 120 and the second measuring chamber 121, respectively. Thus, the emission gas rate Q0 on the background (emission gas rate at the time when an image is not displayed) was obtained.
As the types of gases to be measured, eight types of gases: H2, CH4, H2O, CO, N2, O2, Ar, and CO2, were used, and as the peak currents (AMUs), 2, 14, 16, 18, 28, 32, 40, and 44 were used. The cracking patterns (1860 Hartog Drive, San Jose, Calif. 95131) of the respective AMUs are shown in Table 1. TABLE 1 Table of cracking pattern coefficient 2 14 16 18 28 32 40 44 H2 1.000 0.000 0.000 0.000 0.000 0.000 0.000 0.000 CH4 0.005 0.156 1.000 0.000 0.000 0.000 0.000 0.000 H2O 0.000 0.000 0.011 1.000 0.000 0.000 0.000 0.000 CO 0.000 0.006 0.009 0.000 1.000 0.000 0.000 0.000 N2 0.000 0.072 0.000 0.000 1.000 0.000 0.000 0.000 O2 0.000 0.000 0.114 0.000 0.000 1.000 0.000 0.000 Ar 0.000 0.000 0.000 0.000 0.000 0.000 1.000 0.000 CO2 0.000 0.000 0.083 0.000 0.111 0.000 0.000 1.000
A coefficient SG (A/Pa) obtained by multiplying a sensitivity (S) by a gain (G) of each type of gas used for the simultaneous equations is shown in Table 2. TABLE 2 SG value of each type of gas H2 CH4 H2O CO N2 O2 Ar CO2 0.44 1.6 1.0 1.05 1.0 1.0 1.2 1.4
Simultaneous equations were set up based on Tables 1 and 2 and values of the respective peak currents to calculate the pressure P1 (Pa) and the pressure P2 (Pa) of each type of gas. The calculation results and values Q0 (Pa·m3/sec) calculated based thereon are shown in Table 3. TABLE 3 Emission gas rate (Q0) of each type of gas on the background P1 P2 C1 Q0 H2 7.31857 × 10⁻⁸ 5.42116 × 10⁻⁹ 1.11362 × 10⁻² 7.54639 × 10⁻¹⁰ CH4 7.41611 × 10⁻¹⁰ 5.49342 × 10⁻¹¹ 3.93724 × 10⁻³ 2.70361 × 10⁻¹² H2O 2.05375 × 10⁻¹¹ 1.52129 × 10⁻¹² 3.71207 × 10⁻³ 7.05893 × 10⁻¹⁴ CO 1.11254 × 10⁻⁹ 8.88234 × 10⁻¹¹ 2.97627 × 10⁻³ 3.04686 × 10⁻¹² N2 1.09865 × 10⁻⁸ 8.87588 × 10⁻¹⁰ 2.97627 × 10⁻³ 3.00571 × 10⁻¹¹ O2 1.56133 × 10⁻¹⁰ 1.15654 × 10⁻¹¹ 2.78405 × 10⁻³ 4.02483 × 10⁻¹³ Ar 2.50108 × 10⁻¹¹ 1.85265 × 10⁻¹² 2.49013 × 10⁻³ 5.76668 × 10⁻¹⁴ Co2 2.57500 × 10⁻⁹ 1.90741 × 10⁻¹⁰ 2.37425 × 10⁻³ 5.66082 × 10⁻¹²
The values of emission gas rates separated into CO and N2 could be simply obtained with high precision. The total amount of the emission gas rates of CO and N2 coincided with a value obtained from the pressure at AMU 28 directly converted by the mass spectrometer.
Next, from the voltage applying device 102 connected to the image display panel, an image signal of 0.167 psec, 60 Hz, and 15 V was supplied to electron-emitting devices in a single line (600 devices) in a region formed with the Ba getter film. At the same time, a high voltage of 10 KV was applied to the electron-emitting devices by the high-voltage applying device 103 to cause the surface conduction electron-emitting device 300 to emit light. Thus, an image was displayed in the image display device 100. A current value was measured by installing a current probe to a cable that applies a high voltage from the high-voltage applying device 103 to the image display panel 101. The current value was 10 μA for each device. The emission gas rate R (Pa·m3/sec/pA) per unit current value of each gas at this time is shown in Table 4. Note that the same calculation method was also used here as that used to obtain the background Q0 (Pa·m3/sec), and the result was further divided by the DC-converted current value Ie to obtain R. TABLE 4 Emission gas rate (R) of each type of gas at the time of image display DC- converted current P1 P2 C1 C1(P1 − P2) Q0 value Ie R (Pa) (Pa) (m3/sec) (Pa · m3/sec) (Pa · m3/sec) C1(P1 − P2) − Q0 (μA) (Pa · m3/sec/μA) H2 1.99799 × 10⁻⁵ 2.45207 × 10⁻⁷ 1.11362 × 10⁻² 2.19769 × 10⁻⁷ 7.54639 × 10⁻¹⁰ 2.19015 × 10⁻⁷ 60 3.65024 × 10⁻⁹ CH4 8.90714 × 10⁻⁶ 1.09315 × 10⁻⁷ 3.93724 × 10⁻³ 3.46392 × 10⁻⁸ 2.70361 × 10⁻¹² 3.46365 × 10⁻⁸ 5.77274 × 10⁻¹⁰ H2O 4.67965 × 10⁻¹⁰ 5.74321 × 10⁻¹² 3.71207 × 10⁻³ 1.7158 × 10⁻¹² 7.05893 × 10⁻¹⁴ 1.64521 × 10⁻¹² 2.74202 × 10⁻¹⁴ CO 1.11354 × 10⁻⁹ 8.88900 × 10⁻¹¹ 2.97627 × 10⁻³ 3.04964 × 10⁻¹² 3.04686 × 10⁻¹² 2.77805 × 10⁻¹⁵ 4.63009 × 10⁻¹⁷ N2 4.06000 × 10⁻⁷ 4.90800 × 10⁻⁹ 2.97627 × 10⁻³ 1.19376 × 10⁻⁹ 3.00571 × 10⁻¹¹ 1.16370 × 10⁻⁹ 1.93950 × 10⁻¹¹ O2 4.05712 × 10⁻¹⁰ 4.97920 × 10⁻¹² 2.78405 × 10⁻³ 1.11566 × 10⁻¹² 4.02483 × 10⁻¹³ 7.13179 × 10⁻¹³ 1.18863 × 10⁻¹⁴ Ar 4.30178 × 10⁻¹⁰ 5.27946 × 10⁻¹² 2.49013 × 10⁻³ 1.05805 × 10⁻¹² 5.76668 × 10⁻¹⁴ 1.00039 × 10⁻¹² 1.66731 × 10⁻¹⁴ CO2 9.28079 × 10⁻⁹ 1.13901 × 10⁻¹⁰ 2.37425 × 10⁻³ 2.17644 × 10⁻¹¹ 5.66082 × 10⁻¹² 1.61036 × 10⁻¹¹ 2.68394 × 10⁻¹³
In Table 4, the gas rate R of CO is extremely smaller than the other gas rates. On the other hand, the emission gas rate R of N2 takes a large value. As a result, it was understood that CO was adsorbed to the Ba getter film. The same is true of the other adsorbed gases.
Next, the gas rate R for every line was measured at the time of image display, leading to the same results as in Table 4. Further, the device was driven to make the current value double, with the result that the emission gas amount C1(P1−P2) was increased. However, the emission gas rate R per unit current value was calculated to obtain the same results as in Table 4.
As described above, the emission gas rate of each type of gas at the time when an image was displayed in the image display device 100 as the measurement sample could be calculated quantitatively with high precision. Also, the emission gas rate R of each type of gas is calculated as the emission gas rate R per unit current value, so that the emission gas rate R can be used as the same reference even in the case where the current value varies.
Further, the emission gas rates of CO and N2 can be measured respectively. In the case where CO is used as the getter adsorption gas as will be described in Example 2, the attenuation index of the emission gas rate of CO can be accurately calculated from the emission gas rate of CO. Accordingly, the getter life of the image display device can be accurately calculated. Thus-obtained measurement data of the sample can be used for evaluation as the prediction data for an apparatus (sealed container) that has no exhaust pipe and is to be shipped as the product.
Example
EXAMPLE 2
In Example 2, the image display devices to be the sample and the product were manufactured in the same manner as in Example 1 except that 10 lines of devices (6000 devices) were formed, as shown in FIG. 7, using a mask made of SUS when Ba evaporation was performed to the region in which the Ba getter film 205 was not formed. Then, the sample was used to perform the gas measurement.
From the voltage applying device 102, an image signal of 167 μsec, 60 Hz, and 15 V was supplied to electron-emitting devices in a single line (600 devices) in a region in which the Ba getter film 205 was not formed. At the same time, a high voltage of 10 KV was applied to the electron-emitting devices by the high-voltage applying device 103 to cause the surface conduction electron-emitting device 209 to emit light. Thus, an image was displayed in the image display device 100. The emission gas rate of CO was measured similarly to Example 1.
When the emission gas rate of CO at the time of initial image display (time 1 minute after the image display when the high voltage application is stabilized) is R1 (Pa·m3/sec/μA), and the emission gas rate of CO after the image was displayed for 24 hours is R2 (Pa·m3/sec/μA), the measurement results are shown in Table 5. TABLE 5 Emission gas rate of CO DC- converted current P1 P2 C1 C1(P1 − P2) Q0 value Ie R T (Pa) (Pa) (m3/sec) (Pa · m3/sec) (Pa · m3/sec) C1(P1 − P2) − Q0 (μA) (Pa · m3/sec/μA) 1 4.54965 × 10⁻⁶ 5.16308 × 10⁻⁸ 2.97627 × 10⁻³ 1.33873 × 10⁻⁸ 3.04686 × 10⁻¹² 1.33843 × 10⁻⁸ 60 R1 2.23072 × 10⁻¹⁰ minute 24 1.56785 × 10⁻⁶ 1.73847 × 10⁻⁸ 4.61156 × 10⁻⁹ 4.61156 × 10⁻⁹ R2 7.68594 × 10⁻¹¹ hours
The formula (3) described above was used to obtain the attenuation index K from R1 and R2 of Table 5, resulting in −0.2008. Similarly, the attenuation indices K after 168 hours and after 30000 hours were obtained, resulting in almost the same values as shown in FIG. 9. Therefore, it was proved that the 24-hour measurement was enough to obtain almost the same attenuation index K as that obtained after the image was displayed for a long period of time.
This allowed the attenuation index of the emission gas rate of CO as a gas that is adsorbed to the Ba getter film inside the image display device to be obtained with high precision for a short period of time.
After the attenuation index K of a CO gas was measured, the valve 109 was closed, and the valve 107 was then opened to activate the third ionization vacuum gauge 130 and the fourth ionization vacuum gauge 131. The total pressures inside the first gas chamber 122 and the second gas chamber 123 were measured by the third ionization vacuum gauge 130 and the fourth ionization vacuum gauge 131, respectively. After the pressure became stable, the valves 107 and 134 were closed, and the valve of the gas bomb 132 filled with 99.99%-purity CO was opened. The valve 115 was then opened, and the mass flow controller 133 was opened to introduce CO into the second gas chamber 123 at 3.4×10⁻⁴ Pa·m3/sec. After approximately 30 minutes elapsed while maintaining this state, the pressures inside the third ionization vacuum gauge 130 and the fourth ionization vacuum gauge 131 became stable. After the pressures were stabilized, the valve 135 was closed, and as soon as the valve 107 was opened, the measurement for the pressure P3 of the third ionization vacuum gauge 130 and the pressure P4 of the fourth ionization vacuum gauge 131 was started. The pressures P4 and P3 at the start of measurement were 1×10⁻¹ Pa and 5.9×10⁻² Pa, respectively. The time that was taken until the pressures P4 and P3 became almost the same, was 18 hours.
After the measurement, the valves 107 and 115 and the mass flow controller 133 were closed. Then, the valves 134 and 135 were opened to exhaust CO.
FIG. 10 shows a relationship between a time and an adsorption gas rate of CO. The formula (2) was used to calculate the total gas amount of CO adsorbed to the Ba getter film, resulting in W=4.87×10⁻³ Pa·m3. (Considering that an area of the Ba getter is 90% of the image display panel,) the formula (4) was used to calculate Tend based on the obtained total gas amount W of CO adsorbed to the Ba getter film and the emission gas rate attenuation index K of CO, with the result that Tend was 40887 hours.
An image was displayed in the image display device used in Example 1 under the same conditions, and the luminance was measured using the luminance meter 801. The initial luminance was 600 cd/m2. The elapsed time until the luminance of the image display device became half was measured, resulting in 41000 hours. At the same time, the gas rate of CO was measured. As a result, after 40500 hours, an increase in gas rate was observed. This is because the Ba getter film did not adsorb the CO gas any longer.
Example
EXAMPLE 3
In Example 3, an Ar gas instead of CO was introduced to the apparatus in the same manner as in Example 2 except that the image display panel 101 was the same as that of Example 1. The purity of the Ar gas to be used was 99.9999%. Before introducing the Ar gas, the valve 110 was closed and the valve 109 was opened. When the pressure of the first ionization vacuum gauge 126 became 10−6 Pa, the valve 107 was closed. When the partial pressure of the gas was measured by the first mass spectrometer 127, the main gas was Ar, and the partial pressure of Ar was approximately 10−6 Pa. The background before this measurement, that is, before the Ar gas was introduced had been 2.5×10⁻¹¹ Pa.
Next, an image was displayed in the image display device 100 under the same conditions as in Example 1. The initial current value was 10 μA per unit device, and a measurement was performed as to how much current is maintained comparing with the current value after 24 hours. The similar measurement was performed in the case of the Ar gas pressures of 10−5 Pa and 10−4 Pa. The measurement results are shown in Table 6. Note that as a reference, a retention at the time when the Ar gas was not introduced is also shown. TABLE 6 Ar gas pressure and retention of current value Ie Ar gas Initial Current value pressure current after 24 hours Retention (Pa) value (μA) (μA) (%) Ref 10 9.94 99.4 10−6 10 9.93 99.3 10−5 10 9.05 90.5 10−4 10 8.01 80.1
When the Ar gas pressure became larger than 10−5 Pa, the retention became small. From the pressure around 10−5 Pa, influences of the Ar gas pressure on the surface conduction electron-emitting device as the electron source were observed. With regard to the gasses other than Ar, the evaluation of influences of the gases on the electron source can be performed similarly with high precision by a simple method.
According to the embodiments of the present invention, the sealed container, the manufacturing method therefor, the gas measuring method, and the gas measuring apparatus for implementing the gas measuring method are used to produce the following effects.
1. The image display device according to the present invention is seal-bonded in a vacuum in a state where the exhaust pipe having the breakable vacuum isolating member is connected to the sealed container at the time of manufacturing the sealed container. Accordingly, it becomes possible to perform the gas measurement for the emission gas rate or the like while maintaining the vacuum atmosphere inside the image display device.
Further, the exhaust pipe having the vacuum isolating member for connecting to the measuring apparatus is previously provided to the plate. Accordingly, the degasification can be sufficiently performed on the display device, the degasification from the member composing the display device can be suppressed to a minimum, and the emission gas rate at the time when an image is displayed in the image display device can be accurately measured.
Further, there is no trouble such as a leak or a damage which occurs when the image display device that has become a sealed container is formed with a hole later and attached with the exhaust pipe for measurement. In addition, glass fragments generated at the time of puncturing the glass are kept from being scattered inside the image display device, thereby suppressing discharge due to foreign matters such as glass fragments when displaying an image.
2. If necessary, the exhaust pipe is installed on the side of the plate to which the phosphor and the getter are formed, whereby the measurement can be performed without influencing the electron radiation from the electron source.
If the bellows are provided to the exhaust pipe having the breakable vacuum isolating member on the side to be connected to the plate as necessary, the exhaust pipe can be bent, facilitating the handling at the steps following the attaching of the exhaust pipe. In addition, after attaching the exhaust pipe having the breakable vacuum isolating member to the gas measuring apparatus, the bellows can absorb a thermal strain, a mechanical impact force, or the like, thereby preventing the exhaust pipe from being damaged.
If the total pressure before and after the orifice having a known conductance and provided to the measuring chambers or the partial pressure of each type of gas is measured as necessary, the conductance value of the orifices can be used to quantitatively evaluate the emission gas rate of each type of gas at the time of image display in the image display device. In addition, if the emission gas rate is measured as the emission gas rate per unit current value, the emission gas rate can be quantitatively evaluated as the emission gas rate that is not influenced by the level of the current amount for electron radiation from the electron source. If the emission gas rate is measured when the entire image area is not displayed but partial area is displayed, the emission gas rate at the time of displaying the entire image area can be predicted.
Also, in the case of measuring the partial pressure of each type of gas, the mass spectrometers are respectively provided as necessary to the two measuring chambers divided by the orifice. Therefore, the emission gas rates of the types of gases having the same molecular weight (mass number) such as CO and N2 can be easily separated by solving the simultaneous equations based on a relational expression between the pressure and a peak intensity by use of a cracking pattern. Thus, the measurement of the emission gas rate of each type of gas becomes possible. Accordingly, if the emission gas rate is measured in one image display device, the emission gas rate in another image display device can be easily predicted.
Further, the emission gas rate of each type of gas can be accurately grasped. Accordingly, the attenuation index of the adsorption gas rate of the getter adsorption gas used for the measurement of the getter lifetime described later can be accurately calculated.
If the total pressure before and after the orifice having a known conductance and provided to the gas chamber is measured as necessary, the conductance value of the orifice can be used to quantitatively evaluate the gas rate of the introduced gas.
Further, by introducing the getter adsorption gas from the gas chamber as necessary, a constant amount of gas can be supplied to the image display device at a fixed rate. Accordingly, the total adsorption gas amount of the getter can be quantitatively evaluated with high precision.
Since each type of gas can be introduced in a constant amount at a fixed rate, an arbitrary gas is introduced as necessary to display an image in the image display device, thereby making it possible to accurately evaluate the influences of the type of gas on the electron-emitting characteristics of the electron source.
If the region to which the getter is not formed is provided as necessary to part of the plate including the phosphor and the getter, by measuring the emission gas rate of the getter adsorption gas in the region to which the getter is not formed at the time of displaying an image in the region for a short period of time, the attenuation index of the emission gas rate of the getter adsorption gas can be obtained. Next, by measuring the total adsorption gas amount of the getter according to introduction of the getter adsorption gas, the relational expression between the attenuation index of the emission gas rate of the getter adsorption gas and the total adsorption gas amount of the getter is solved. Accordingly, the getter lifetime can be easily calculated, and the life of the sealed container for the image display device can be easily predicted with high precision in a short period of time.
Further, if barium or a barium alloy is used as the getter and CO is used as the getter adsorption gas as necessary, the lifetime of the getter inside the image display device can be measured with high precision., and the life of the image display device can be accurately predicted.
Login to view more PUM


Description & Claims & Application Information
We can also present the details of the Description, Claims and Application information to help users get a comprehensive understanding of the technical details of the patent, such as background art, summary of invention, brief description of drawings, description of embodiments, and other original content. On the other hand, users can also determine the specific scope of protection of the technology through the list of claims; as well as understand the changes in the life cycle of the technology with the presentation of the patent timeline. Login to view more.
Login to view more Similar technology patents
Content-oriented load equalizing method and apparatus
InactiveCN1489069AHigh precisionLow costProgram controlMemory systemsDynamical optimizationIp address
Owner:HUAWEI TECH CO LTD
Precise positionable and compensable heavy-load mechanical arm
ActiveCN103753526AIncrease flexibilityHigh precisionProgramme-controlled manipulatorGripping headsAutomatic controlManipulator
Owner:CHONGQING JIAOTONG UNIVERSITY
Method and device for forecasting reservoir yield
Owner:PETROCHINA CO LTD
Single target tracking method based on convolution neural network
InactiveCN106709936AImprove robustnessHigh precisionImage enhancementImage analysisNetwork modelConvolution
Owner:BEIJING UNIV OF TECH
Binocular camera-based high-precision visual sense positioning map generation system and method
InactiveCN105674993AHigh precisionInstruments for road network navigationCharacteristic pointBinoculars
Owner:WUHAN KOTEI TECH CORP
Classification and recommendation of technical efficacy words
- Easily calculate
- High precision
Analysis of geometric surfaces by comformal structure
InactiveUS20060013505A1Easily calculateLarge number3D-image renderingThree-dimensional object recognitionMorphingSurface matching
Owner:GEOMETRIC INFORMATICS INC
Radar detector and radar detecting method for WLAN systems according to 802.11 wireless communication standards
ActiveUS20050270218A1Easily calculateData switching by path configurationCommunication jammingPhysicsRadar signals
Owner:WIPRO LTD
Acyltransferase
InactiveUS20060141457A1Easily calculateReduce needSugar derivativesPeptide/protein ingredientsAcyltransferaseNucleotide sequenc
Owner:GENENCOR INT INC
Welding condition determining method, and welding device
Owner:PANASONIC INTELLECTUAL PROPERTY MANAGEMENT CO LTD
Optimizing Control Method and System, Overall Control Apparatus and Local Control Apparatus
InactiveUS20070250184A1Easily calculateReduce time and laborComputer controlForecastingProcess engineeringStorage cell
Owner:HITACHI LTD
System and method for searching for a query
ActiveUS20070011154A1High precisionWeb data indexingSemantic analysisElectronic documentDigital document
Owner:TEXTDIGGER
Parking assist method and parking assist apparatus
InactiveUS20070057816A1High precisionIndication of parksing free spacesSteering partsData conversionImage storage
Owner:AISIN AW CO LTD