
Methods for eliminating false data from comparative data matrices and for quantifying data matrix quality

a technology of data matrices and methods, applied in the field of methods for eliminating false data from comparative data matrices and quantifying data matrix quality, can solve the problems of statistical methods suffering, affecting the quality of data, and significantly impairing the assessment of which genes are significantly expressed in a cell, so as to eliminate unreliable data from data sets

Inactive Publication Date: 2006-10-19
RUSH PRESBYTERIAN ST LUKES MEDICAL CENT
View PDF1 Cites 10 Cited by
  • Summary
  • Abstract
  • Description
  • Claims
  • Application Information

AI Technical Summary

Benefits of technology

[0012] One aspect of the present invention provides a method for directly comparing data sets, or matrices, obtained from at least two individual samples, or at least two composite samples, each made from a small number of individual samples, using equations and filters to generate an algorithm that eliminates unreliable data from the data sets.
[0024] As noted above, one specific system to which the methods of the present invention may be applied is a gene expression profiling system which may also be referred to as a gene microarray assay. Most cells in an organism contain the same gene sequences. However, not all of these genes are used or expressed by the cells at all times. Some genes are expressed at specific times, in specific levels, at a specific developmental stage, or under specific conditions. Determining when a gene is expressed, therefore, helps provide an enhanced understanding of the effects of normal and variant genes on disease pathogenesis. In the microarray assays, the genetic expression profile of one biological sample is compared to the genetic expression profile of a second biological sample in order to identify individual genes whose expression is associated with any biological or pathological phenotypes.
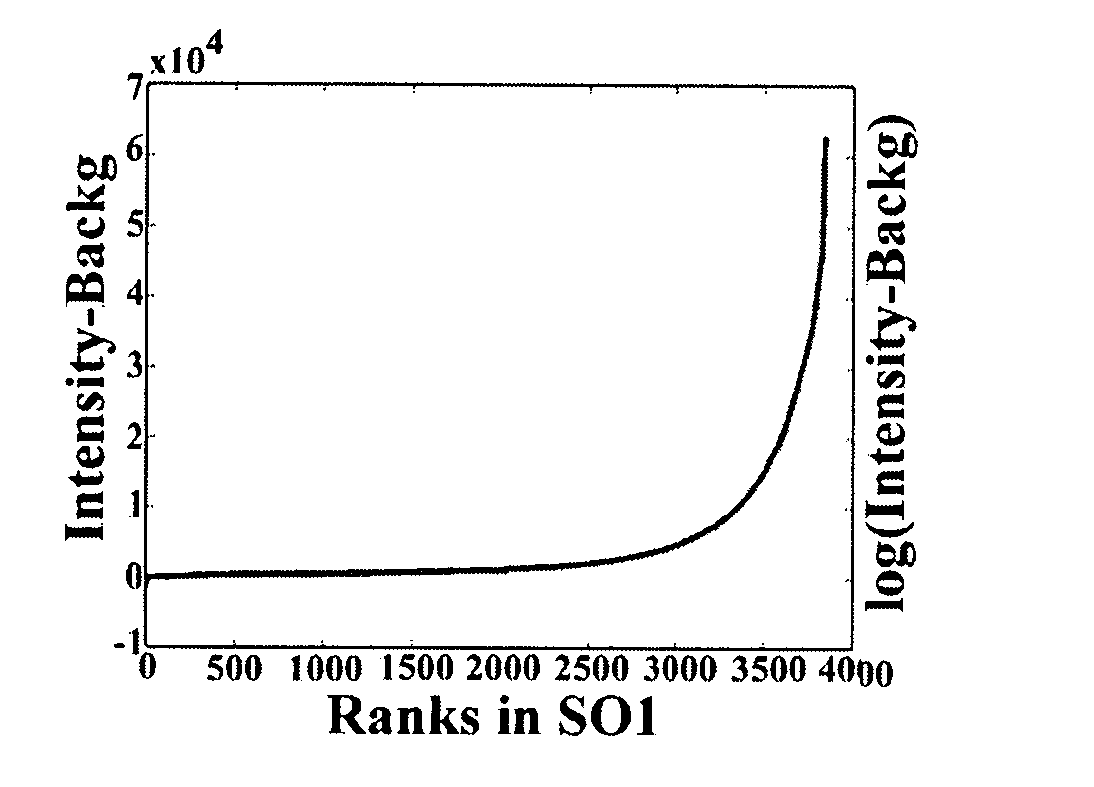
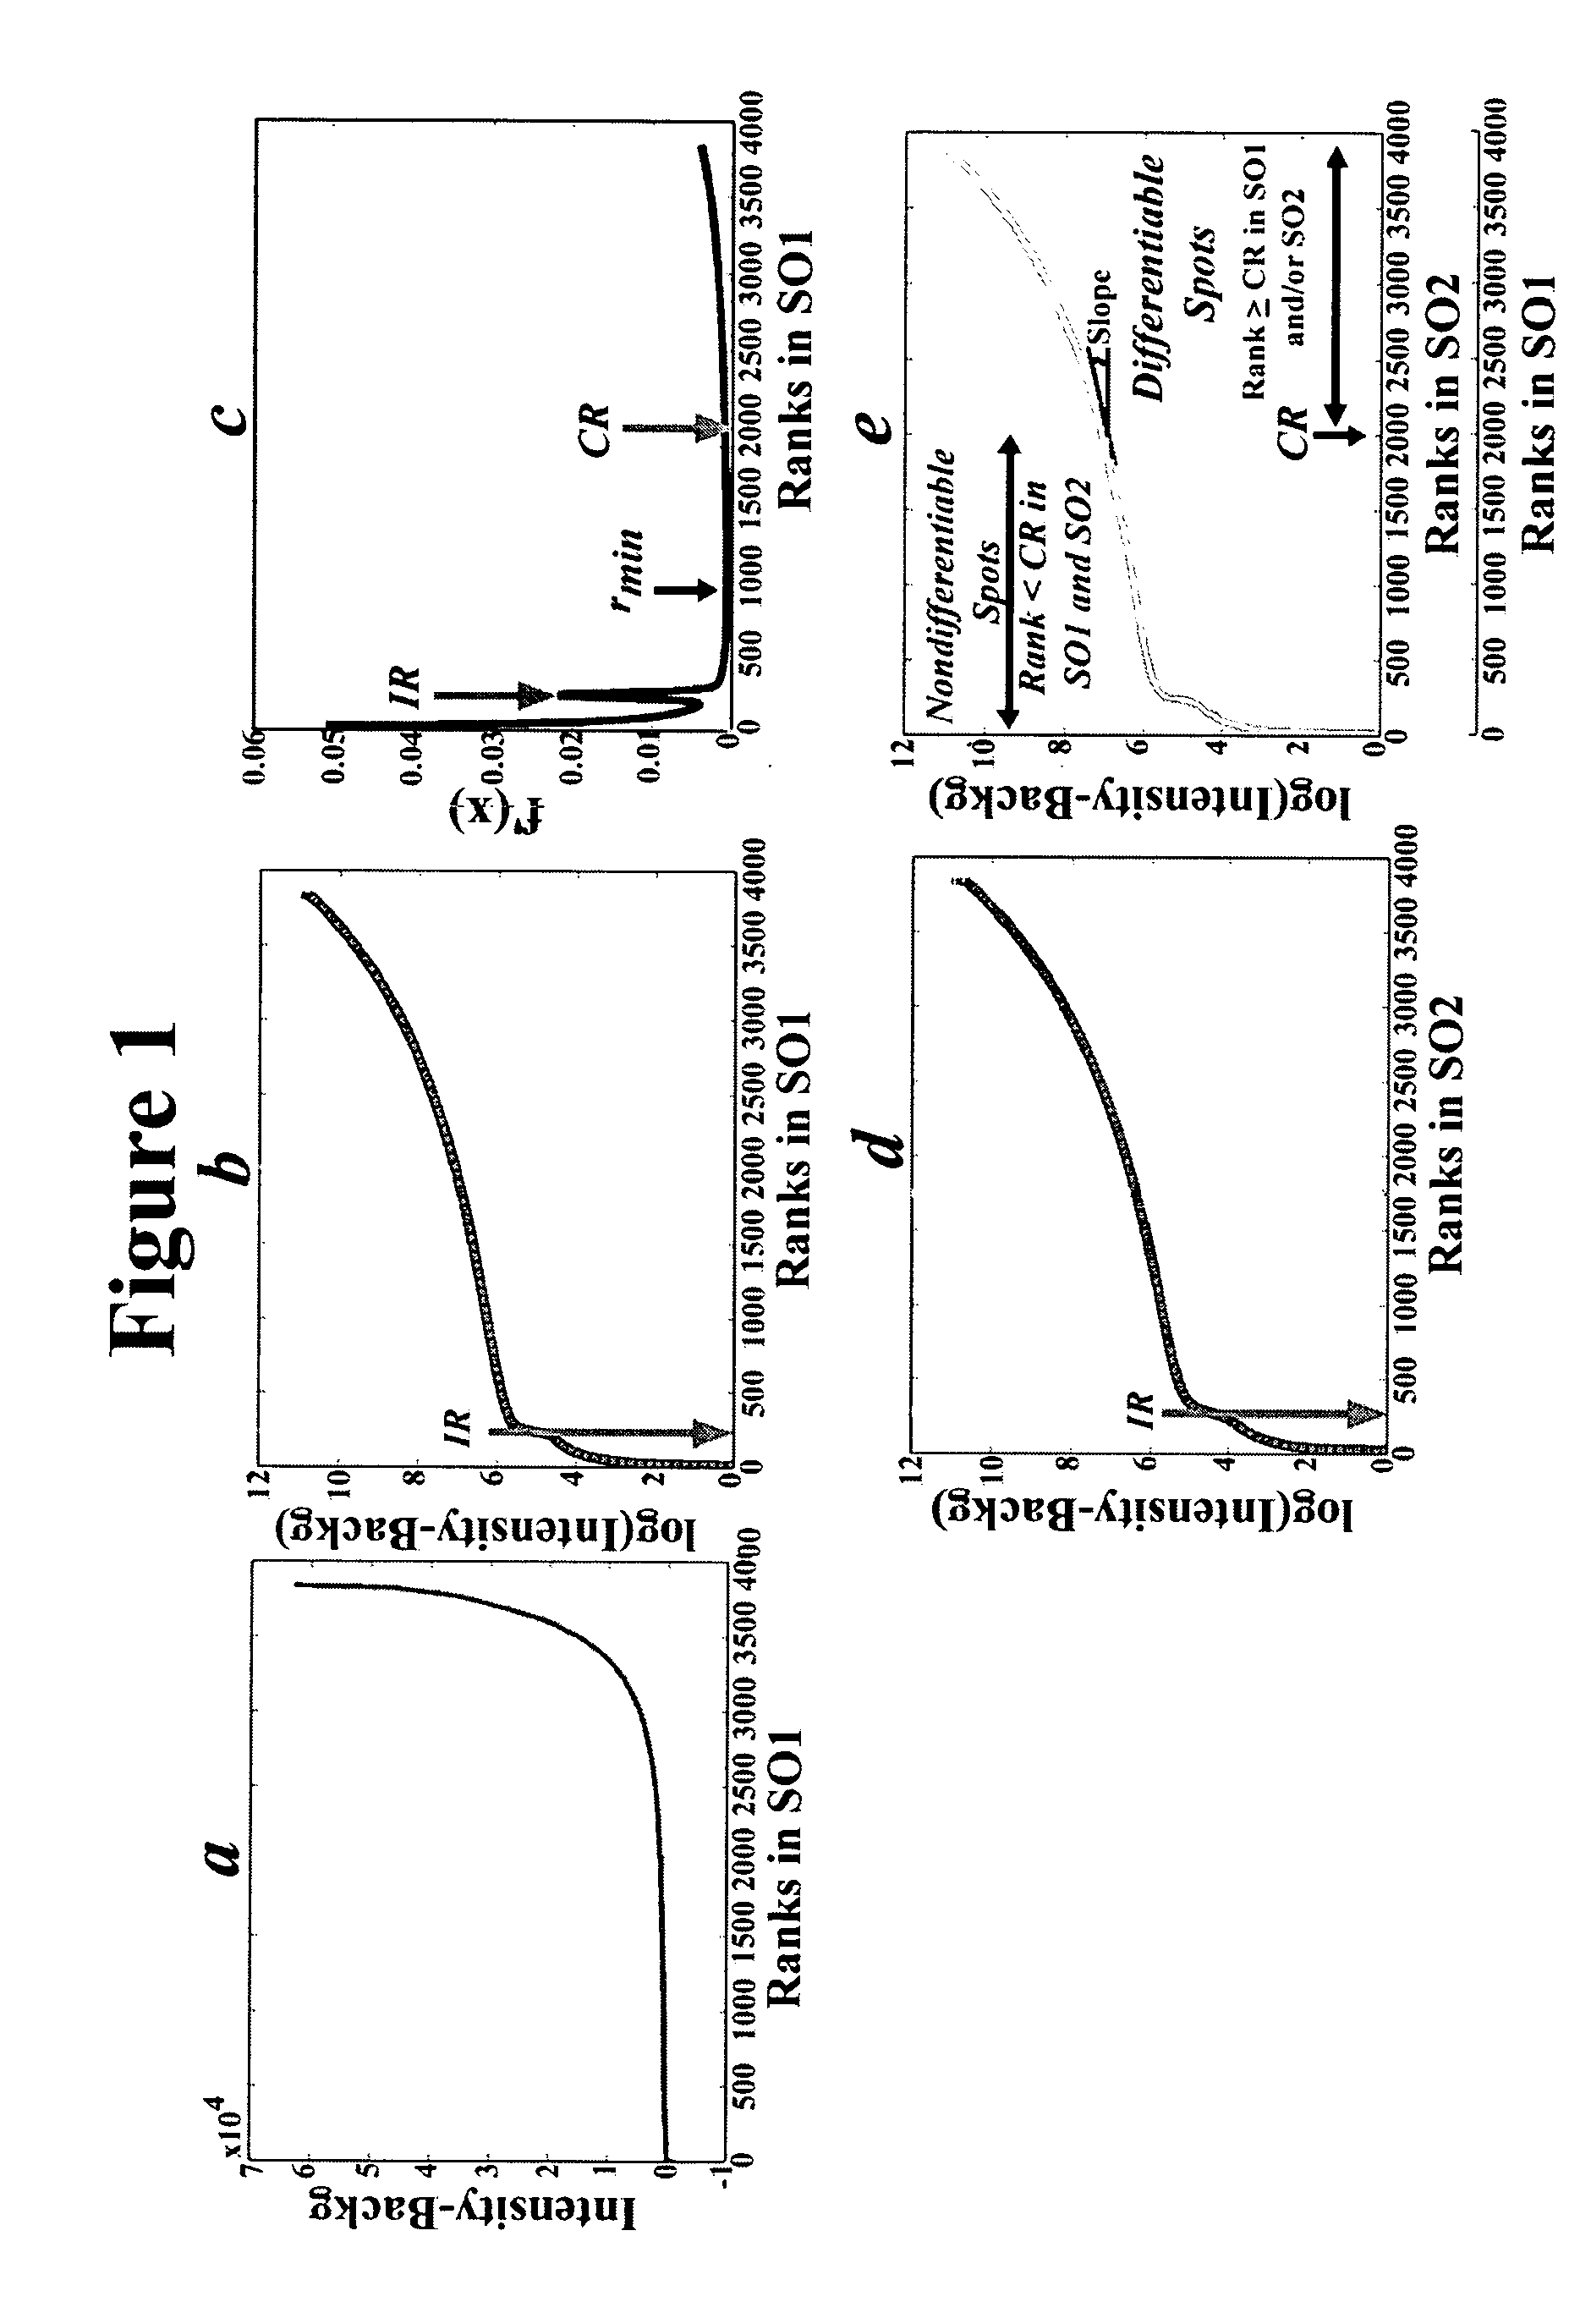
[0029] One embodiment of the present invention provides a method for eliminating insufficiently distinguishable data points (e.g. false expression ratios) from a pair of the above-described data matrices. This method comprises the steps of, ranking the data points of each matrix from highest to lowest according to intensity and plotting the rank versus intensity of the data points for each matrix to generate an experimental curve for each matrix; fitting a smooth curve to each experimental curve to generate a model curve for each matrix, each model curve comprising a first section separated from a second section by an inflection point; eliminating any pair of corresponding data points for which each data point of the pair is below the inflection point of its model curve; and eliminating any pair of corresponding data points for which the rank of each data point of the pair is below a selected cutoff rank between the rank of the data point at the minimum of the derivative of one of the model curves and the rank of the highest ranking data point on the model curve. In this method, the selected cutoff rank provides a “distinguishability criterion” for determining which data points should be eliminated.
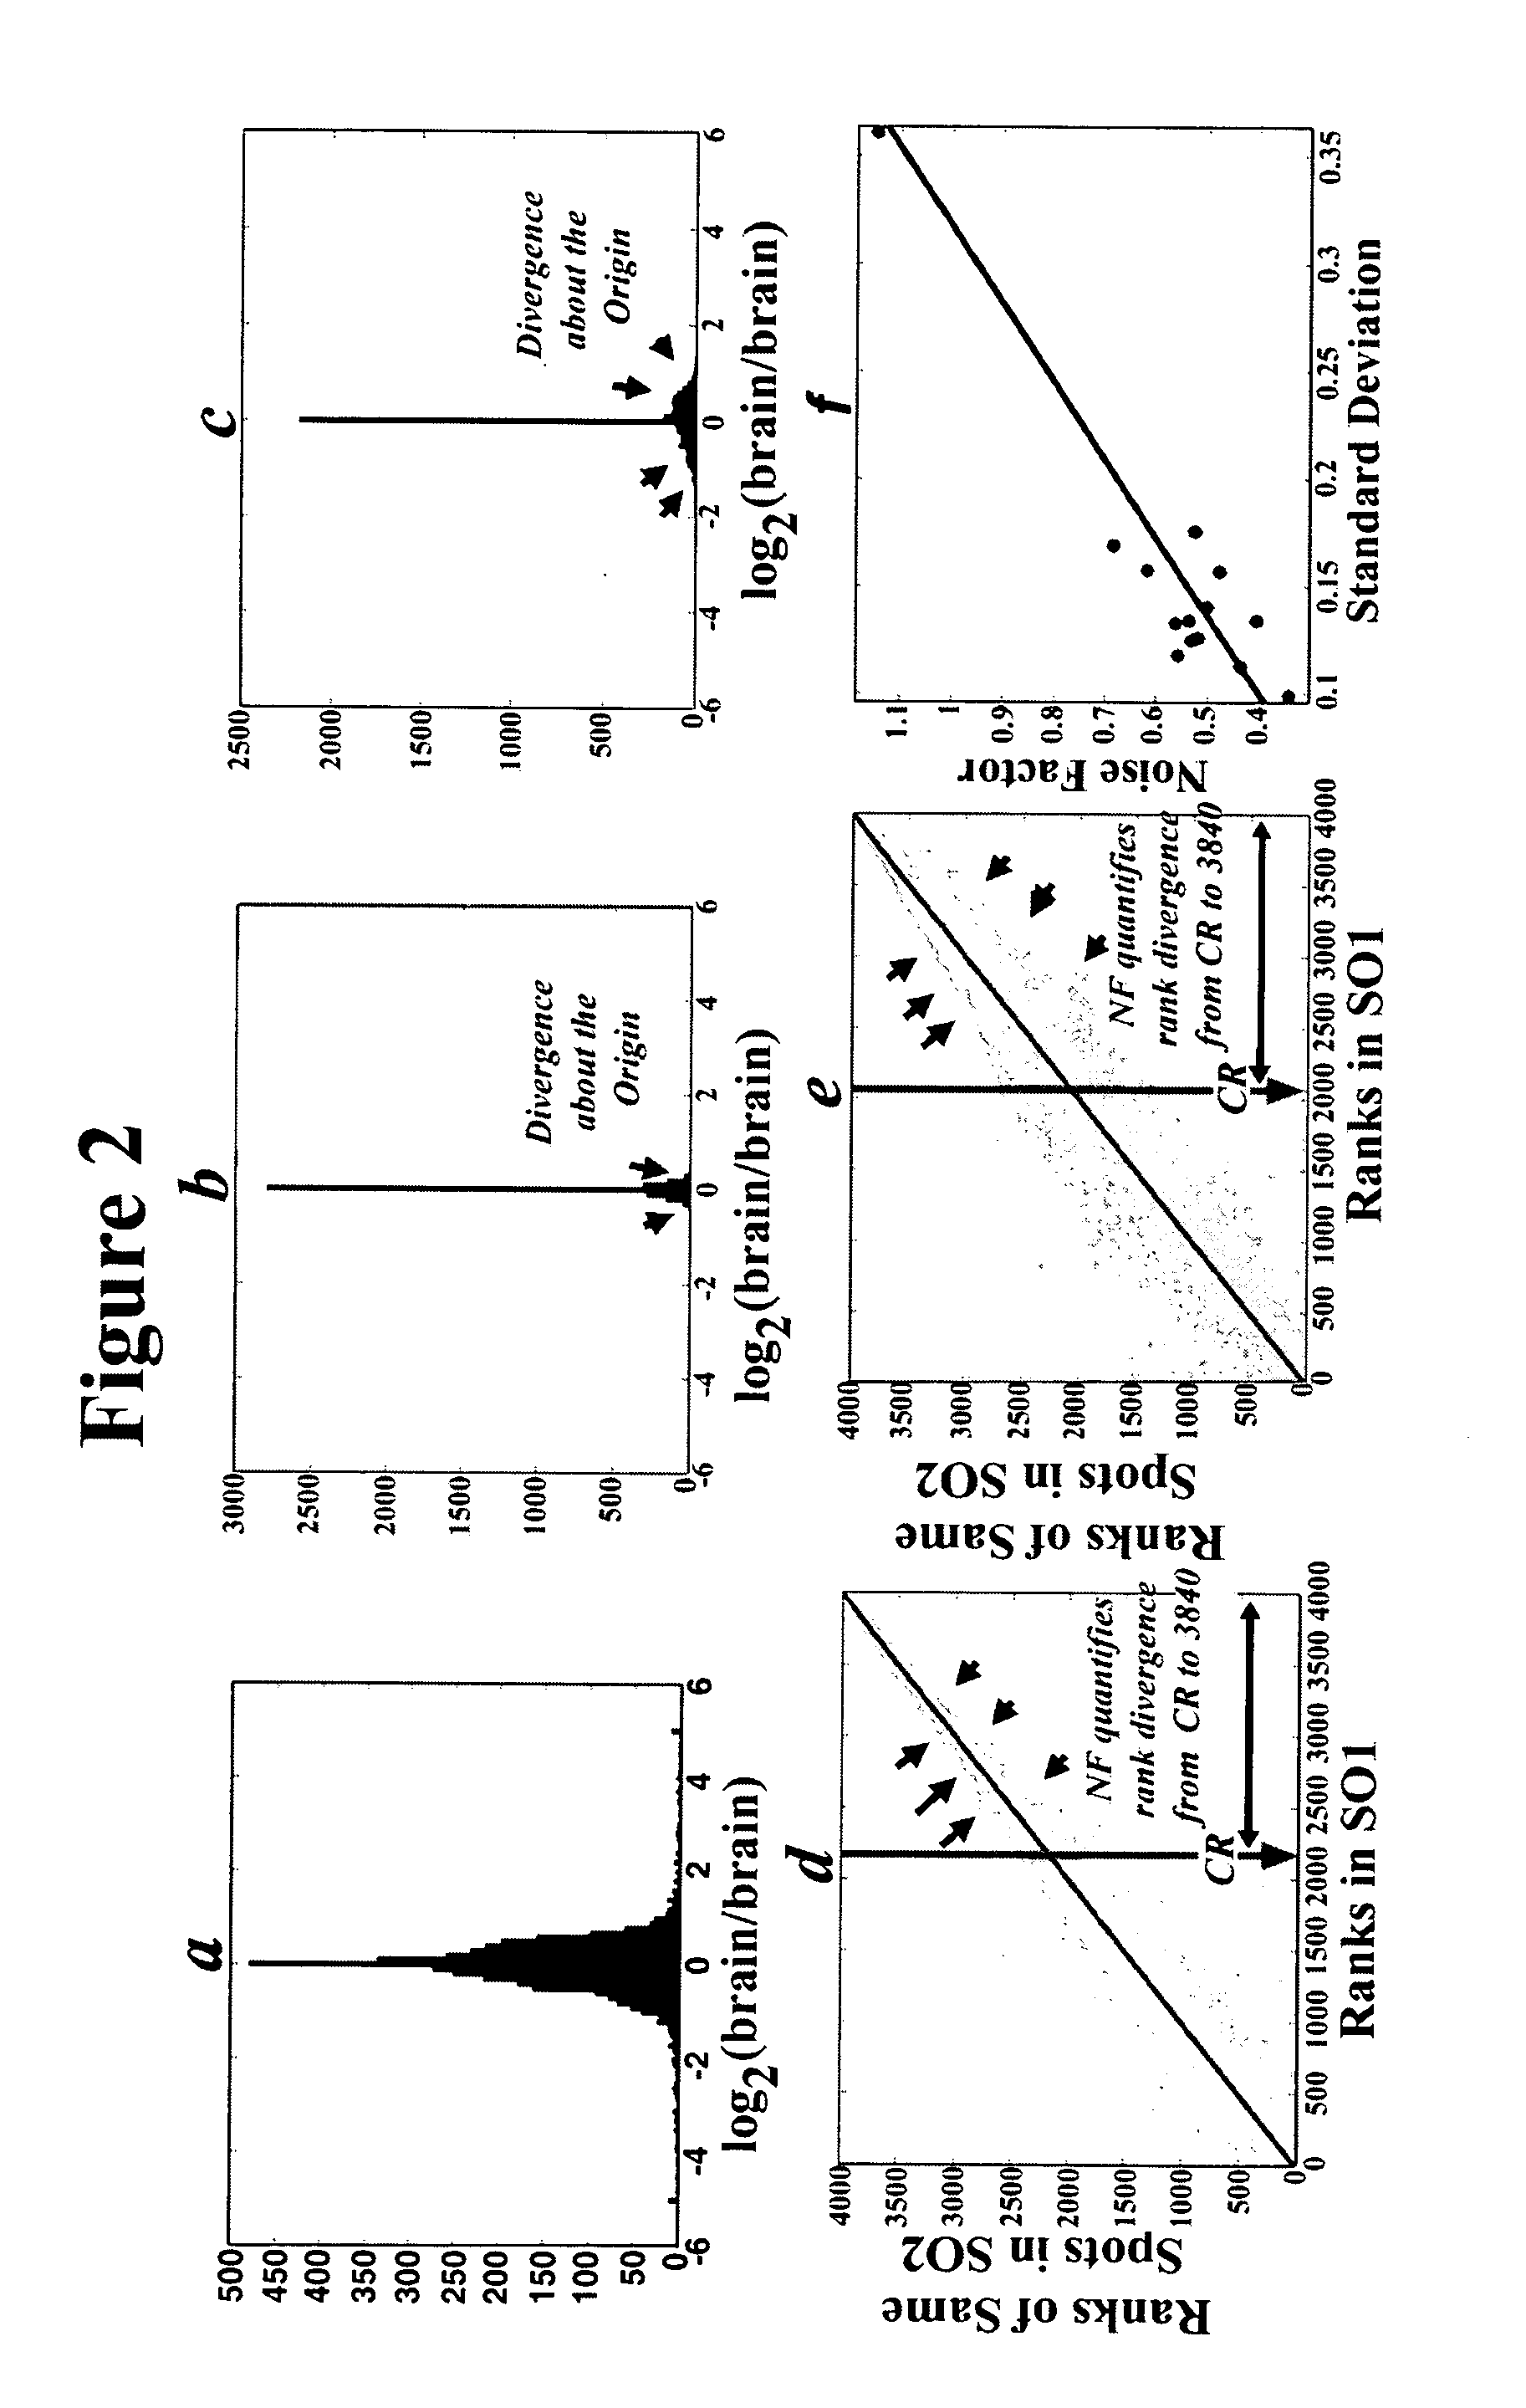
[0031] The method may be extended to further eliminate false differentials from a comparison of two or more replicate data matrix pairs, of the type described above, by further including the steps of determining an intensity ratio for each remaining pair of corresponding data points in each matrix pair, wherein each ratio may be classified as less than, greater than, or substantially equal to one; and eliminating any corresponding pairs of corresponding data points for which the intensity ratios for the corresponding pairs fall into the same category for less than one half of the corresponding pairs.
[0034] When the data matrices are generated from biological samples, the method for eliminating unreliable, or “false”, data from a data set may comprises the steps of, providing a first biological sample and a second biological sample, wherein each biological sample is labeled using at least one detectable label capable of emitting a signal having an intensity; providing at least two replicate arrays of indicator molecules; allowing the first and second biological samples to interact with the indicator molecules in the arrays; inducing the bound samples to emit a signal; measuring the resulting signal intensities to produce at least four data matrix pairs (e.g., by using a probe switching experiment), each matrix comprising a plurality of data points, each data point having an intensity corresponding to the level of interaction between the indicator molecules and the first and second biological samples, wherein each indicator molecule produces one data point in each of the data matrices and further wherein the data points produced by the same indicator molecules are referred to as corresponding data points; identifying and eliminating data points in each data matrix that have intensities below a background noise level; identifying and eliminating any remaining data points that are substantially indistinguishable from other data points in the same data matrix or from their corresponding data points in a matrix pair, wherein data points are substantially indistinguishable if they fail to meet a predetermined distinguishability criterion; determining intensity ratios for the corresponding data points in the at least four matrix pairs, wherein the intensity ratio for each pair of corresponding data points in each matrix pair has a corresponding signal intensity ratio in each of the other matrix pairs; and identifying and eliminating any remaining data points that provide intensity ratios that are substantially irreproducible, wherein intensity ratios are substantially irreproducible if they fail to meet a predetermined reproducibility criterion.

Problems solved by technology

Unfortunately, genome-wide screening is still hampered by the preponderance of false positive data in the gene microarray experimental system.
Such false positive data significantly impairs assessing which genes are significantly expressed in a cell, and what significant changes to such expression are occurring as cell conditions are varied.
These statistical methods suffer from at least two significant drawbacks.
First, they do not permit individual samples to be studied and compared, which defeats the idea that a genetic sample is molecularly unique.
Second, statistical analysis does not entirely eliminate false data.
Validation of the expression of genes is an expensive, time- and labor-consuming process, such that the validation of the expression of thousands of individual genes is not feasible for the typical laboratory.
In addition, an experimental design that compares and contrasts different groups containing several genetically homogeneous samples is not always feasible.
Unfortunately, these attempts have met with limited success in finding analytical methods to eliminate false data to a high degree of specificity.
Unfortunately, present methods for analyzing gene expression profiling experiments do not provide a quantitative method for assessing the quality of a given image relative to other images.

Method used


Image

  • Methods for eliminating false data from comparative data matrices and for quantifying data matrix quality
  • Methods for eliminating false data from comparative data matrices and for quantifying data matrix quality
  • Methods for eliminating false data from comparative data matrices and for quantifying data matrix quality

Examples


example 1

Demonstration of the Algorithm Using Internal Control

[0075] In order to assess the specificity of the algorithm of the present invention, ten probe switching (reverse) experiments comparing normal brain RNA to itself using a 19K microchip and nine experiments using a 1.7K microchip were performed to yield images of heterogeneous quality.

[0076] Methods:

[0077] Samples and Microarrays. Normal brain RNA is obtained by pooling RNA from human occipital lobes harvested and pooled from 4 individuals with no known neurological disease whose brains are frozen less than 3 hours postmortem. The quality of RNA is assayed by gel electrophoresis; only high quality RNA is processed. Total RNA (5-10 μg) is reverse transcribed and the cDNA products labeled by the amino-allyl method and hybridized to the 19K and 1.7K gene microarrays purchased from the Ontario Cancer Institute (Toronto, CA). The slides are scanned at 10 μm by a confocal scanner, (4000XL scanner, Packard Bioscience; Meriden, Conn.)....

example 2

Demonstration of the Algorithm on a Comparative System I

[0082] As a proof of principle, the complete algorithm discussed above is applied to the data of a reverse experiment comparing human meningioma RNA to normal human brain using the 1.7K microarray chip. 21 genes were extracted as sources of real data. The data was validated using real time PCR and by expression profiling of other meningioma samples. The references cited in the results section below are listed at the end of the example.

[0083] Methods:

[0084] Samples and Microarrays. The microarrays were prepared, scanned, and quantified by the methods described in Example 1 above. The meningioma samples were obtained from surgical operations, frozen and stored in liquid nitrogen until the time of use. Total RNA was extracted and transcribed to cDNA which in turn was reacted with the fluorescent probe by the aminoallyl method. Normal brain RNA was pooled from 4 individuals with no known neurological disease whose brains are fro...

example 3

Demonstration of the Algorithm on a Comparative System II

[0094] To explore the idea that genomic expression discovery predicts pathways and functions behind the biological phenotypes of living systems, a tumor was compared to its normal host organ. The expression data accurately predicted activation of signaling pathways and proposed that unbalanced opposing genetic functions create ‘aberrant’ phenotypes. In addition, known molecular interactions revealed a rich network of stimulatory and inhibitory genetic interconnections.

[0095] Microarrays containing 19,200 cDNAs to profile gene expression in 10 meningiomas vs. normal brain were used in the experiment. These studies are described in more detail in J. Biological Chemistry, vol. 278, pages 23830-23833 (2003), which is incorporated herein by reference. Meningiomas were compared to normal brain, its host organ, because both tissue types contain non-tumor cells like blood vessels and cells of lymphocytic lineage. Meningiomas compris...


PUM

PropertyMeasurementUnit
angleaaaaaaaaaa
massaaaaaaaaaa
nuclei acid sequence expression profilingaaaaaaaaaa

Abstract

This invention provides methods for eliminating false data from a comparative analysis of analytical data matrices, such as gene expression microarrays. The invention also provides methods for quantifying the quality of data provided by such comparative assays.

Description

CROSS-REFERENCES TO RELATED APPLICATIONS [0001] This application claims priority to U.S. provisional patent application Ser. No. 60 / 400,911, filed Aug. 2, 2002, The entire disclosure of which is incorporated herein by reference and for all purposes.STATEMENT OF GOVERNMENT INTERESTS [0002] This invention was made with United States government support under Grant Nos. R01-CA81367 and R29-CA78825 from the National Cancer Institute and the National Institutes of Health. The government of the United States has certain rights in the invention.FIELD OF THE INVENTION [0003] This invention generally relates to methods for eliminating false data from a comparative analysis of analytical data matrices, such as gene microarray assays. The invention also relates to methods for quantifying the quality of data provided by such comparative assays. BACKGROUND OF THE INVENTION [0004] A number of advances in medicine, molecular biology, and genetics have led to increased demand for technologies that q...

Claims


Application Information

Patent Timeline
Patent Type & Authority Applications(United States)
IPC IPC(8): G06F19/00G16B25/10G01NG01N33/48
CPCG06F19/20G16B25/00G16B25/10
Inventor FATHALLAH-SHAYKH, HASSAN
Owner RUSH PRESBYTERIAN ST LUKES MEDICAL CENT
Learn More