

Material lifetime data abstraction device and method
- Summary
- Abstract
- Description
- Claims
- Application Information
AI Technical Summary
Benefits of technology
Problems solved by technology
Method used
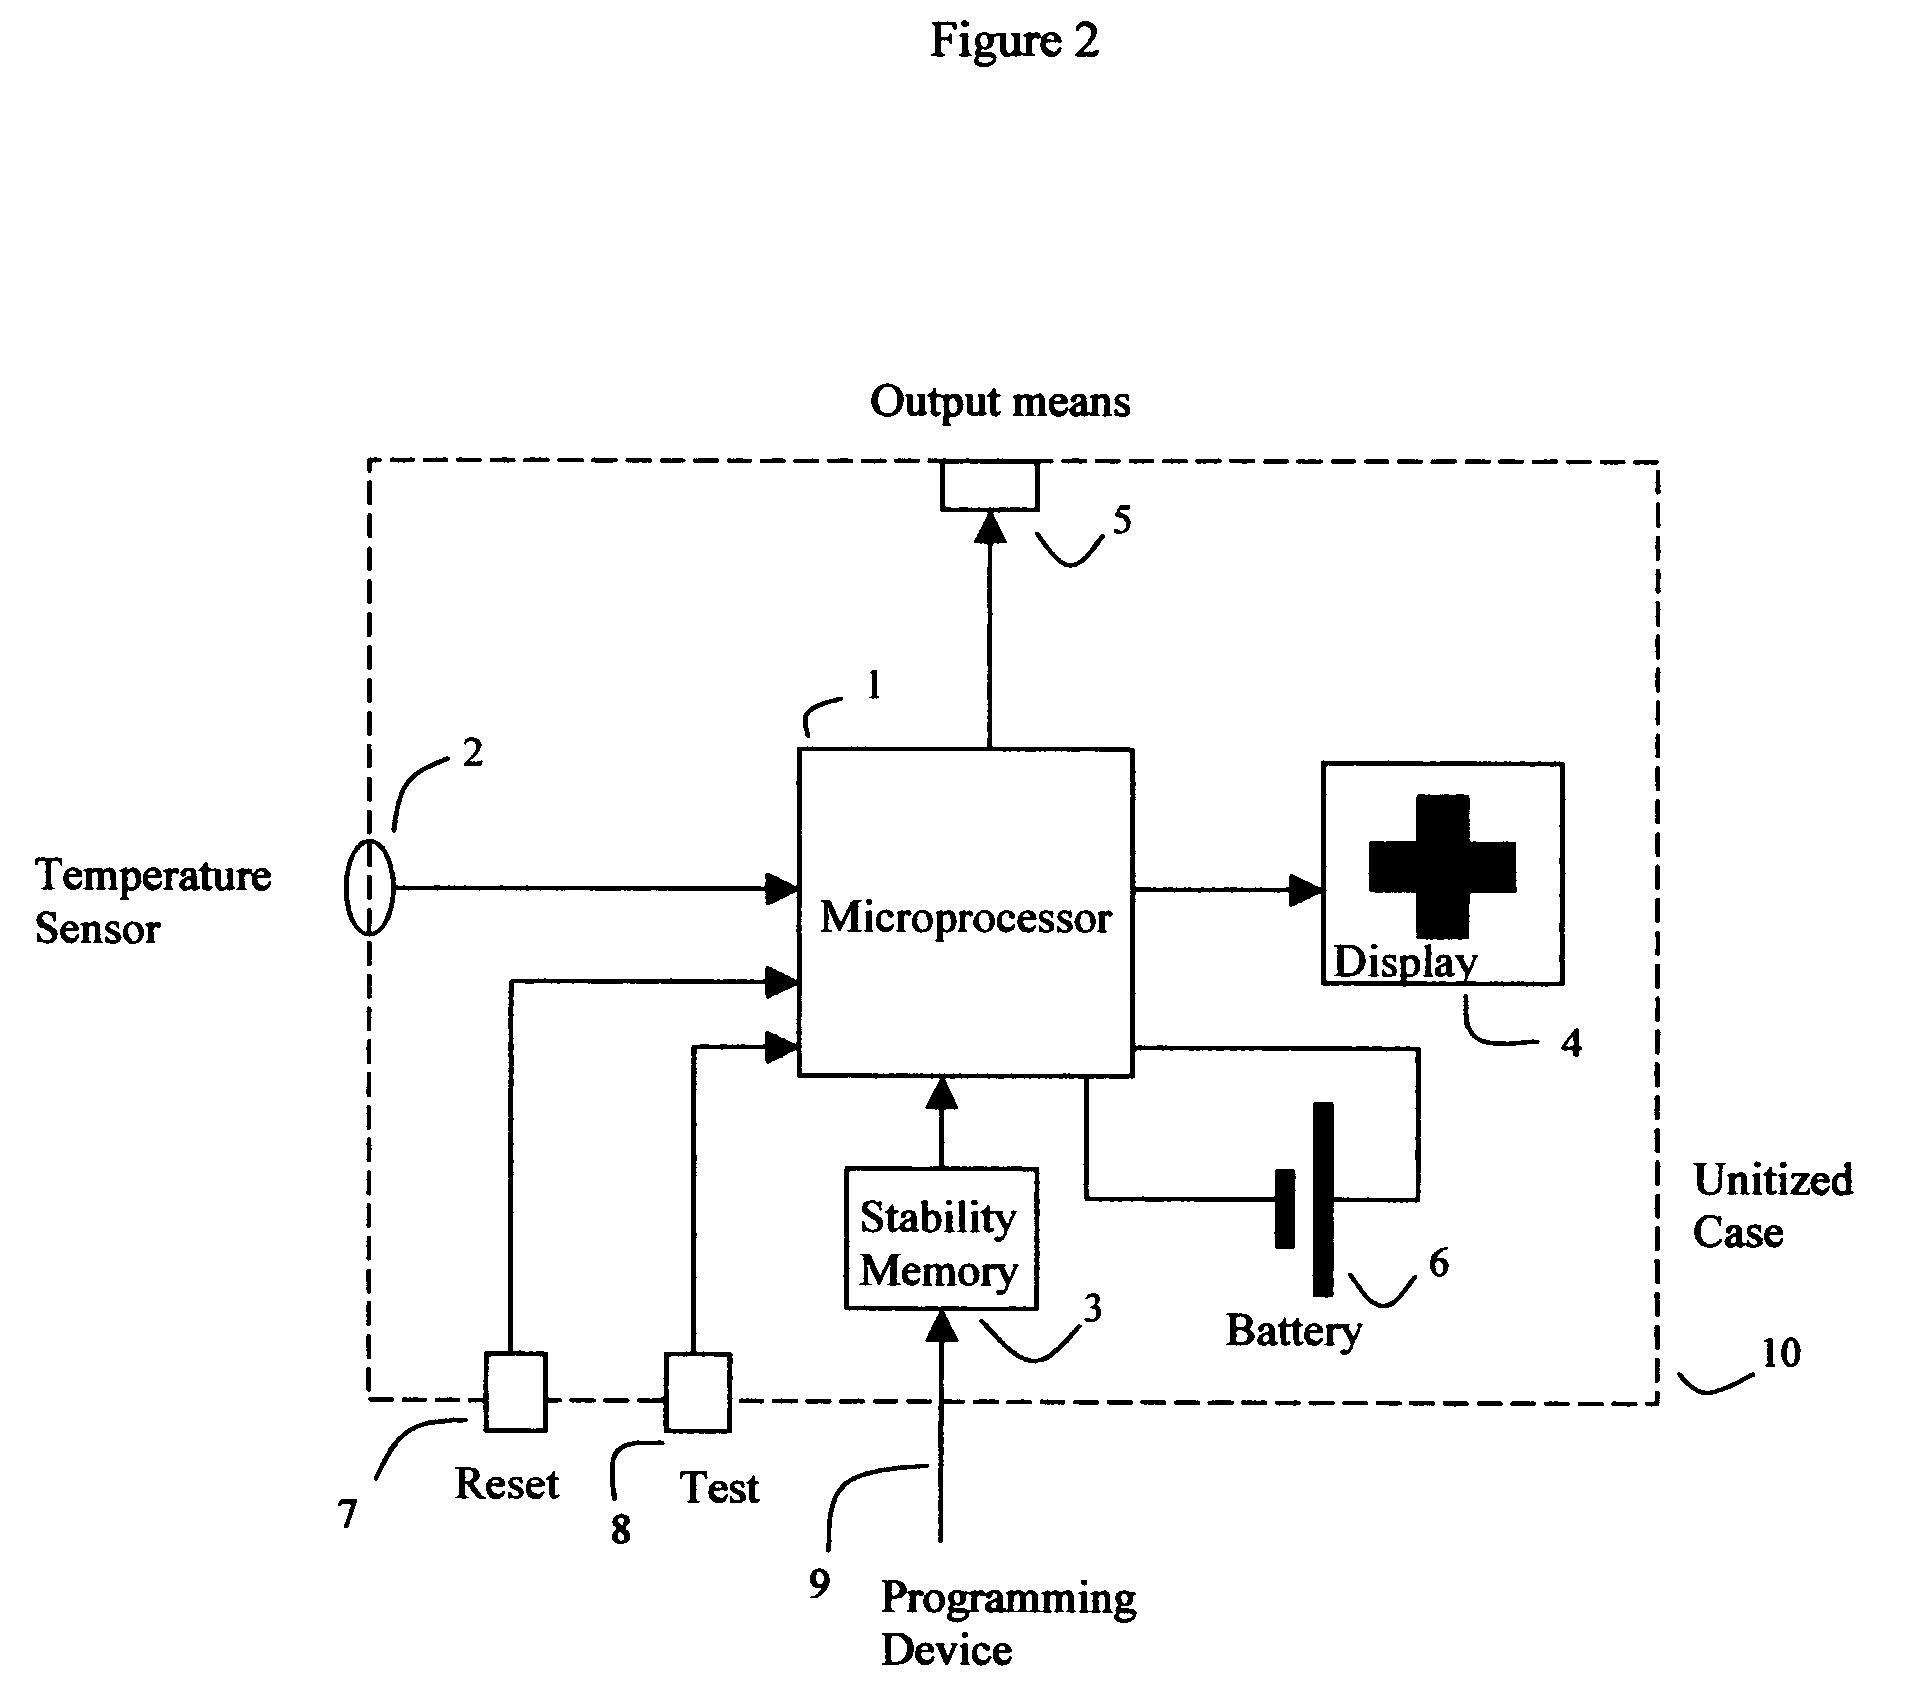
Image

Examples
example 1
Insulin Time-Temperature Monitor
[0129] In order to properly configure the device, the stability of the material of interest should first be characterized. To do this, quantitative “maximum acceptable deterioration” criteria, should be established, and used to determine the material's stability lifetime when the material is stored at a variety of different temperatures. The stability lifetime at the various experimental temperature levels is then determined, and used as input into the stability programming calculations.
[0130] Using the experimental data, a curve or equation is then generated that fits the observed data. This curve is used to calculate the stability lifetime at intermediate temperatures.
[0131] As an example, consider a commonly used injectable drug, insulin. Insulin is commonly carried by traveling diabetics, but will deteriorate if exposed to excessive levels of temperature for too long. The work of Brange et. al. ‘Galenics of Insulin’ [Novo Research Institute, De...
example 2
Other Drug Monitoring Applications
[0156] There are a number of medically important antibiotics, such as the β-Lactam antibiotics (which include Ceftazidime, Cefepime, Imipenem, Meropenem, Cefpirome, and others), which would be most effective if the drugs could be administered by continuous infusion to ambulatory patients. Such continuously infused antibiotics would be highly useful for treating cystic fibrosis, immunocompromised chemotherapy patients (who are at risk for sepsis), and many other conditions.
[0157] However due to the poor thermal stability of the β-Lactam antibiotics, current continuous infusion pump (either mechanical or elastomeric) technology is inadequate. In the liquid form, many of the β-Lactam drugs deteriorate after only a few hours of exposure to temperatures above 25° C. Since body temperature is 37° C., conventional ambulatory infusion pumps, which usually are worn underneath clothing, typically expose such drugs to unacceptable levels of thermal stress.
[...
example 3
Blood-Bank Applications
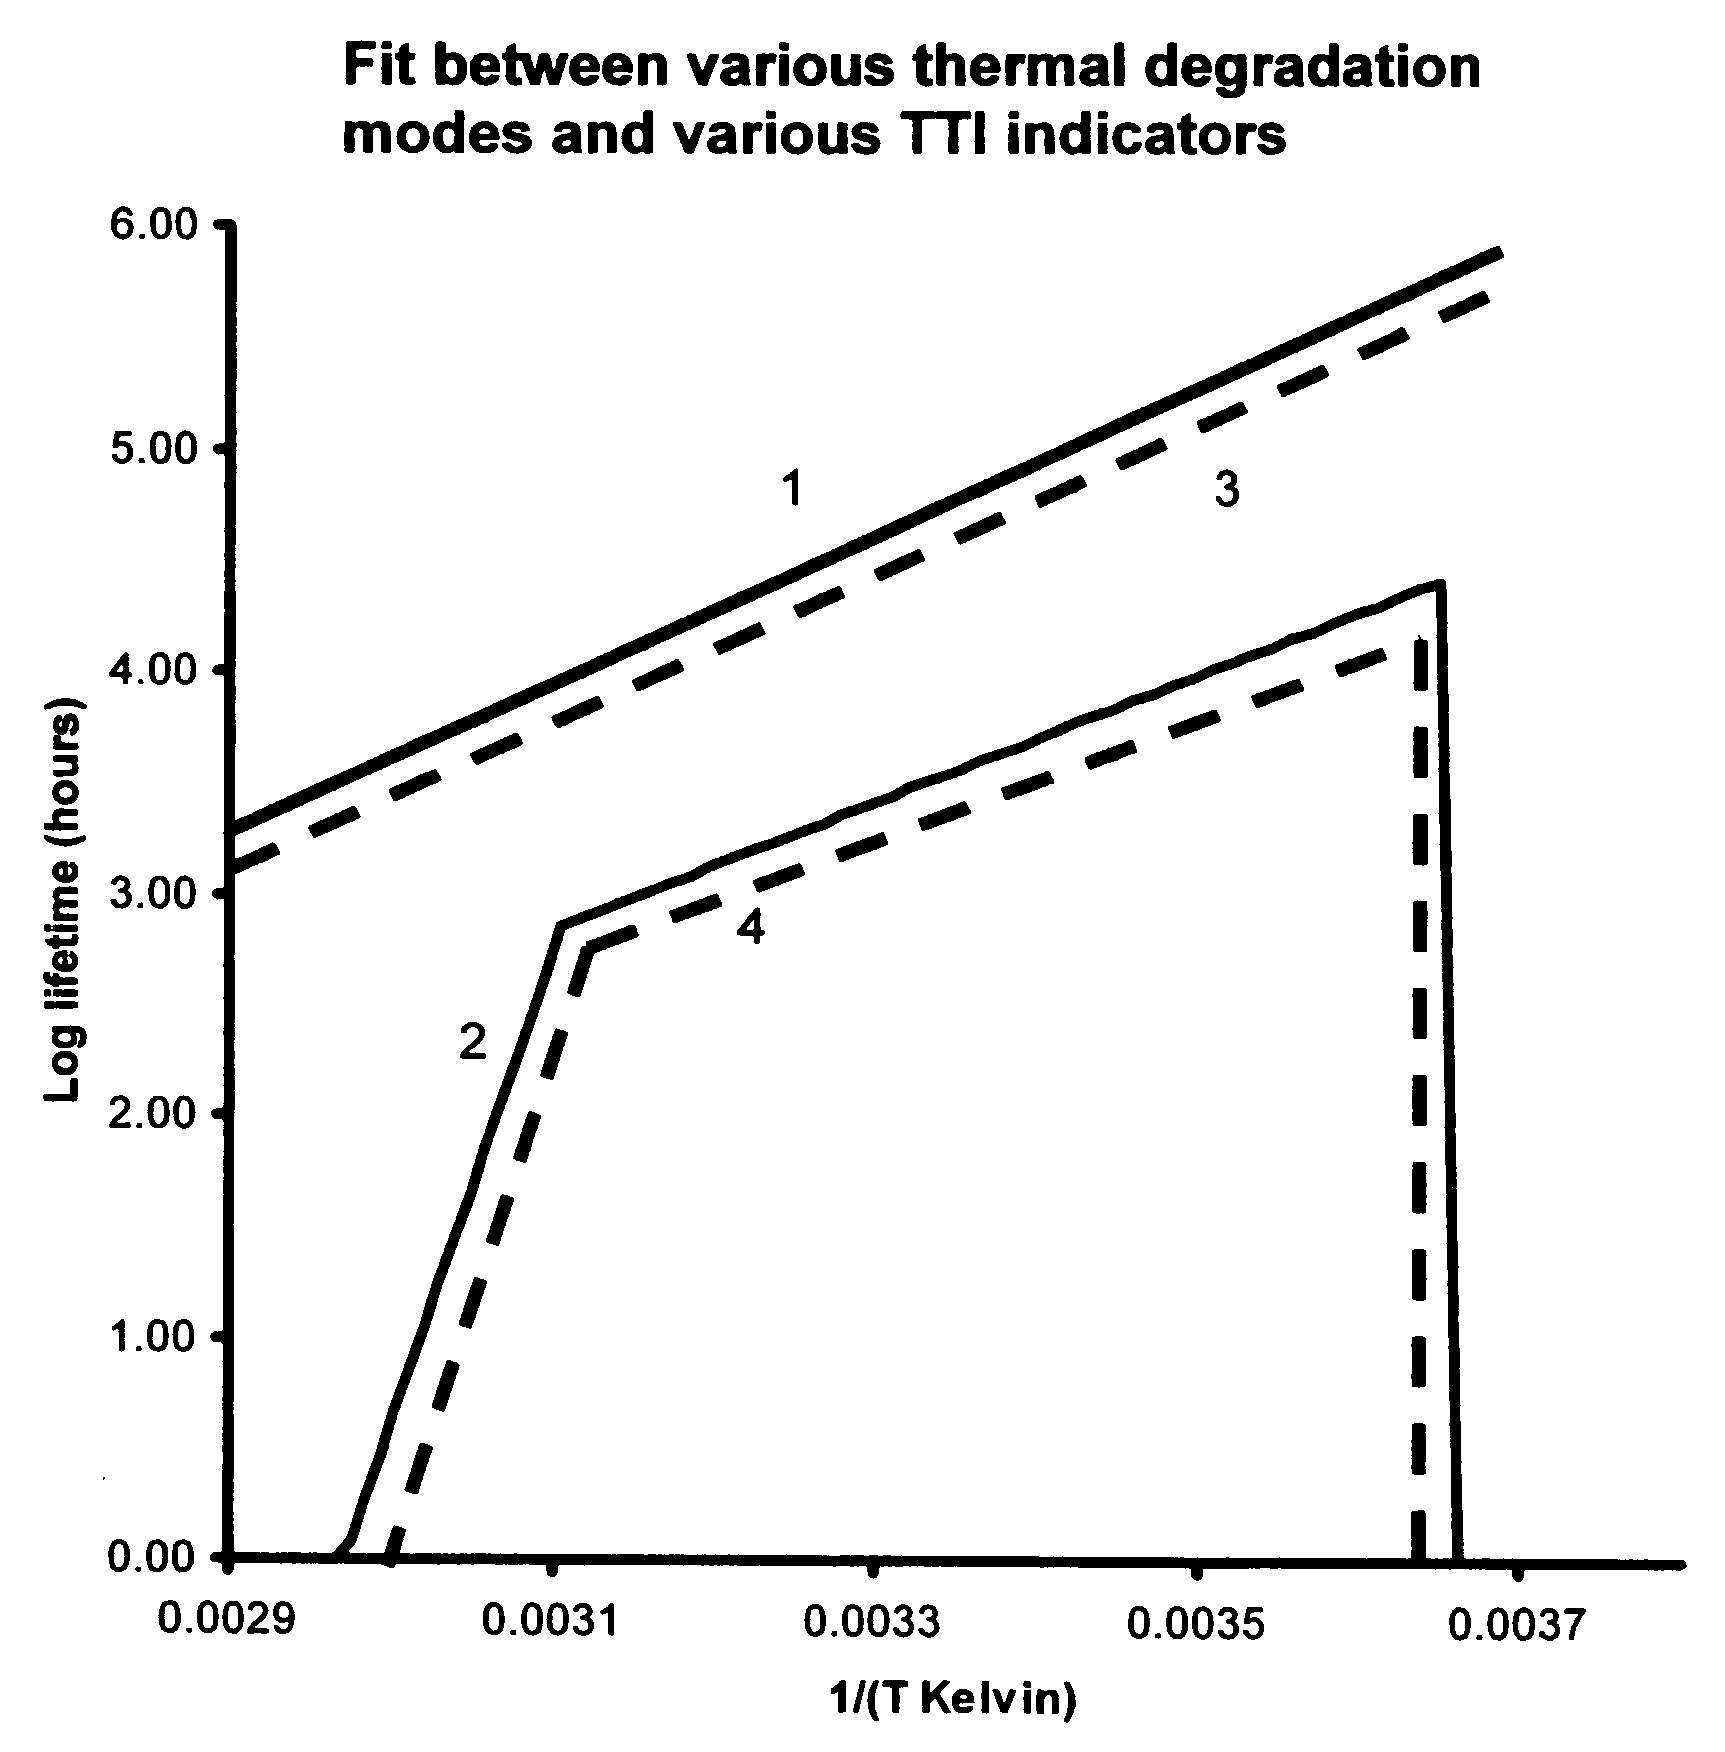
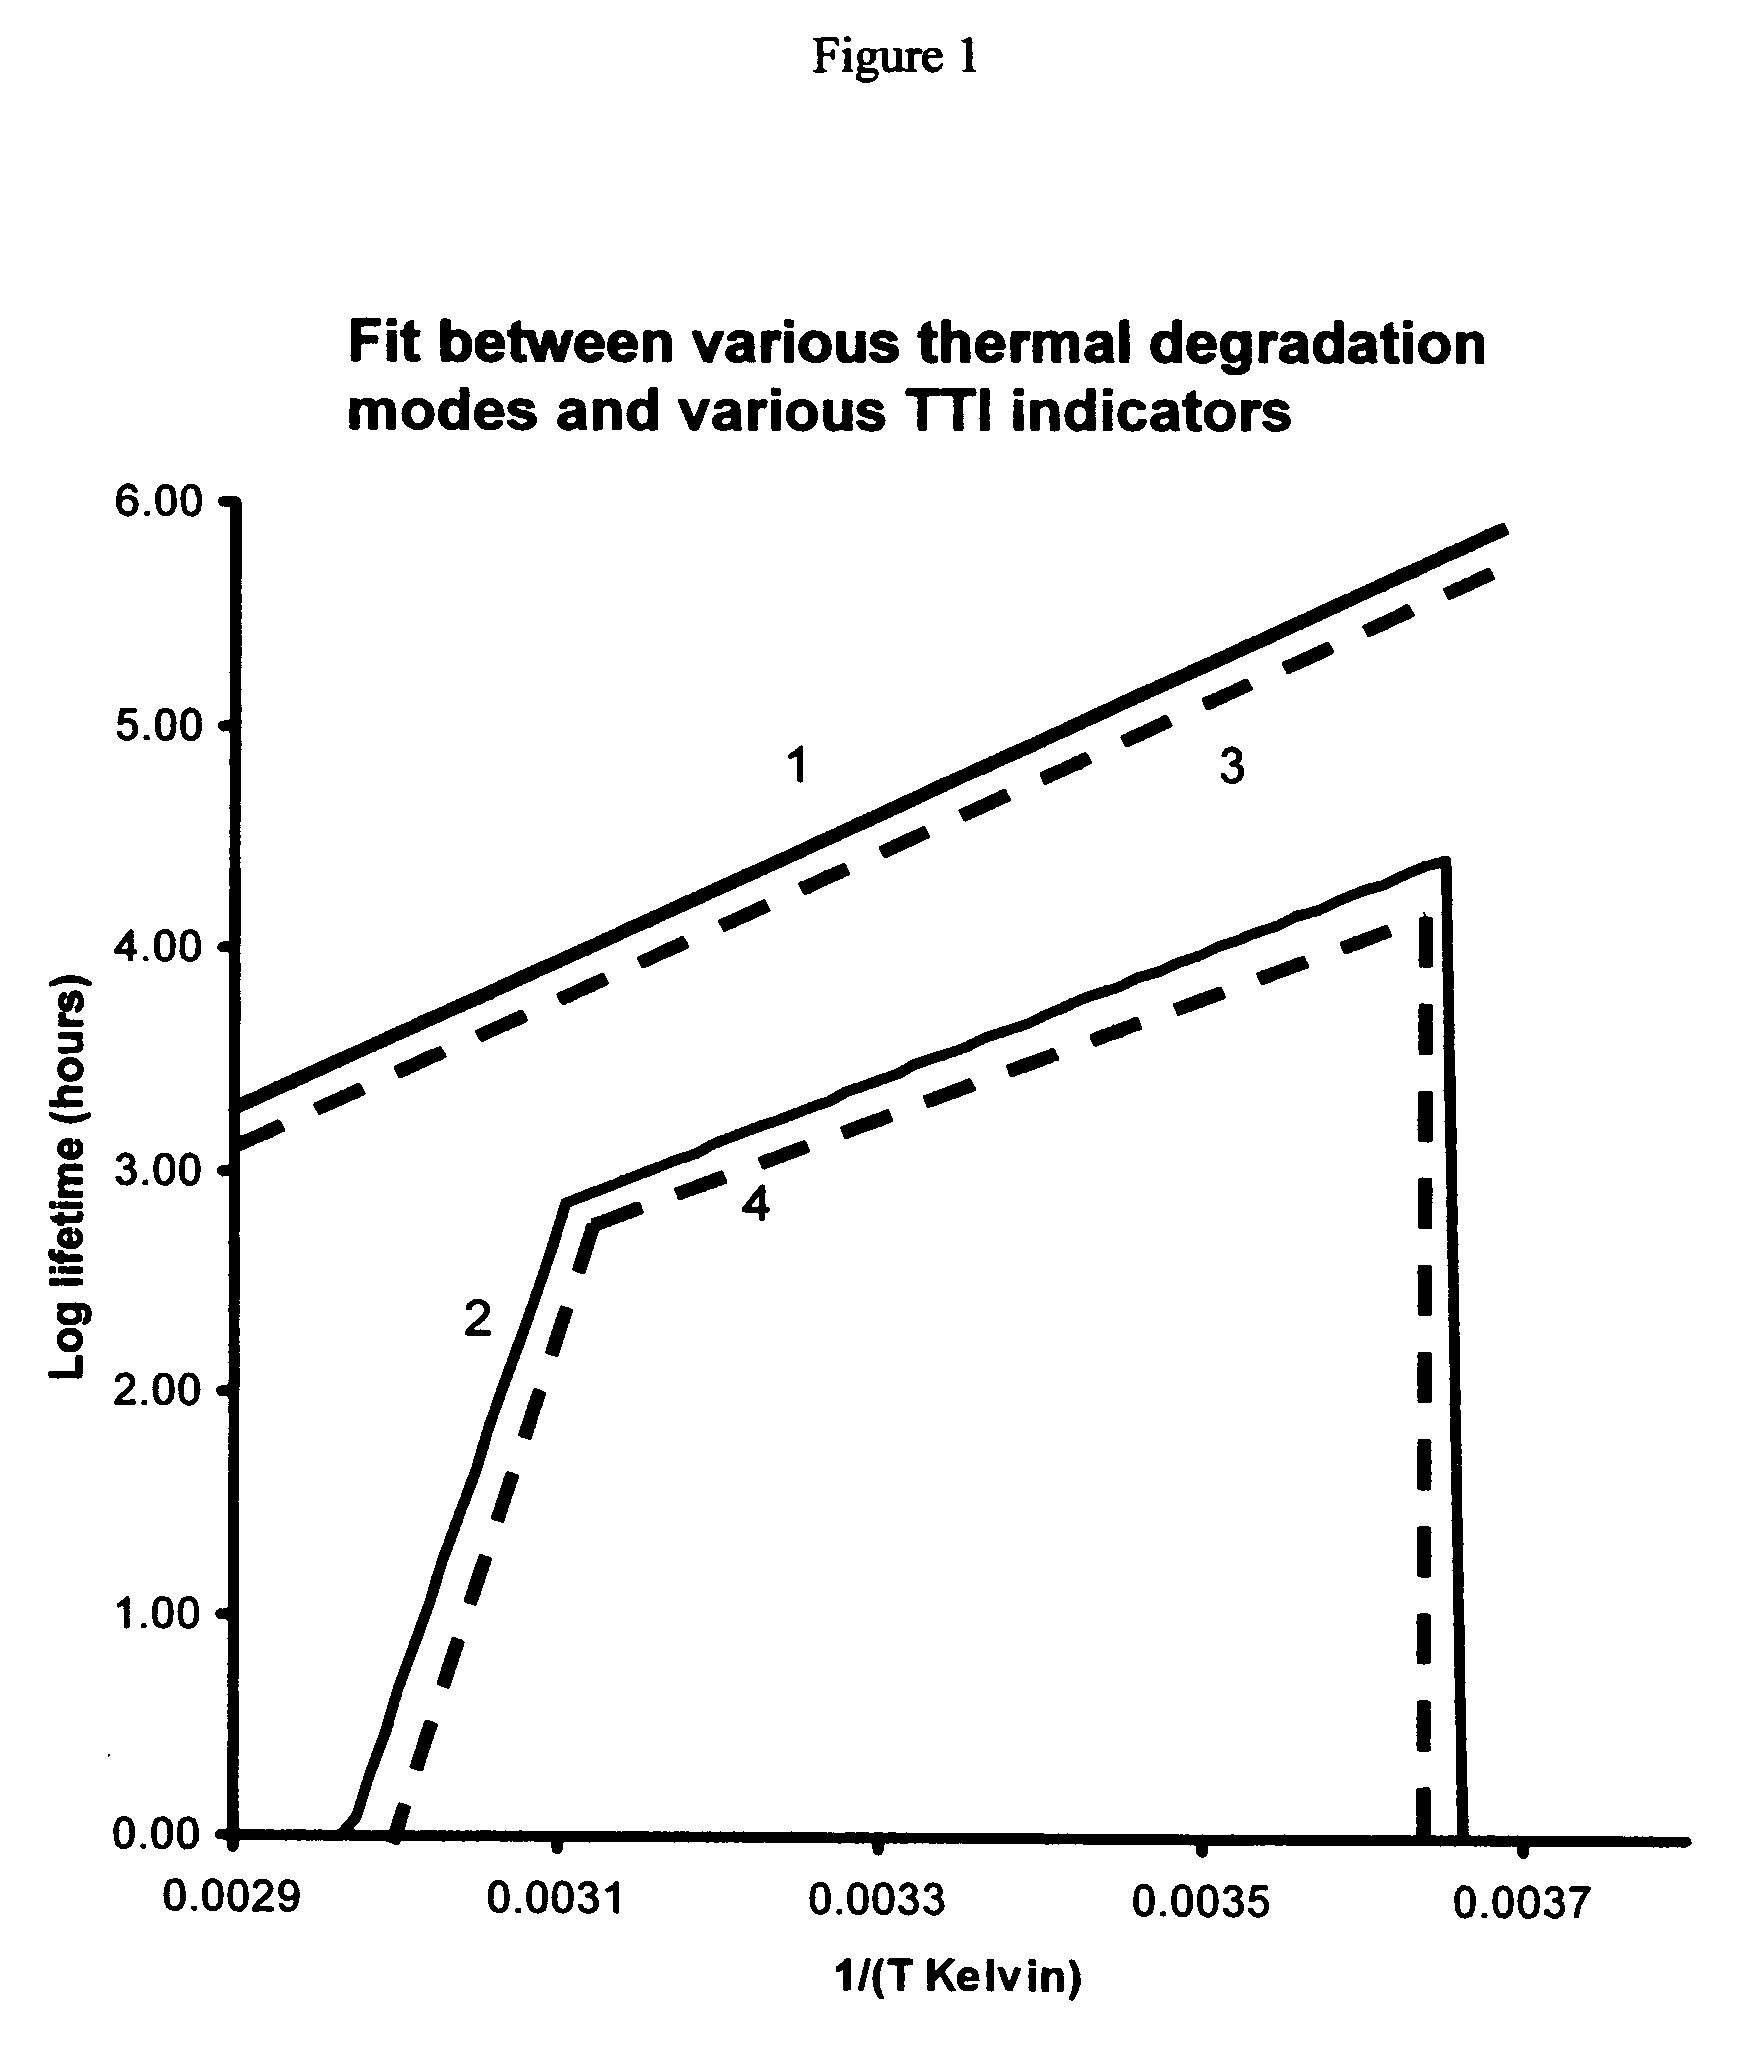
[0164] A good example of a more complex time-temperature stability curve can be found in blood storage conditions for blood banking. At present, the storage conditions for whole blood are:
TABLE 4Blood bank storage conditions for whole bloodTemperatureTimeInstant expiration1-6° C. Up to 42 days10° C.Up to 24 hours11° C.Up to 5 hours20° C.Instant expiration
[0165] Although a curve passing through all the data points in table 4 would not fit the Arrhenius equation, the curve can be approximated by a mix of different Arrhenius curves, each operating over a different part of the temperature region, plus a mix of other functions.
[0166] Here, as in example 1, the exponential Arrhenius equation can be used to calculate the values in-between the experimental data points shown above, and this in turn can be used with equations similar to example 1 to generate a table of P(temp) values, and used to program the stability monitor of the present invention. This is shown ...
PUM
 Abstract
Description
Claims
Application Information