

Computational strategy for discovering druggable gene networks from genome-wide RNA expression profiles
a gene network and expression profile technology, applied in the field of gene network models, can solve the problems of not being able to determine if differential experiments provide adequate or efficient tests or confirmation, and providing little or no information about the effects of compounds at the cellular or organismal level
- Summary
- Abstract
- Description
- Claims
- Application Information
AI Technical Summary
Benefits of technology
Problems solved by technology
Method used
Image

Examples
example 1
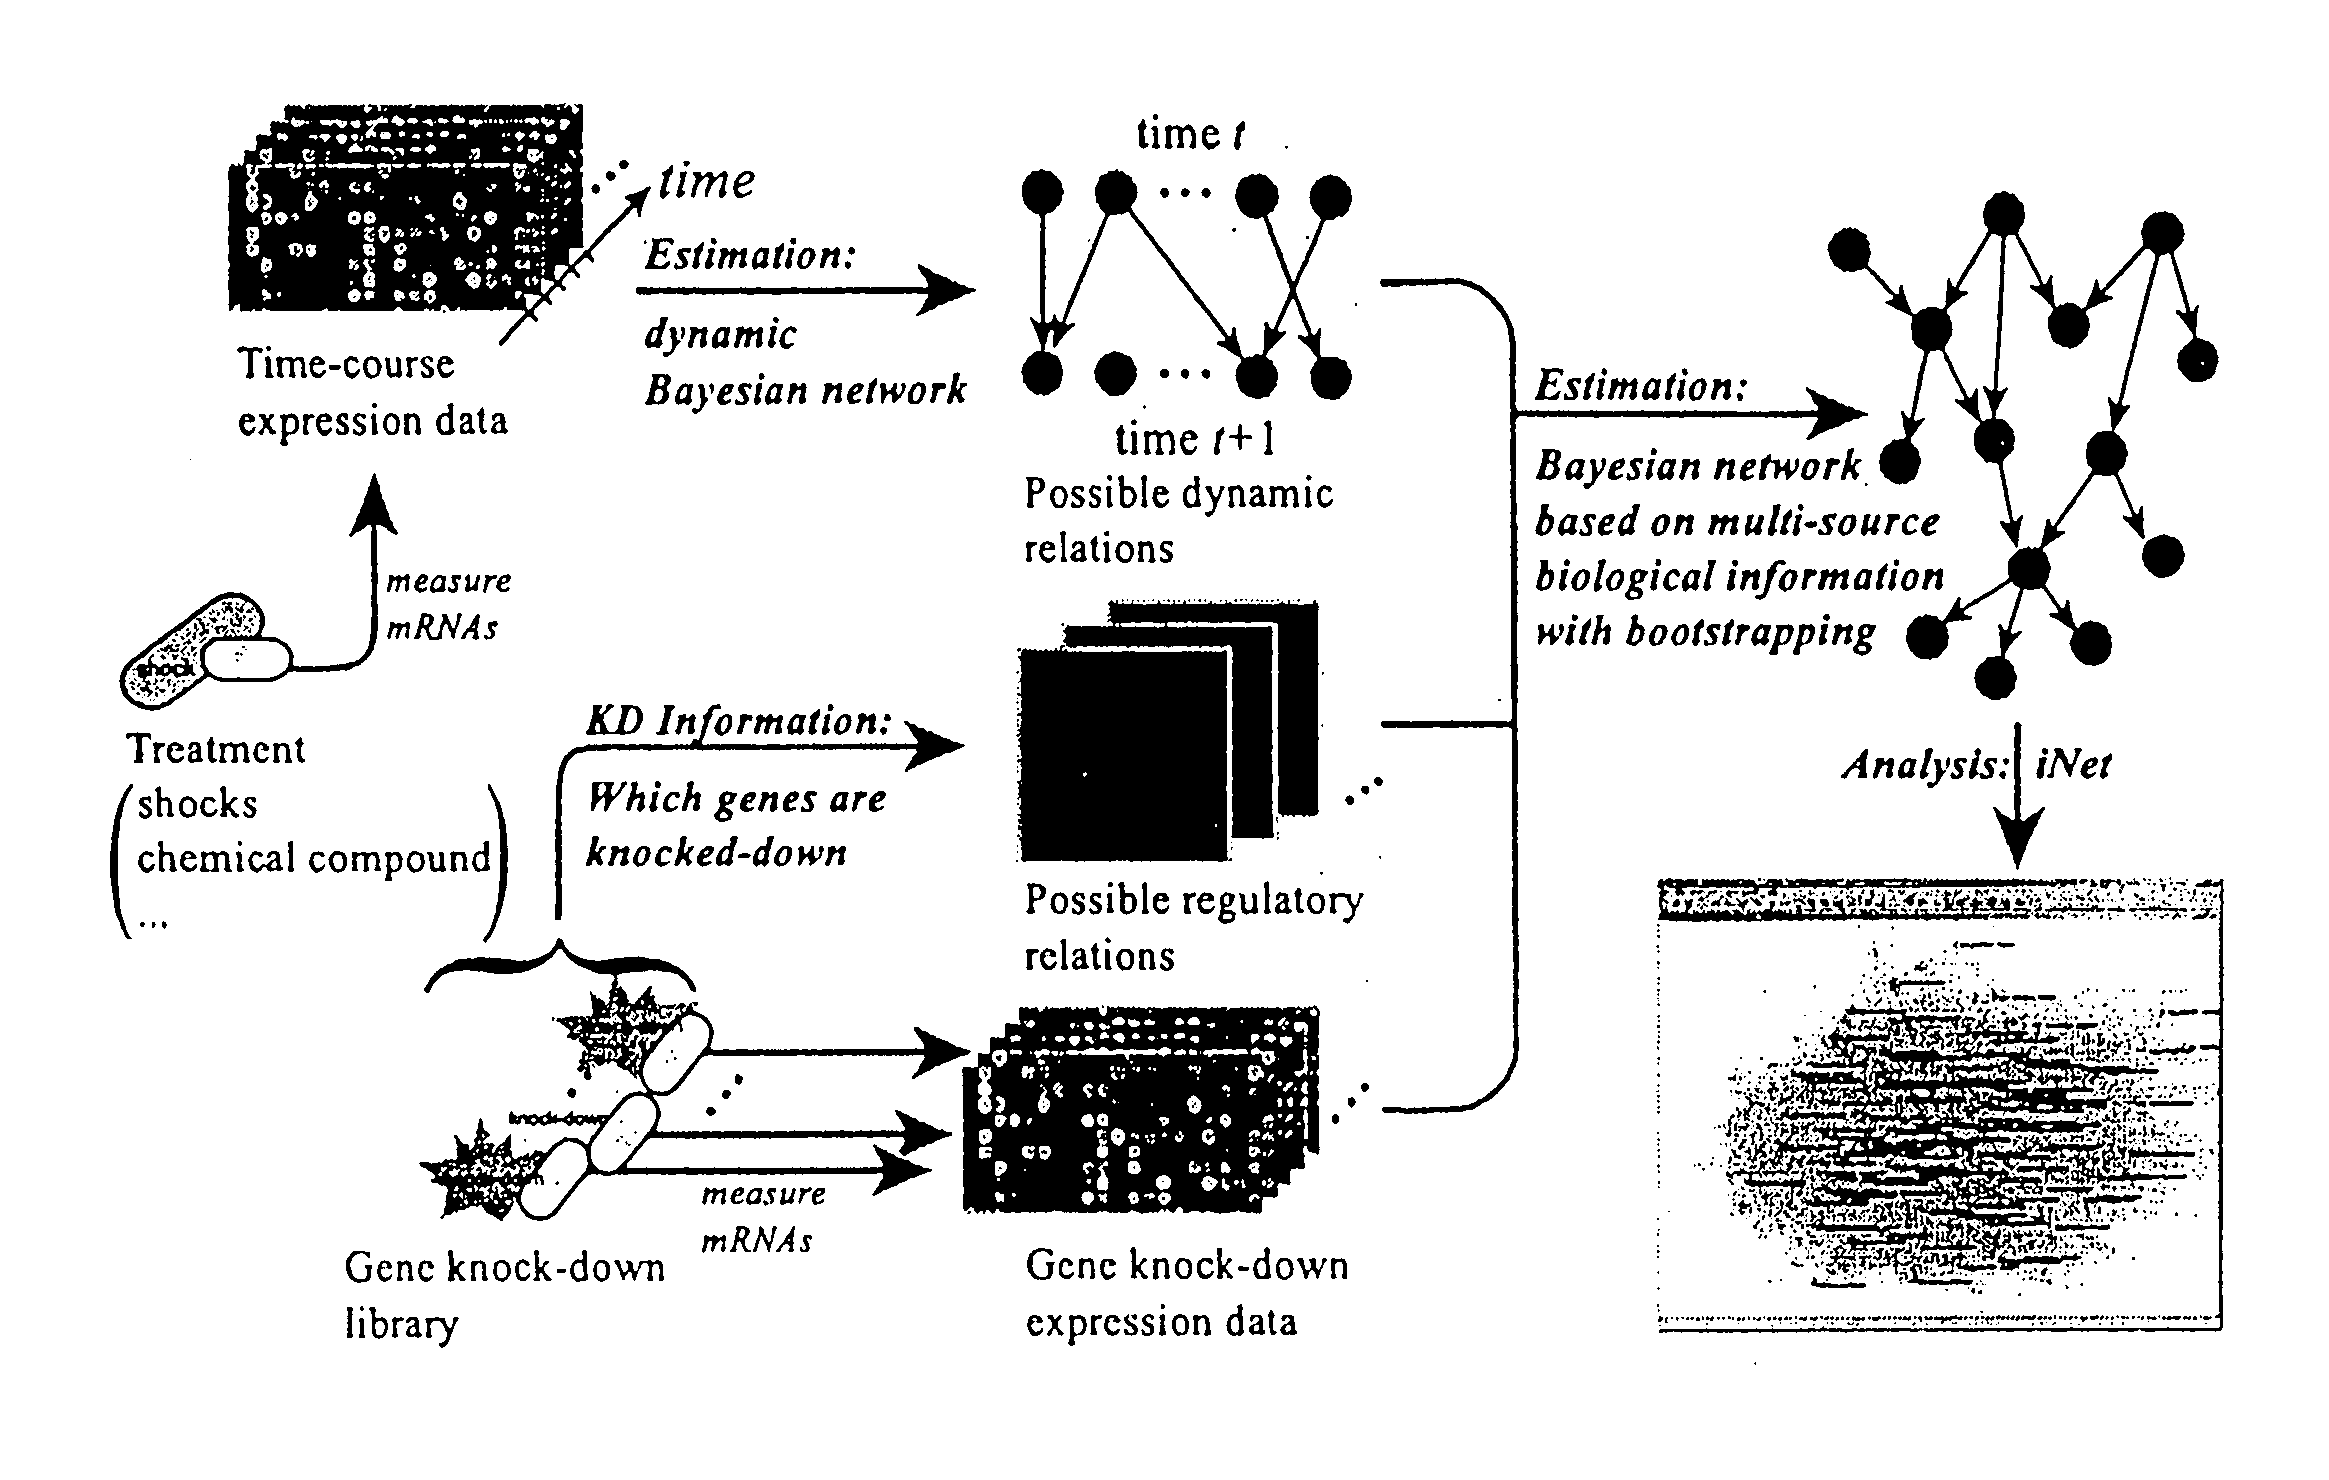
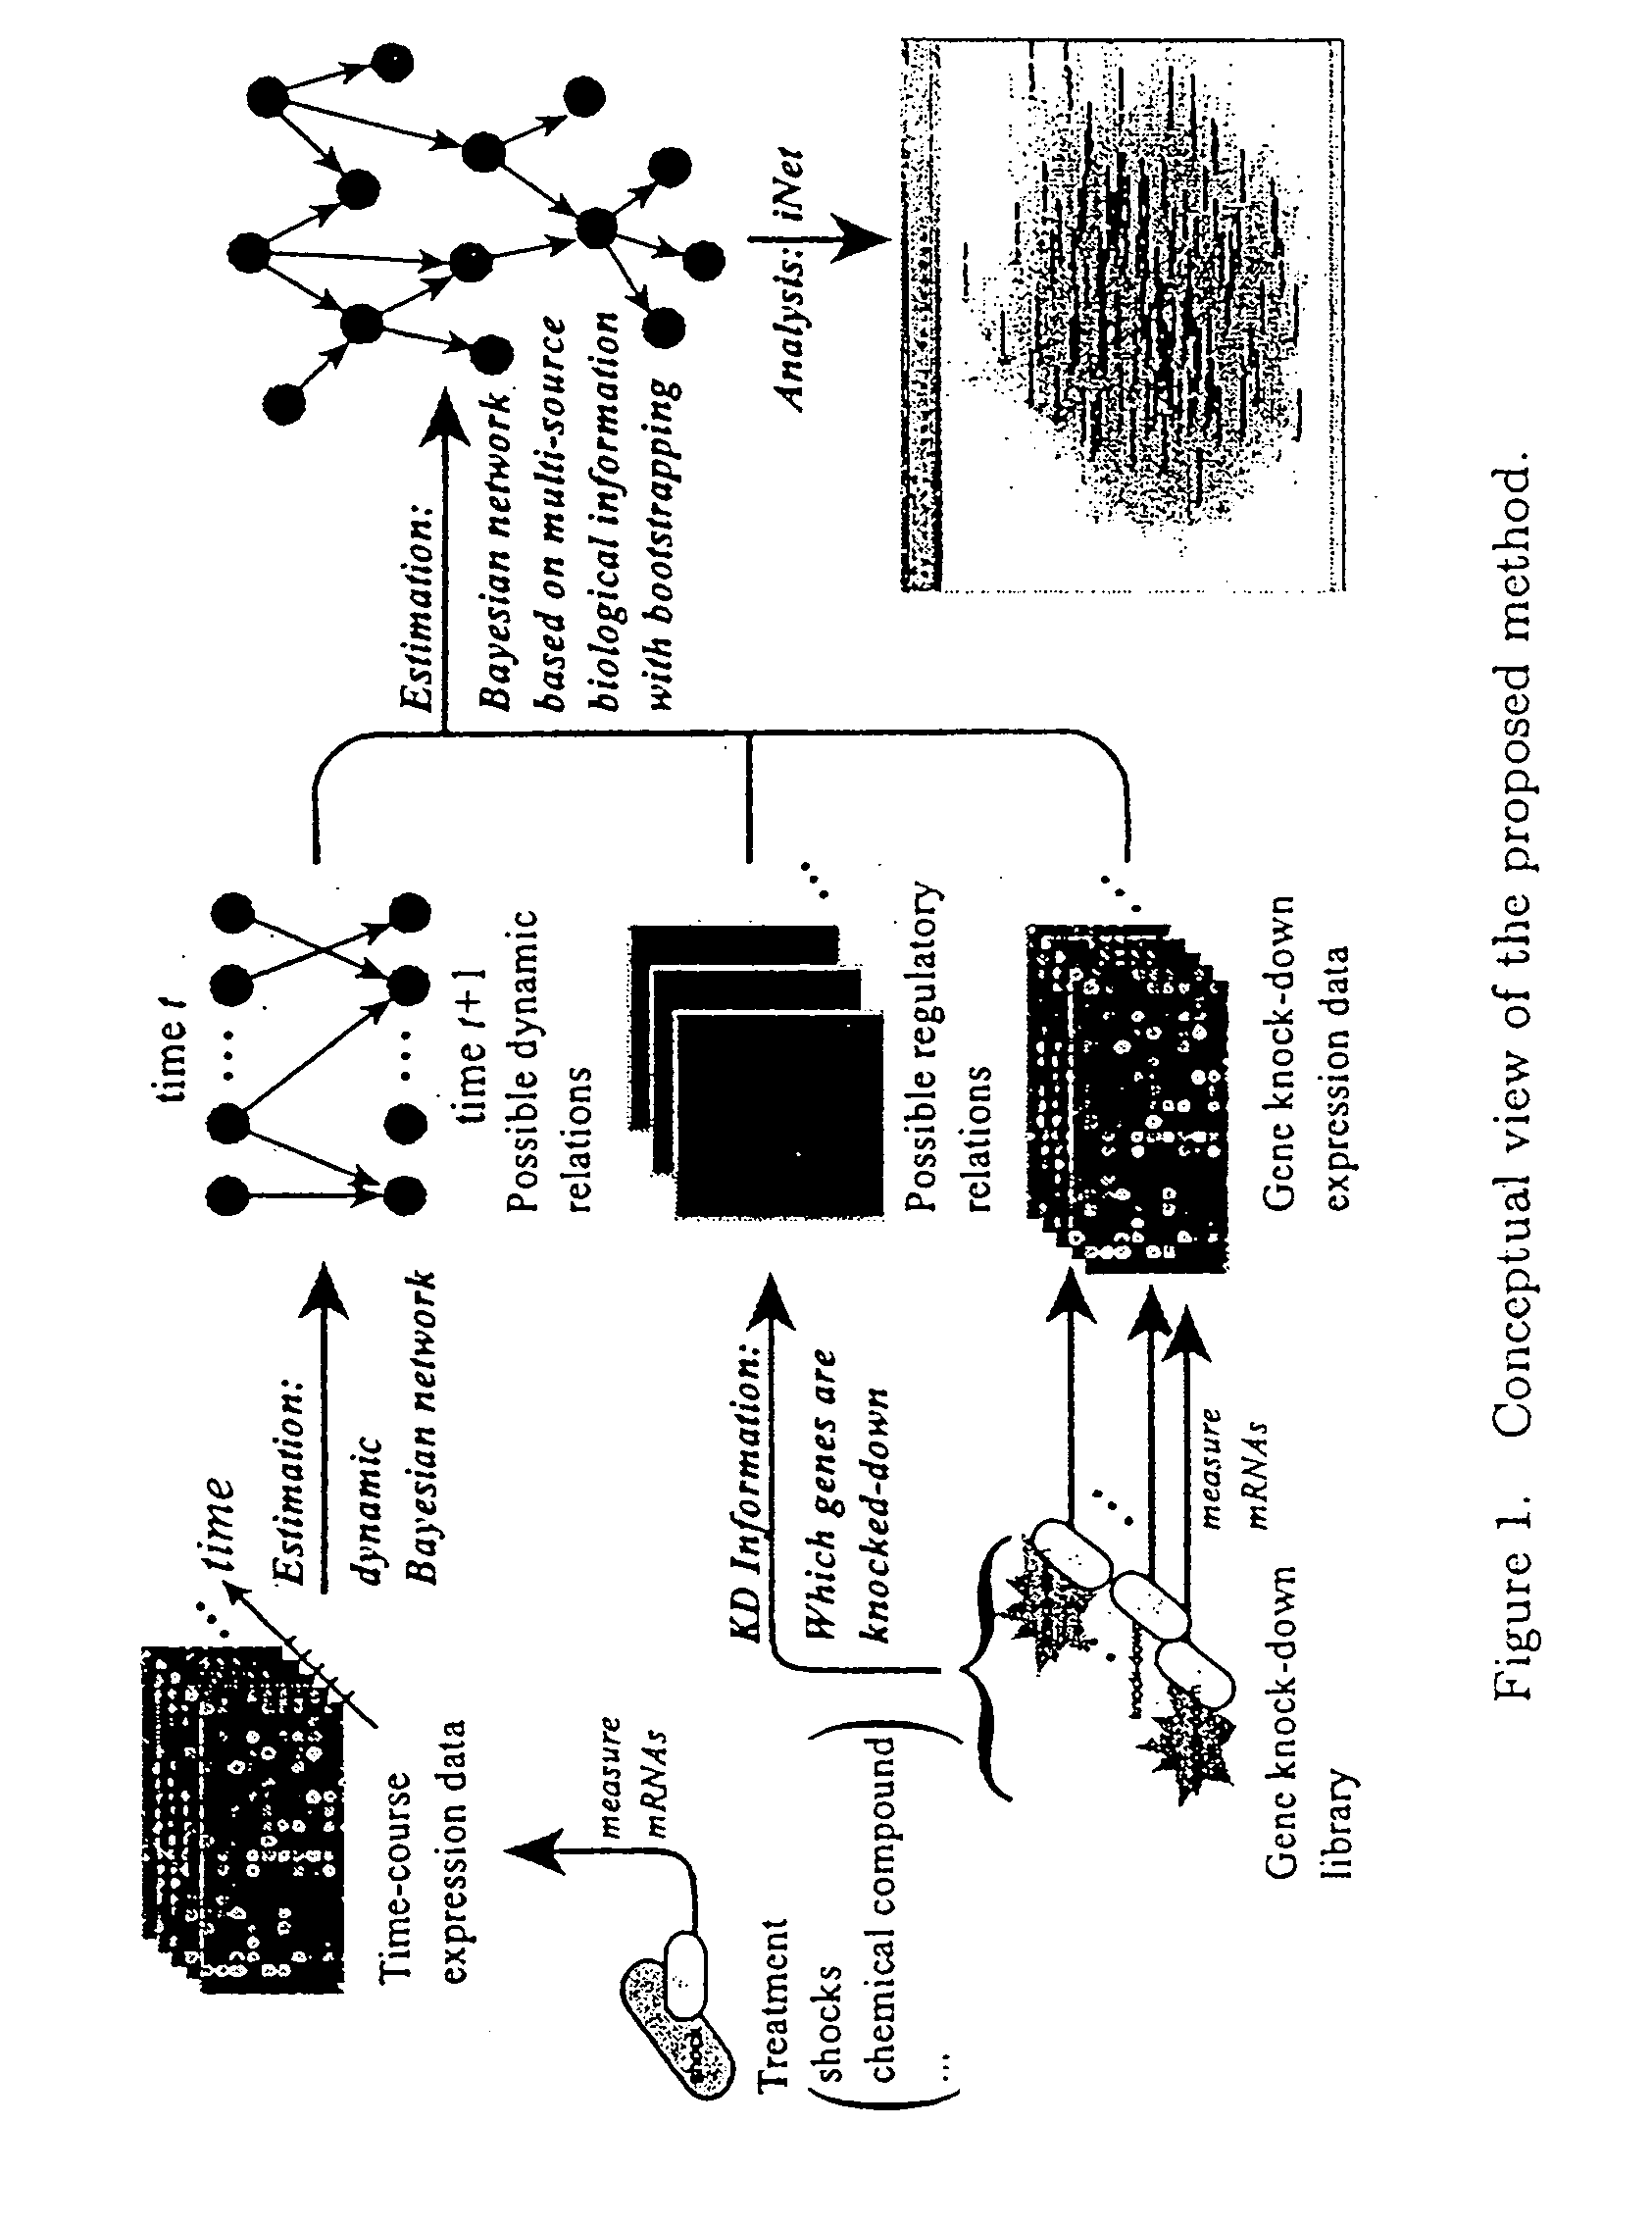
Fenofibrate Time Course Data
[0054]We measured the time-responses of human endothelial cell genes to 25 μM fenofibrate. The expression levels of 20,469 probes were measured by CodeLink™ Human Uniset 120K at six time-points (0, 2, 4, 6, 8 and 18 hours). Here time 0 means the start point of this observation and just before exposure to the fenofibrate. In addition, we measured this time-course data as the duplicated data in order to confirm the quality of experiments.
[0055]Since our fenofibrate time-course data are duplicated data and contain six time-points, there are 26=64 possible combinations to create a time-course dataset. We should fit the same regression function to a parent-child relationship in the 64 datasets. Under this constraint, we consider fitting nonparametric regression model to the connected data of 64 datasets. That is, if we consider gene i→gene j, we will fit the model xj(c)(t)=mj(xi(c)(t−1))+εf(t), where xj(c)(t) is the expression data of gene j at time t in the c...
example 2
Gene Knock Down Data by siRNA
[0056]For constructing exemplary gene networks, we newly created 270 gene knock-down data by using siRNA. We measured 20,469 probes by CodeLink™ Human Uniset 120K for each knock-down microarray after 24 hours of siRNA transfection. The knock-down genes were mainly transcription factors and signaling molecules. Let {tilde over (x)}Di=({tilde over (x)}1|Di, . . . , {tilde over (x)}p|Di)′ be the raw intensity vector of i-th knock-down microarray. For normalizing expression values of each microarray, we computed the median expression value vector ν=(ν1, . . . , νp)′ as the control data, where νj=median i({tilde over (x)}j|D—i). We applied the loess normalization method to the MA transformed data and the normalized intensity xj|D—i was obtained by applying the inverse transformation to the normalized log({tilde over (x)}j|D—i / νj). We referred to the normalized log({tilde over (x)}j|D—i / νj) as the log-ratio.
[0057]In 270 gene knock-down microarray data, we know...
example 3
Combination of Fenofibrate Time Course Data, Gene Knock Down Data by siRNA, and Knock Down Data Matrix to Generate a Gene Network Model
[0058]
TABLE 1Significant GO annotations of selected fenofibrate-relacedgenes from 18 hours microarray.p-#GO FunctionvaluegenesGO:0007049cell cycle1.0E−0835GO:0000278mitotic cell cycle3.7E−0719GO:0000279M phase5.0E−0617GO:0006629lipid metabolism1.3E−0525GO:0007067mitosis1.3E−0515GO:0000087M phase of mitotic cell cycle1.6E−0515GO:0000074regulation of cell cycle2.7E−0522GO:0044255cellular lipid metabolism4.4E−0521GO:0016126sterol biosynthesis4.3E−046GO:0016125sterol metabolism4.5E−048GO:0008203cholesterol metabolism1.5E−037GO:0006695cholesterol biosynthesis2.4E−035GO:0008202steroid metabolism3.6E−0310GO:0000375RNA splicing, via4.1E−039transesterification reactionsGO:0000377RNA splicing, viatransesterification reactionswith bulged adenosine as4.1E−039nucleophileGO:0000398nuclear mRNA splicing,4.1E−039via spliceosomeGO:0006694steroid biosynthesis6.0E−037G...
PUM
| Property | Measurement | Unit |
|---|---|---|
| time | aaaaa | aaaaa |
| time-course gene expression | aaaaa | aaaaa |
| time | aaaaa | aaaaa |
Abstract
Description
Claims
Application Information