

Method for Identifying Protein Patterns in Mass Spectrometry
a mass spectrometry and protein technology, applied in the field of medical diagnostic methods, can solve the problems of insufficient 2de to be used in medical routine, unsuitable for unique biomarkers, becoming expensive and inappropriate for this kind of research, and reducing the cardinality of feature space. , the effect of reducing the signal/nois
- Summary
- Abstract
- Description
- Claims
- Application Information
AI Technical Summary
Benefits of technology
Problems solved by technology
Method used
Image

Examples
example 3
Obtention of Mass Spectra
[0041]All mass spectra were acquired using a quadrupole-TOF hybrid mass spectrometer (Q-TOF Ultima, Micromass, Manchester, UK) equipped with a nano Z-spray source operating in positive ion mode. The ionization conditions used included a capillary voltage of 2.3 kV, a cone voltage and RF1 lens of 30 V and 100 V, respectively, and collision energy of 10 eV. The source temperature was 80° C. and the cone gas was N2 at a flow of 80 l / h; no nebulising gas was used to obtain the sprays Argon was used in the collision cell for ion collision cooling. External calibration with sodium iodide was performed over a mass range from 400 to 3000 m / z. All spectra were obtained with the TOF analyser in “V-mode” (TOF kV=9.1) and the MCP voltage set at 2.15 kV.
[0042]Each sample was injected twice into the mass spectrometer source with a syringe pump at a flow rate of 1 μL / min. during 2 min. using MCA mode. The whole system was washed with acetonitrile between injections. Data w...
example 5
Result of the Mass Spectrometer
[0043]Each of the serum samples was injected at least twice in the mass spectrometer through a syringe that is attached to the source receiver device with a 1 μL / min flow rate during some 2 minutes using the analyzer TOF MCA module. At the intervals between the first serum samples injection and a second serum sample, all the system must be washed with an adequate solution, such as, acetonitrile. The data to be analyzed was collected at the spectrum preferential interval comprised between 400 and 3000 m / z.
[0044]As to the mass spectrometry data at the interval of approximately 1200 to 2200 m / z, the data was submitted to a computing treatment in the Masslynx 3 program. Such computing program applies a smooth filter to reduce noises. The smooth filter was applied at 3 windows of the channel in order to use present invention method.
[0045]The multi charge spectrum was then converted to a single charge spectrum for the interval of 8 kDa to 250 kDa using a max...
example 6
Treatment of Data Obtained in the Spectrum Reading
[0048]The data obtained after the spectrum readings treatment was analyzed using the SVM strategy, which can be described as shown below (Vapnik, V.N.1995):
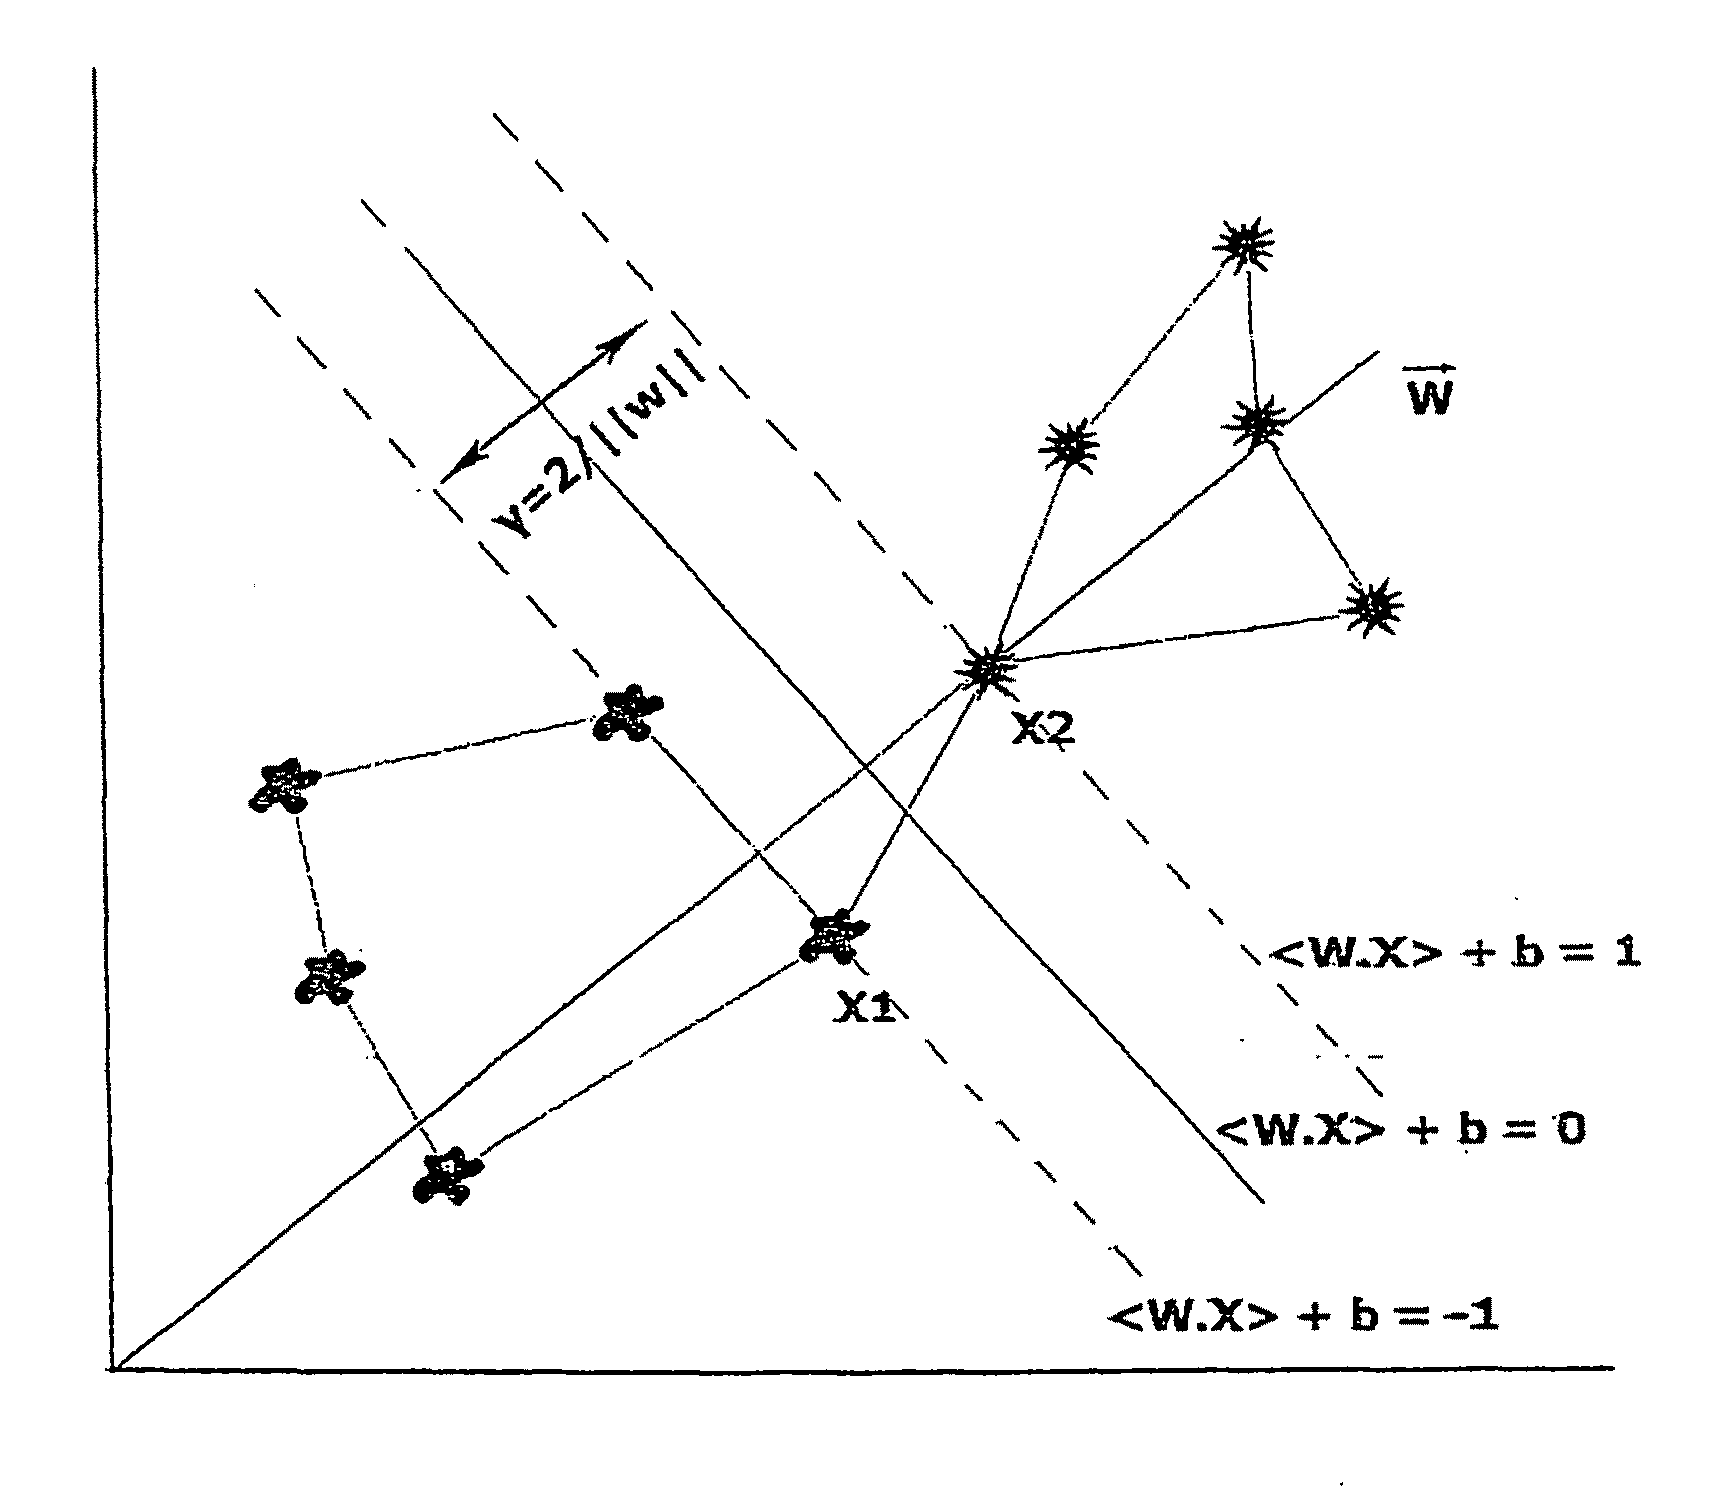
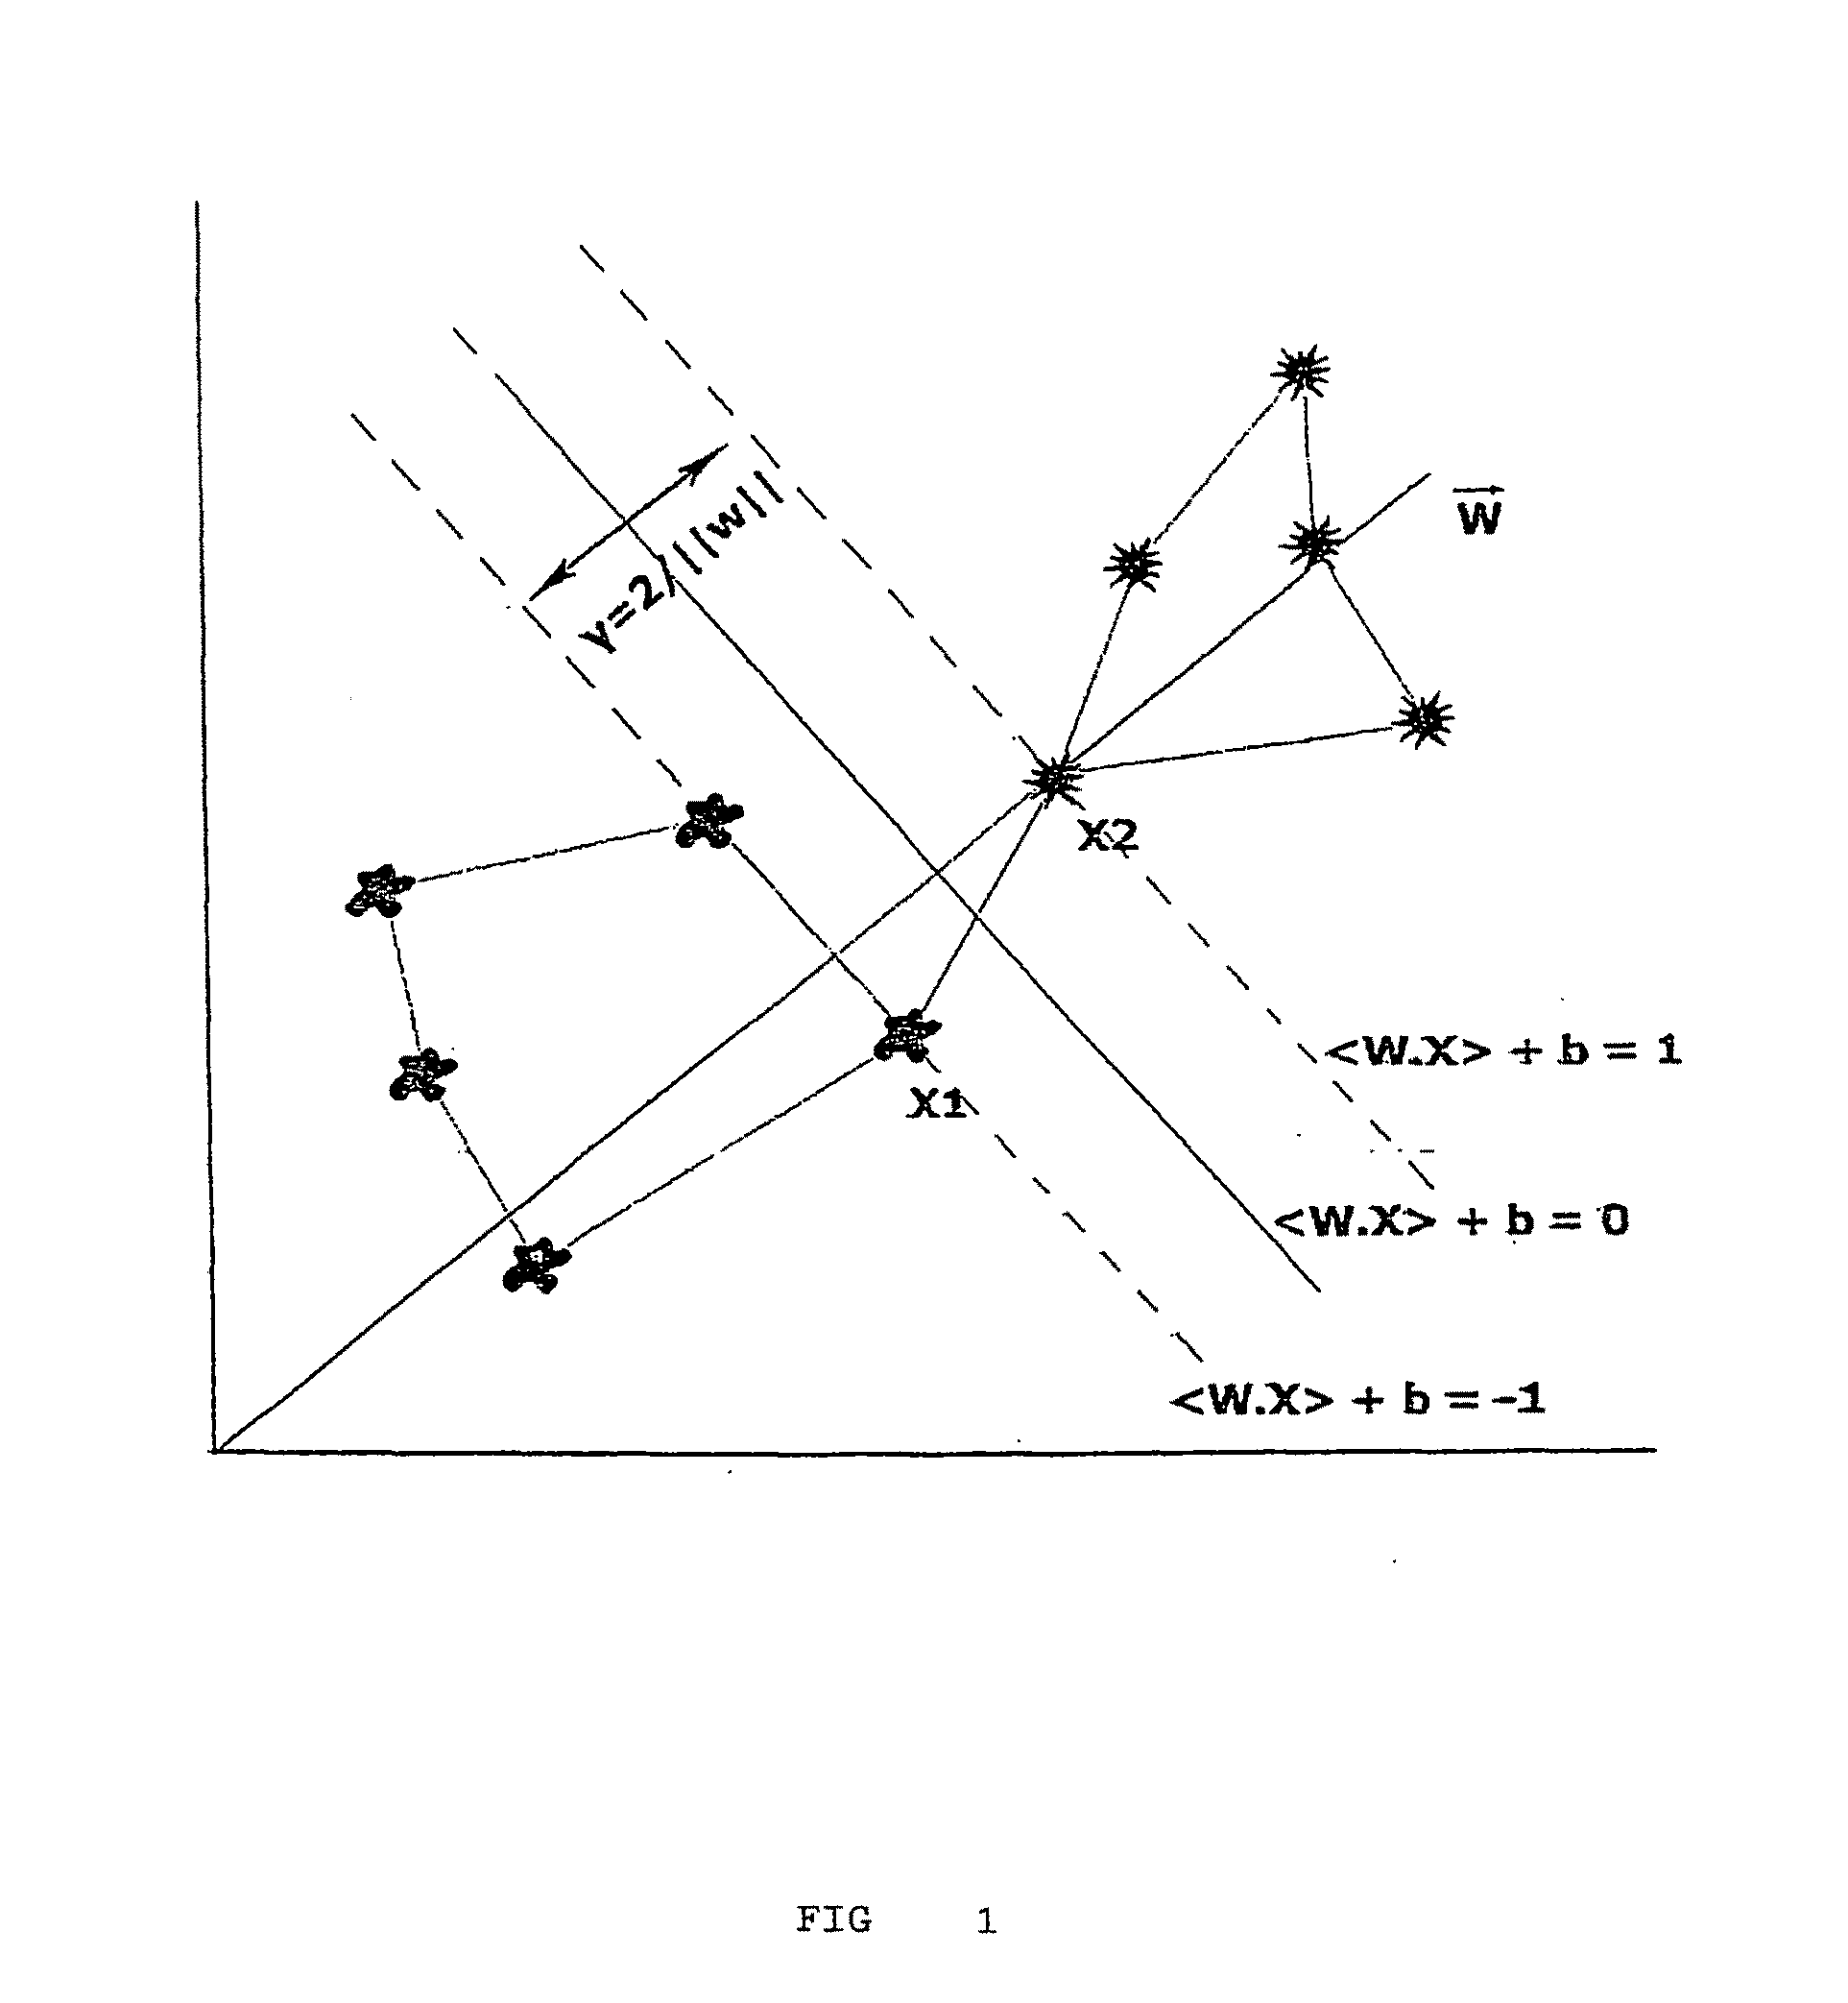
[0049]Given a set of linearly separable training on the space of characteristics: S={(x1, y1),(Xn, yn)} which results in an equation of a linear classifier WTx+b=0, where w is the normal vector and b is a value attributed to a obliquity, for an unknown sample with input vector x, such must be classified with +b>=1 and classified as −1 if: +b<=−1.
[0050]FIG. 1 geometrically shows that the margin can be calculated in accordance with following development stages after the normal vector definition:
w·x1>+b=1 (1.1)
w·x2>+b=−1 (1.2)
[0051]Subtracting eq. 1.1 from 1.2 yields
w<x1−x2>=2 (1.3)
Projecting the difference vector on the normal vector w:
1ww·<x1-x2>=2w(1.4)
[0052]The algorithm searches for the w's and b's space with the purpose of finding the maximum separation ma...
PUM
 Abstract
Description
Claims
Application Information