
Quantitative analyzing method of CIGS film using a laser induced breakdown spectroscopy

a technology of cigs and laser induced breakdown, which is applied in the direction of spectrometry/spectrophotometry/monochromators, instruments, optical radiation measurement, etc., can solve the problems of significant loss of product, difficult to determine whether the fluorescence signal to be measured is output from a practical film or a substrate, and the production line cannot be applied

Active Publication Date: 2014-11-13
GWANGJU INST OF SCI & TECH
View PDF3 Cites 12 Cited by
  • Summary
  • Abstract
  • Description
  • Claims
  • Application Information

AI Technical Summary

Benefits of technology

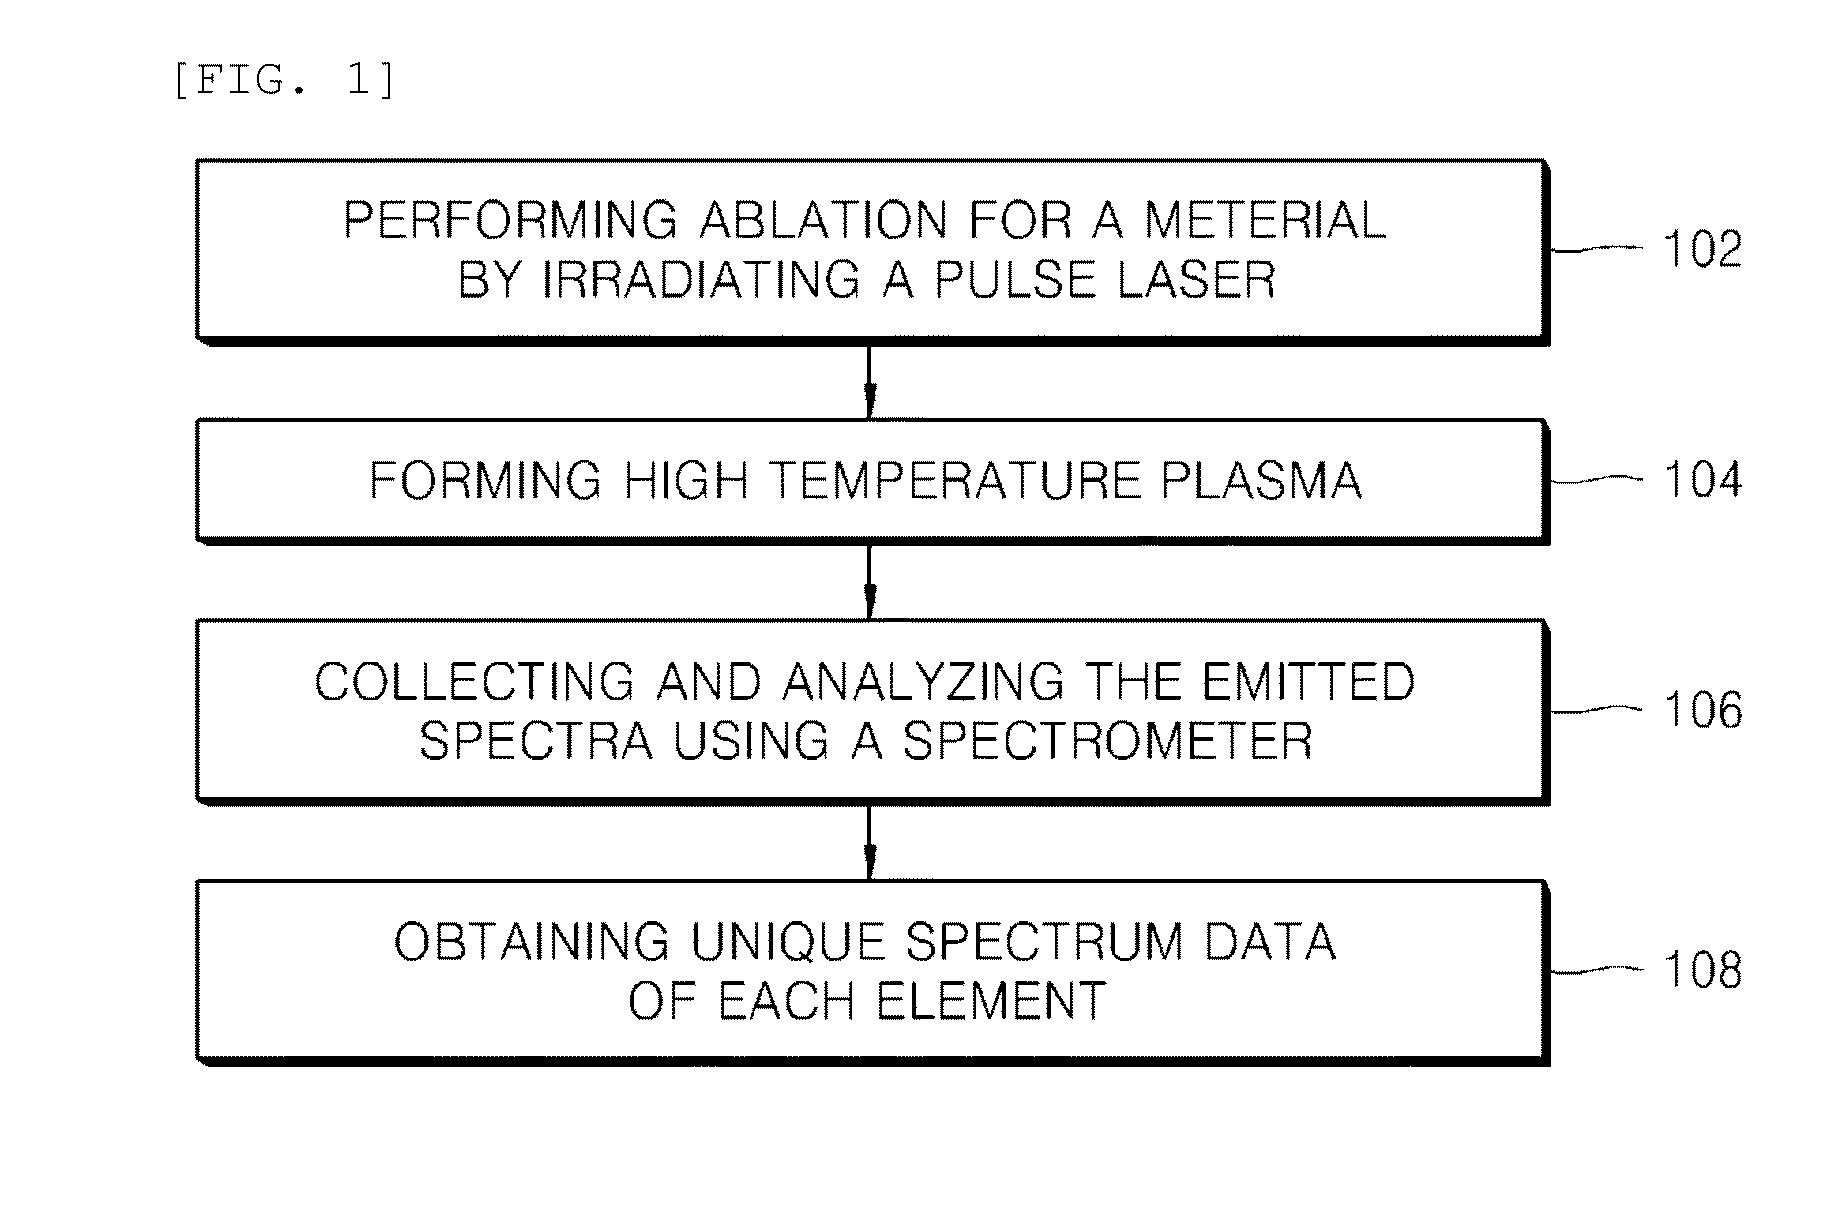
The present invention provides a quantitative analyzing method of a copper indium gallium selenide (CIGS) film using a linear calibration curve correcting an effect of self-absorption at the time of analyzing a laser induced breakdown spectroscopy (LIBS). This method involves obtaining spectra by irradiating a laser on multiple CIGS films, selecting a first and second spectral line for analysis, correcting the measured intensity of these lines using a curve fitting approach, and obtaining a linear calibration curve. This calibration curve is then used to compare the LIBS analysis of a target sample. This method allows for accurate quantitative analysis of CIGS films and can be used in various industrial applications.

Problems solved by technology

Since an inductively coupled plasma mass spectrometry (ICP-MS) which is widely used other than those mentioned above has difficulty in that a piece to be analyzed needs to be melted in a solvent and should then be analyzed, it is also impossible to apply to the production line.
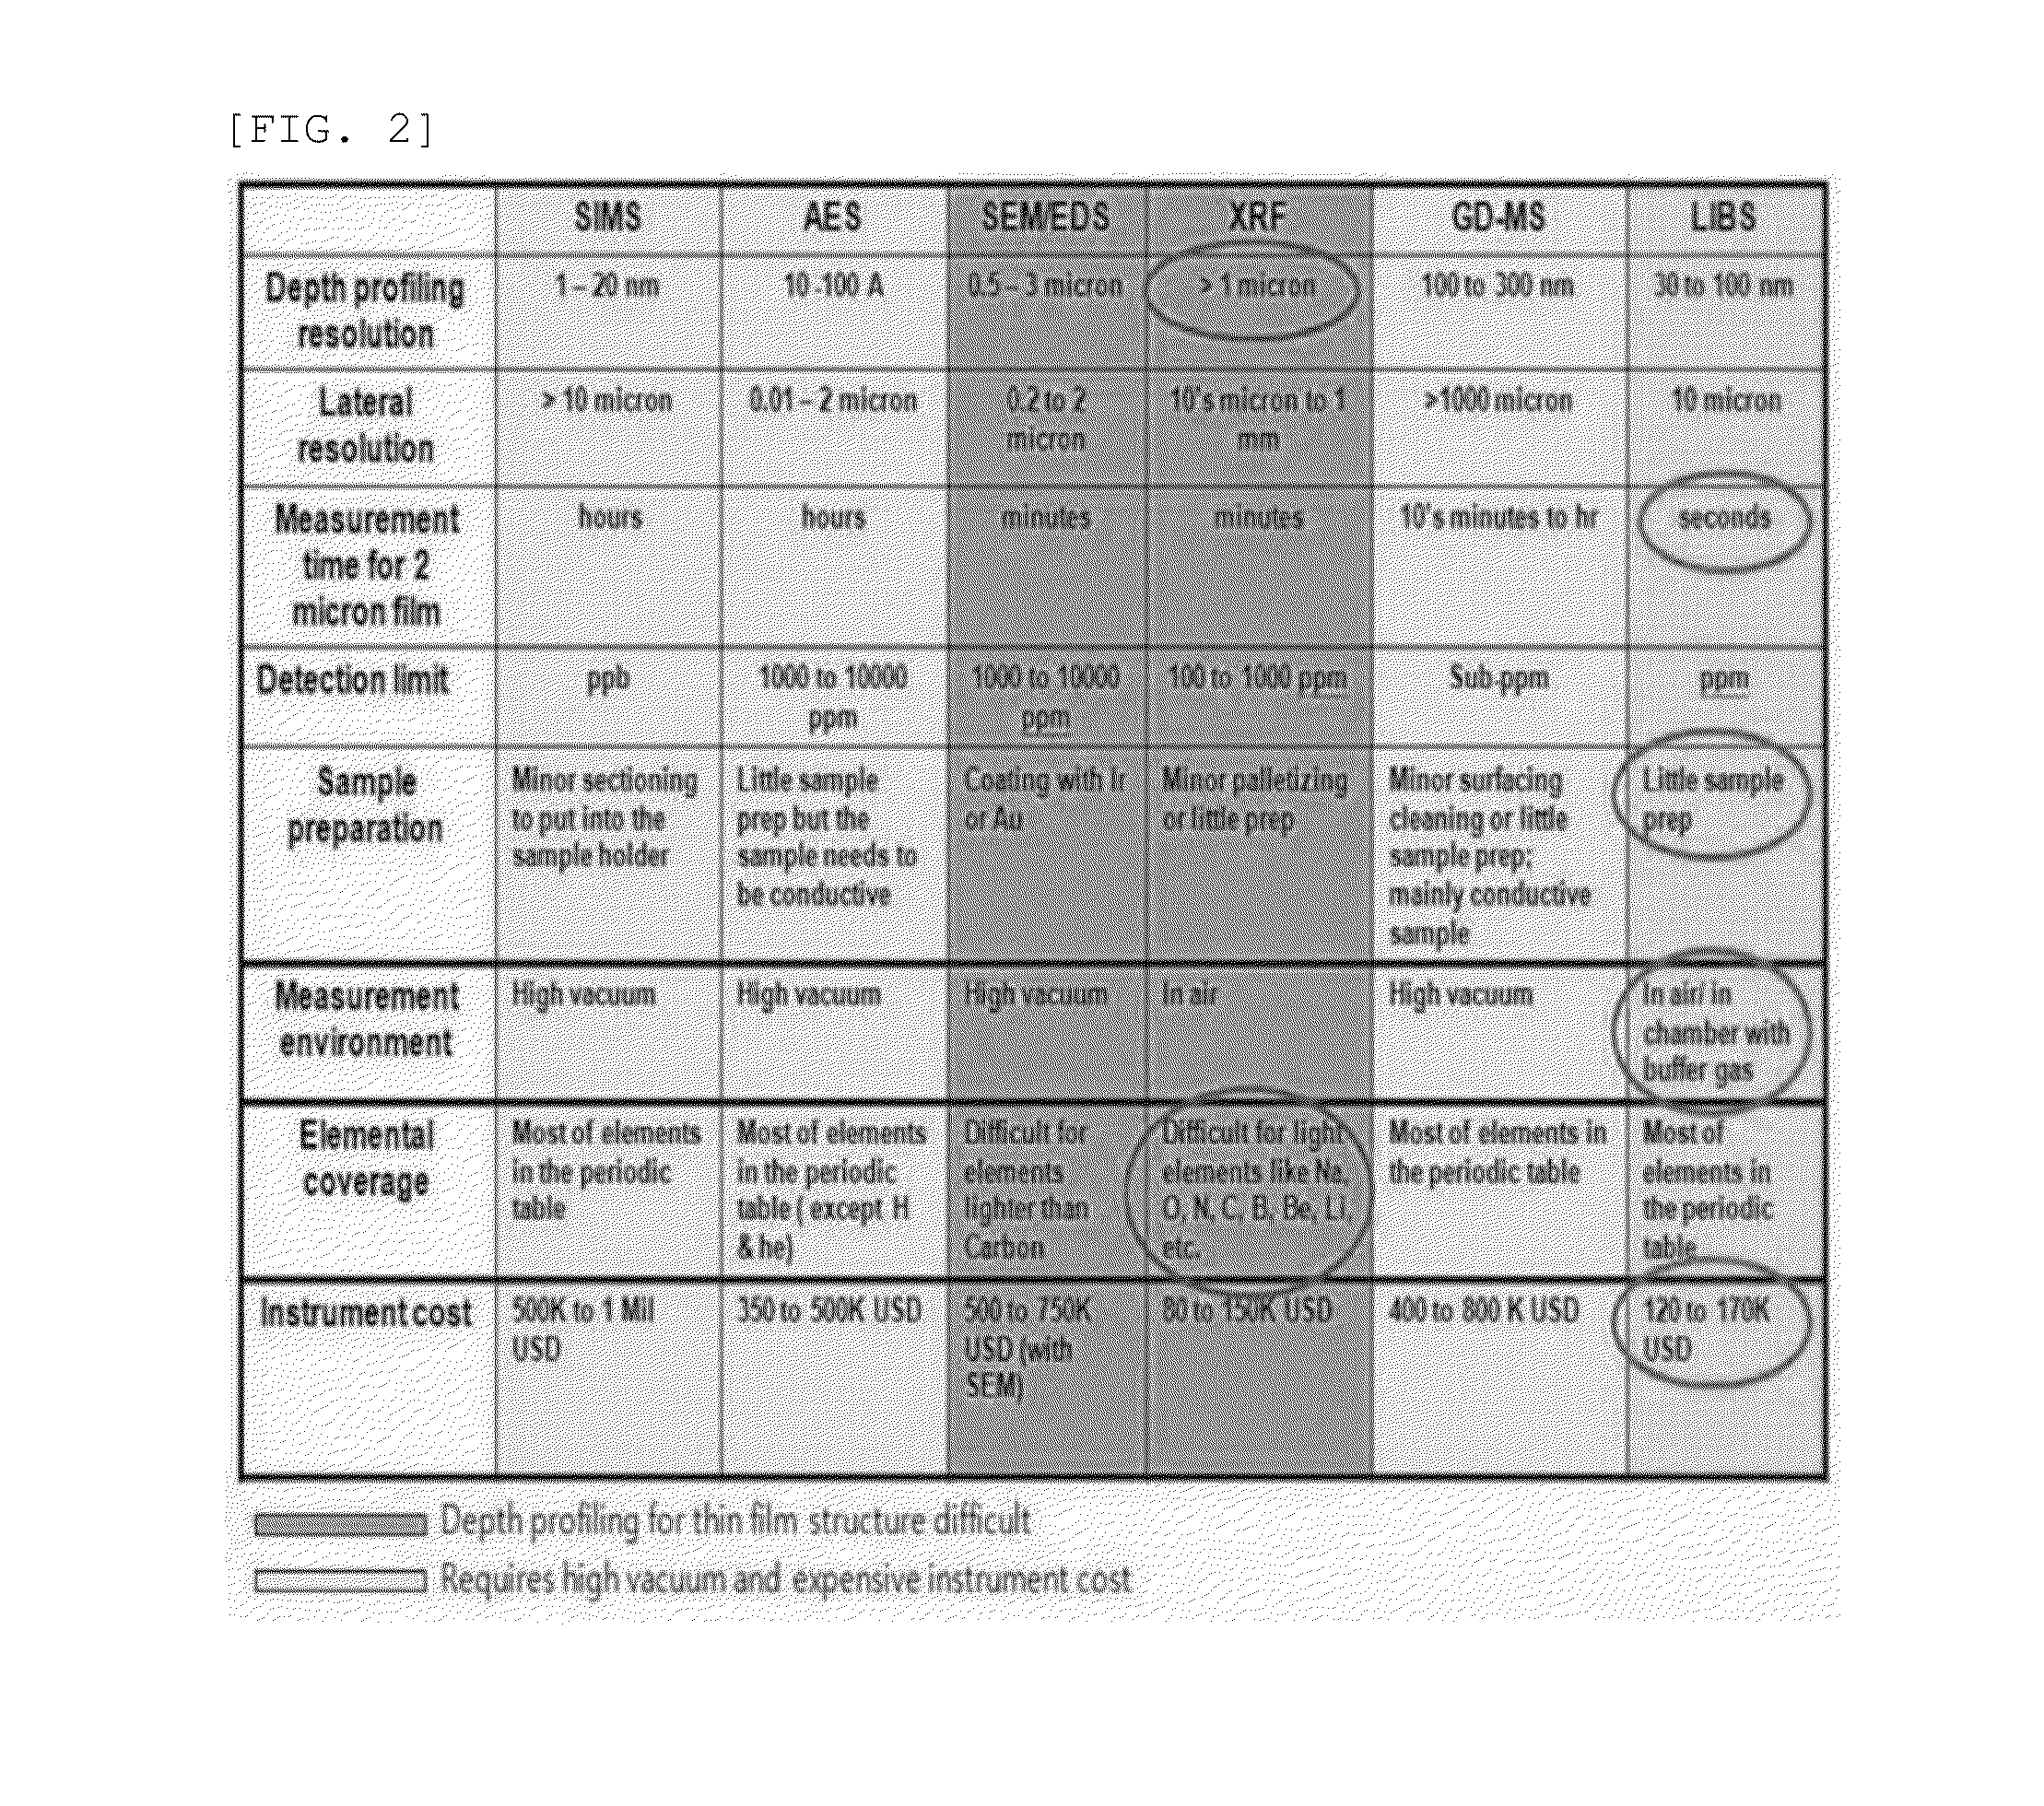
Currently, an X-ray fluorescence (XRF), which is widely used for analyzing substance of a solar cell material in the laboratory or in the field due to simplicity of use is relatively inexpensive and may be measured under air atmosphere, but has a technical limitation in measuring the substance distribution of a copper indium gallium selenide (CIGS) film in that ① since light elements such as Na, O, N, C, B, Be, Li, and the like are hardly measured, it is impossible to measure a Na content in the CIGS film, which has a decisive effect on a component efficiency, ② the XRF has a precision in a depth direction of at most about 1 μm, it is impossible to measure the element distribution in the depth direction in the CIGS film having a thickness of 2 μm, and ③ it is difficult to determine whether a fluorescence signal to be measured is output from a practical film or a substrate.
In addition, even though the physical and chemical properties are deviated from a physical and chemical standard targeted by a practical production process, it is impossible to separately check, and the deviated physical and chemical properties cannot but be found through degradation in performance and quality in a phase of evaluating the final completed product, thereby causing significant loss of the product.
The continuous production process as described above requires considerable effort and time in order to detect a physical and chemical variable causing the degradation in performance and quality of the product, thereby causing an increase in price and degradation in competitiveness.

Method used


Image

  • Quantitative analyzing method of CIGS film using a laser induced breakdown spectroscopy
  • Quantitative analyzing method of CIGS film using a laser induced breakdown spectroscopy
  • Quantitative analyzing method of CIGS film using a laser induced breakdown spectroscopy

Examples


example

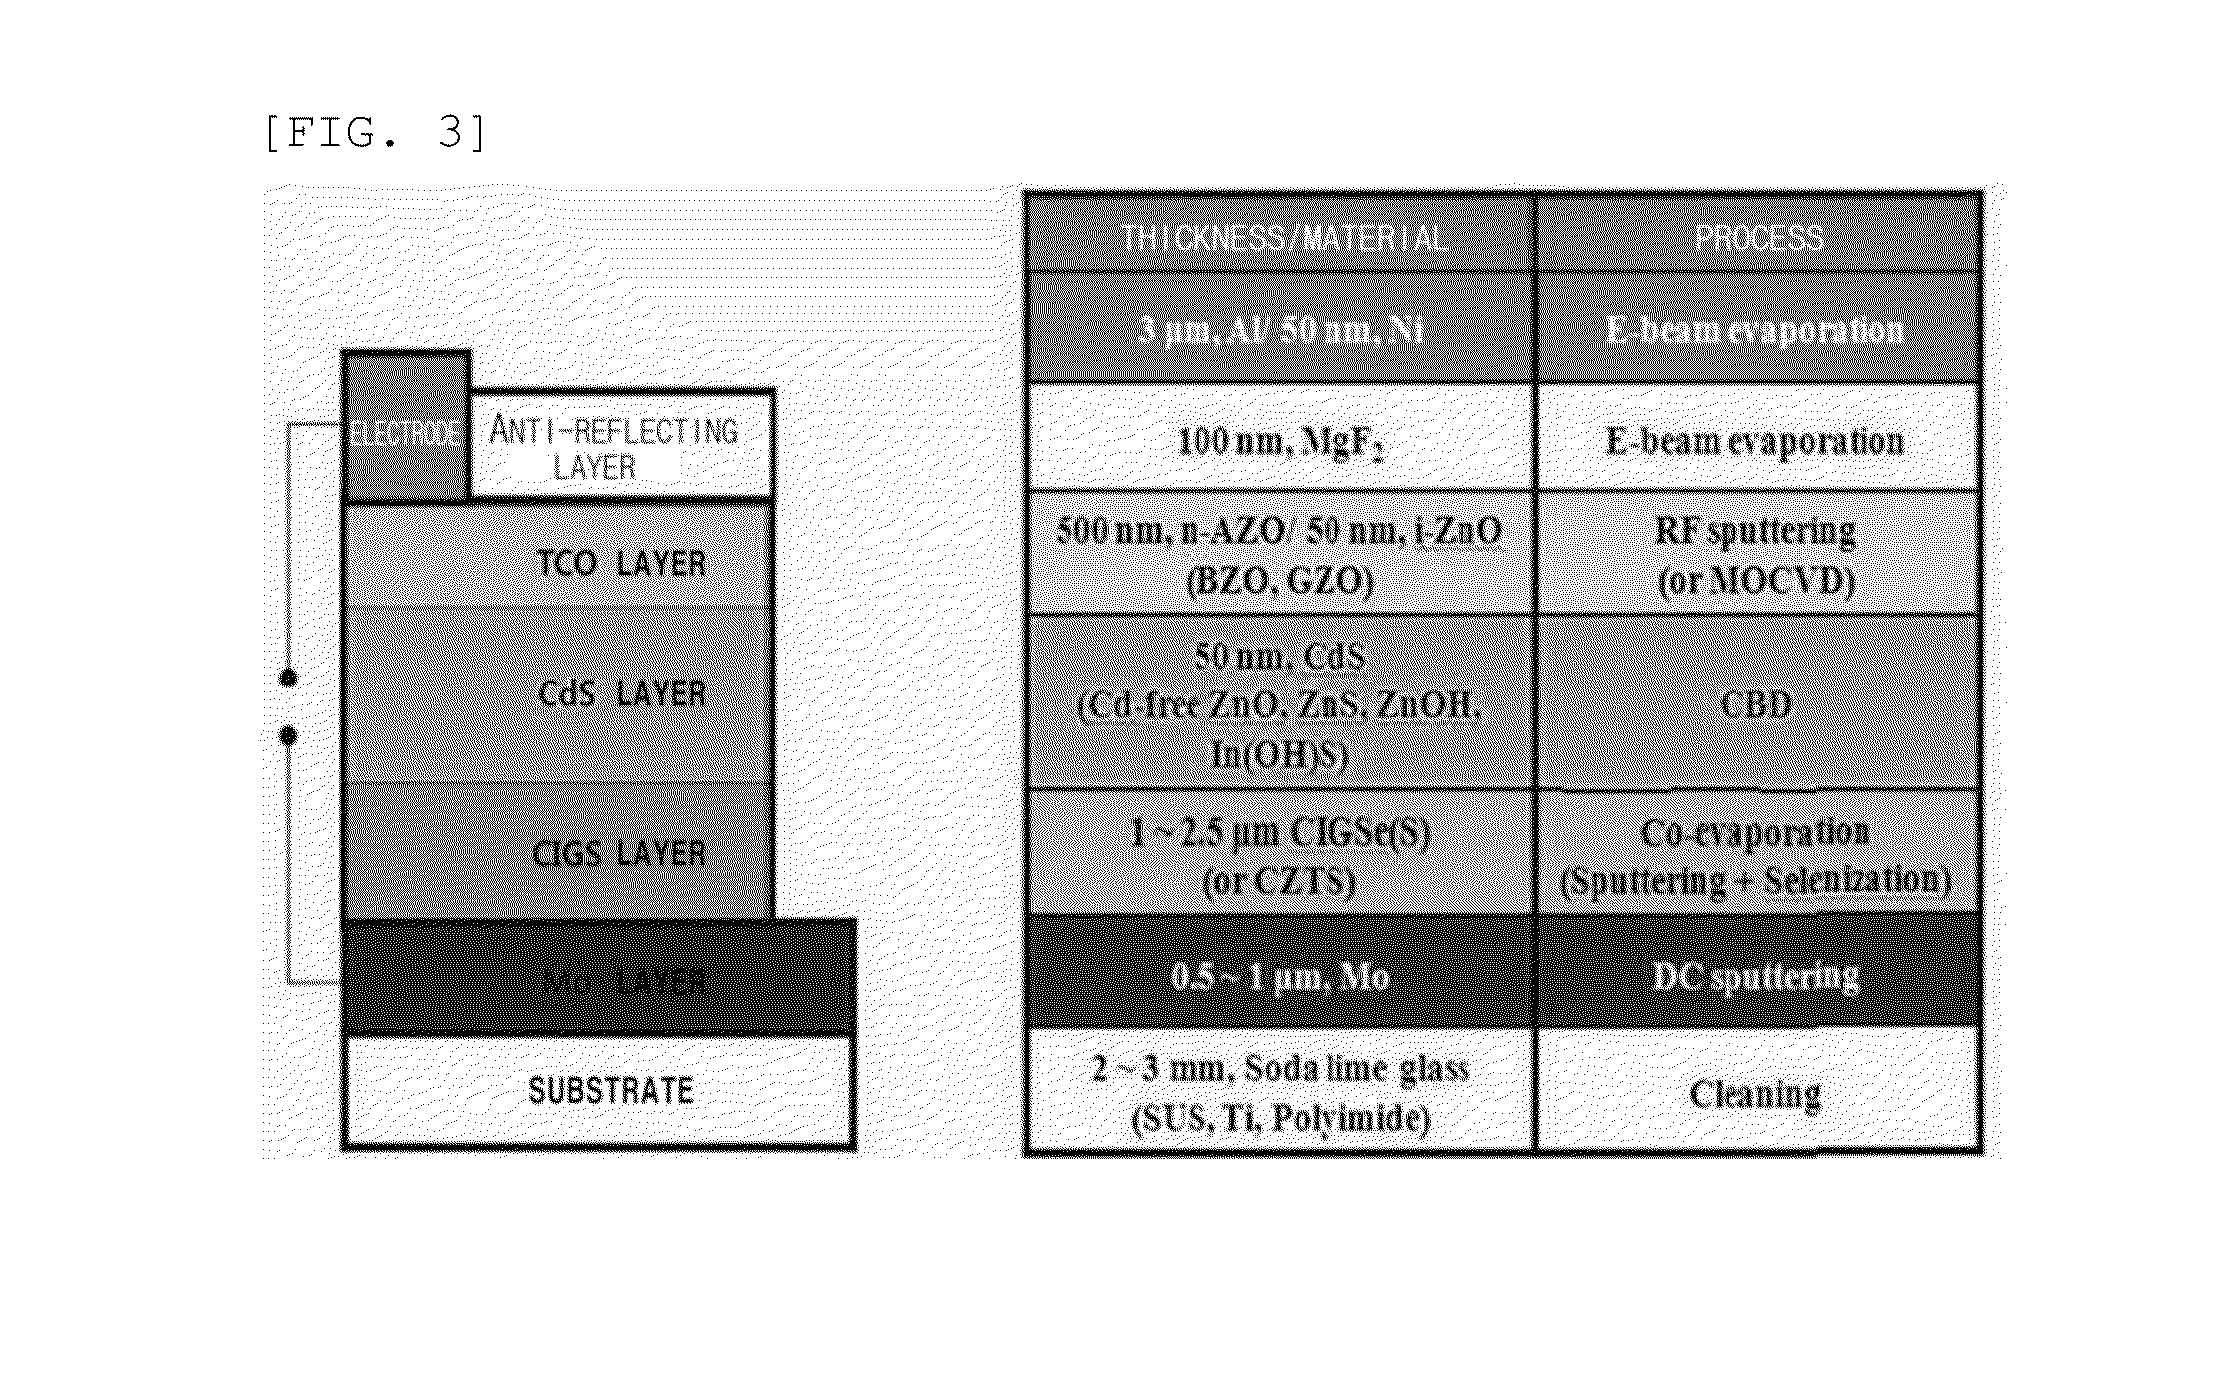
[0050]Nine CIGS samples having different component compositions, respectively, were prepared and used for a LIBS analysis. Each component composition and thickness of each sample was measured by X-ray fluorescence (XRF).

TABLE 1Se / CuCIGSSampleConcentration (at %)ConcentrationCIGSDepositionNo.CuInGaSeRatioThicknessMethod124.918.9313.5552.612.111.55Co-(±0.17)(±0.05)(±0.08)(±0.20)(±0.02)evaporation222.9414.018.7954.262.372.49(±0.13)(±0.14)(±0.07)(±0.10)(±0.01)324.0513.249.0653.652.232.65(±0.14)(±0.16)(±0.11)(±0.09)(±0.01)424.5912.948.9453.532.182.52(±0.15)(±0.16)(±0.09)(±0.20)(±0.02)529.2516.880.2253.651.830.75Sputtering(±0.29)(±0.14)(±0.06)(±0.25)(±0.03)630.8516.420.2252.521.700.66(±0.49)(±0.18)(±0.06)(±0.34)(±0.04)731.7316.160.1751.931.640.68(±0.46)(±0.37)(±0.06)(±0.20)(±0.03)831.5116.260.1152.121.650.70(±0.48)(±0.34)(±0.05)(±0.22)(±0.03)929.5616.350.2653.831.820.80(±0.36)(±0.23)(±0.06)(±0.23)(±0.03)

[0051]LIBS spectra at 30 laser irradiation points were collected, the total 60 spectra...


PUM

PropertyMeasurementUnit
thicknessaaaaaaaaaa
thicknessaaaaaaaaaa
thicknessaaaaaaaaaa

Abstract

Disclosed herein is a quantitative analyzing method of a copper indium gallium selenide (CIGS) film, the method including: obtaining spectra by irradiating a laser on the plurality of CIGS films having different component compositions, selecting a first spectral line and a second spectral line among the spectra of target elements to be analyzed and obtaining a correlation plot between a measured intensity of the first spectral line and a measured intensity of the second spectral line, correcting the measured intensity of the first spectral line and the measured intensity of the second spectral line using results obtained by curve fitting the correlation plot, obtaining a linear calibration curve using the corrected intensity of the first spectral line and the corrected intensity of the second spectral line; and comparing the linear calibration curve with LIBS analysis of a target sample to be analyzed.

Description

CROSS REFERENCE TO RELATED APPLICATION[0001]This application claims the benefit of Korean Patent Application No. 10-2013-0052152, filed on May 8, 2013, which is hereby incorporated by reference in its entirety into this application.BACKGROUND OF THE INVENTION[0002]1. Technical Field[0003]The present invention relates to a quantitative analyzing method of a copper indium gallium selenide (CIGS) film using a laser induced breakdown spectroscopy.[0004]2. Description of the Related Art[0005]Plasma generated by laser irradiation emits light having a specific wavelength depending on the material on which the laser is irradiated. As a result, components of the material may be qualitatively or quantitatively analyzed by collecting the light. A laser induced breakdown spectroscopy (hereinafter, referred to as LIBS), which is one method of analyzing the components of the material using the collected light, is a spectroscopic analysis technology using plasma produced by generating breakdown, w...

Claims


Application Information

Patent Timeline
Patent Type & Authority Applications(United States)
IPC IPC(8): G01N21/71
CPCG01N21/718Y02E10/541Y02E10/543
Inventor JEONG, SUNGHOIN, JEONG HWANKIM, CHAN KYULEE, SEOKHEELEE, HAKJAE
Owner GWANGJU INST OF SCI & TECH
Learn More