Polyethersulfone filtration membrane
Inactive Publication Date: 2015-02-26
PRESIDENT & FELLOWS OF HARVARD COLLEGE
6 Cites 9 Cited by
AI-Extracted Technical Summary
Problems solved by technology
Results of this work showed that ZnO nanoparticles can improve membrane permeability and fouling resistance,...
View moreMethod used
[0041]The polyethersulfone can be added to the liquids for dissolution at a speed that is sufficient to prevent clumping. The polyethersulfone can be dissolved at a temperature that is sufficiently low to prevent the casting solution from becoming unstable. One skilled in the art will appreciate that the unstable characteristics of the casting solution are reversible when the solution is cooled. Generally the temperature is about room temperature. Some of the casting solutions can become cloudy at temperatures substantially higher than room temperature. Cooling the solution to 20° C. to 25° C. can remove the cloudiness.
[0068]It has now been found that integration of nanoclay into the PES or polysulfone solution results in membranes having improved properties. Nanoclays (nanosized clays) are nanoparticles of layered mineral silicates. Depending on chemical composition and nanoparticle morphology, nanoclays are organized into several classes such as montmorillonite, bentonite, kaolinite, hectorite, and halloysite. Organically-modified nanoclays (organoclays) are an attractive class of hybrid organic-inorganic nanomaterials with potential uses in polymer nanocomposites, as rheological modifiers, gas absorbents and drug delivery carriers. Clay can be modified to be more hydrophilic. Hydrophilic clays can be used as additive or catalyst to improve membrane properties. One can also exchange the cations in the clay to change the properties of the clay. For example, Ag+ can be added to provide antimicrobial properties to the clay. In another example, Fe2+ can be added to mediate production of reactive oxygen species (ROS).
[0177]Contact angle measurements: Membrane water contact angle measurements were made using a goniometer (Ramé-Hart Instrument Co.; Model 190 CA). Membranes used for contact angle evaluation were removed from water and immersed in isopropyl alcohol for 24 hours and then allowed to naturally dry to prevent pore collapse (Mark C. Porter, Ultrafiltration, Chapter 3—Handbook of industrial membrane technology. Edited by Mark C. Porter, Noyes Publications, 1990). Specimen preparation and contact angle measurement were carried out according to the ISO-15989 standard method (International Standard, Plastics—Film and sheeting—Measurement of water-contact angle of corona-treated films, ISO-15989, first edition (2004) 1-12).
[0183]Visual analysis of the SEM images of the membranes with increasing SHMP concentration (FIGS. 4A-4D) shows the effect of salt concentration on membrane structure. The membrane with 1% SHMP (FIG. 4B) has a well-defined finger-like pore structure with straighter and more continuous pores as compared to the control membrane (FIG. 4A). This structure should result in a lower membrane resistance for water flux and is confirmed by the results obtained in the dead-end permeation tests (Table 2). As the SHMP dopant concentration is increased, the finger-like structure is retained, but the pore continuity decreases and enclosed pores (FIGS. 4C and 4D), large macro voids, and sponge-like structures are formed at the bottom of the membrane (FIG. 4D). The loss of continuous finger-like pores across the membrane and the formation of enclosed pores and macrovoids at the bottom of the membrane will increase resistance for water flow, in agreement with dead-end flux measurements (Table 2). The formation of these structures may also result in a higher propensity for internal membrane fouling and subsequent loss of flow, as will be discussed later in the text.
[0207]Contact angle measurements: Membranes co...
View moreBenefits of technology
[0004]Even with the high potential for application of microfiltration and ultrafiltration membranes, a number of important scientific and engineering issues still need to be addressed such as the development of membranes with a reduced susceptibility towards fouling and understanding the fundamental processes that control membrane formation, morphology, and performance. Fouling is the complex interaction mechanism between the membrane and the diverse variety of species that are present in natural waters and wastewaters including ions, organics, and colloidal particles. See for example, G. Crozes, C. Anselme, G. Mallevialle, Effect of adsorption of organic matter on fouling of ultrafiltration membranes, Journal of Membrane Science, 84 (1993) 61-77; Ana Rita Costa, Maria Norberto de Pinho, Menachem Elimelech, Mechanisms of colloidal natural organic matter fouling in ultrafiltration, Journal of Membrane Science, 281 (2006) 716-725; and W Gao, Heng Liang, Jun Ma, Mei Han, Zhong-lin Chen, Zheng-shuang Han, Gui-bai Li, Membrane fouling control in ultrafiltration technology for drinking water production: A review, Desalination, 272 (2011) 1-8. Many studies have reported the viability of micro...
View moreAbstract
Provided herein are filtration membranes, method of manufacturing said membranes and use of such membranes for the removal of substances from fluids or substances.
Application Domain
Technology Topic
Image
Examples
- Experimental program(3)
Example
Example 1
Anion Dopant Effects on the Structure and Performance of Polyethersulfone Membranes
[0168]In regards to previous reports on inorganic salt casting solution dopants, the focus has been on how the metal cation affects the phase inversion thermodynamics and thus the resulting membrane morphology. Effects of inorganic salt dopants including zinc chloride, lithium bromide, lithium chloride, and potassium perchlorate have been previously examined. For example, a study by Kim and collaborators has shown that increasing the zinc chloride dopant concentration up to 3% weight to the weight of polysulfone resulted in a decreased membrane permeate flux and increased retention capacity (Sue Ryeon Kim, Kew Ho Lee, Mu Shik Jhon, The effect of ZnCl2 on the formation of polysulfone membrane, Journal of Membrane Science, 119 (1996) 59-6421). However, the membrane morphology was not examined in the study and the mechanism for decreased performance with zinc chloride addition remains unknown. Idris et al. (Novel high performance hollow fiber ultrafiltration membranes spun from LiBr dopes solution, Desalination, 249 (2009) 541-548) reported that the addition of 3% weight lithium bromide dopant to a polyethersulfone casting solution resulted in a pure water flux approximately 4 times higher than the membrane cast with no lithium bromide. The authors also reported a reduction of the membrane molecular weight cut-off (MWCO). The increasing in permeate flow with decreasing MWCO was attributed to a change in membrane morphology from a sponge-like structure to a finger-like structure. A similar study was completed by Ahmed et al. using lithium chloride as a polyethersulfone casting solution dopant (Iqbal Ahmed, Ani Idris, Narsul Fikry Che Pa, Novel method of synthesizing Poly(ether sulfone) membranes containing two solvents and a lithium chloride additive and their performance, Journal of Applied Polymer Science, 115 (2010) 1428-1437). They observed a similar performance enhancement in regards to the ultrapure water flux and the MWCO. However, the observed membrane morphologies were predominantly sponge-like with voids at the edges. Rahimpour et al. (Fabrication of polyethersulfone (PES) membranes with nano-porous surface using potassium perchlorate (KClO4) as an additive in the casting solution, Desalination, 258 (2010) 79-86) examined the use of potassium perchorate as a dopant over concentrations ranging from 0 to 5% weight to weight of polyethersulfone. The pure water flux was observed to decrease with increasing potassium perchlorate, but no significant change in the rejection was observed. Cross-sectional scanning electron microscopy images indicated that the membrane sponge-like structure increased in density with increasing salt dopant. These studies of inorganic salt dopants on membrane structure and performance have focused on the effects of the added cation such as ion-bridging between individual polymer molecules. Based on the results presented by Idris et al. and Ahmed et al., it could be inferred that the type of anion present in the inorganic salt, in this case bromide vs. chloride, may also effect membrane morphology and thus its performance. However, no in depth study of the effect of anion dopant type and concentration has yet to be reported.
[0169]In this work, the effect of various types and concentrations of inorganic salt casting solution dopants with a similar cation (sodium), but different anions; hexametaphosphate, sulfate, carbonate, chloride, and fluoride, on the structure and performance of polyethersulfone membranes was evaluated. Scanning Electron Microscopy (SEM) images of the membrane surface and cross-section and measurements of the membrane thickness, porosity, and water contact-angle were used to analyze the membrane structure. Ultrapure water dead-end flux and cross-flow permeation tests using ultrapure water, natural surface waters, various molecular weight aqueous polyethylene glycol solutions, and aqueous sodium alginate were used to analyze membrane performance. The optimal membrane in terms of pure water flux, alginate rejection, and susceptibility to natural water fouling was the membrane produced with 1% weight sodium hexametaphosphate casting solution dopant.
Experimental
[0170]Materials: Polyethersulfone (PES) VERADEL 3000P with an average molecular weight of 63,000 g mol−1 and a number average molecular weight of 19,000 g mol−1 was kindly donated by Solvay Advanced Polymer and was used as received to synthesize all of the membranes examined in this study. The technical specifications of the polymer can be obtained from Solvay (Solvay Advanced Polymers, Solution processing guide for polymer membranes, Technical Bulletin, (2010) 1-11). NMP (1-Methyl-2-pyrrolidinone; >99%) was acquired from Alfa Aesar and was used as received. Sodium hexametaphosphate (SHMP; (NaPO3)6), sodium sulfate (Na2SO4), sodium carbonate (Na2CO3), and sodium fluoride (NaF) were reagent grade and acquired from Sigma-Aldrich. Sodium chloride (NaCl) was also reagent grade and was acquired from Mallinckrodt Chemicals. The various number average molecular weight polyethylene glycol (PEG) samples; 10 kg mol−1, 20 kg mol−1, 50 kg mol−1, 90 kg mol−1, and 203 kg mol−1, were acquired from Polymer Source Inc. The sodium alginate was acquired from MP Biomedicals, LLC. The natural surface waters used for the fouling experiments were from the Fresh Pond Reservoir at the Cambridge Drinking Water Treatment Plant. For membrane casting and ultrafiltration experiments, ultrapure water with a resistivity of >18 MΩ was used (Nanopure Infinity Ultrapure Water System; Barnstead/Thermolyne).
[0171]Casting solution preparation and the membrane casting process: Membrane casting solutions were all prepared using a fixed concentration of PES (18% weight) dissolved in NMP following the procedure of Maximous et al. (Preparation, characterization and performance of Al2O3/PES membrane for wastewater filtration, Journal of Membrane Science, 34 (2009) 67-75). A membrane with only PES and NMP was prepared and used as a control. Inorganic salt dopants at concentrations of 1%, 2%, or 4% weight:weight salt:PES were added to the casting solution to evaluate specific anion effects. For the five inorganic salts evaluated, it was only possible to use concentrations higher than 1% weight for sodium hexametaphosphate due to solubility issues. Sodium carbonate (mostly undissolved) and sodium sulfate (mostly dissolved) did not completely dissolve in the NMP at 1% weight. For the doped casting solutions, the inorganic salt was first added to the NMP and stirred until dissolved. Then, the PES was added. The casting solutions were mixed for at least 24 hours using an overhead mixer (IKA RW 16 basic) with a 45-mm anchor stirrer to ensure complete polymer dissolution. Then, the casting solution was placed in an ultrasonic bath (Branson 2100) for 30 minutes to remove any dissolved gas and bubbles. Finally, the casting solution was left to rest overnight in the dark until membrane production.
[0172]All membranes were cast by the phase inversion process using an ultrapure water coagulation bath. Casting solutions were spread into thin films on a glass plate (20.5 cm×25.5 cm) using an automatic film applicator (Elcometer 4340 Automatic Film Applicator) and bar coaters (Elcometer) of thickness 100 μm or 175 μm. Immediately after spreading, <30 s, the glass plate with casting solution film was immersed in the coagulation bath where it remained for 20 minutes. Finally, the membranes were placed in a heated water bath at 30° C. for 24 hours to remove any residual solvent.
[0173]Ultrapure water flux evaluation—Dead-end: Initial membrane ultrapure water flux evaluation was conducted in a dead-end configuration depicted in FIG. 1. For all of the membranes, at least 9 total flux measurements were made using three circular samples of 47-mm diameter from the three thinnest membranes produced. Compressed air was used to pressurize the system over the range of 0.7 to 1.4 bar. Permeate flow was determined using a graduated cylinder and a stop watch with measurements taken every five minutes over a total period of sixty minutes.
[0174]Membrane morphology evaluation: Membrane porosities were estimated using measurements of the wet membrane weight and the dry membrane weight (E. Yuliwati, A. F. Ismail, Effect of additive concentration on the surface properties and performance of PVDF ultrafiltration membranes for refinery produced wastewater treatment, Desalination, 273 (2011) 226-234). All of the membranes used in the dead-end permeate flow tests in the previous section were subsequently used for the porosity measurements. After completing a dead-end experiment, the membrane sample was placed between two polyester/cellulose wipers (VWR—International) to remove any free surficial water and then immediately weighed. After taking the wet weight measurement, the membrane samples were immersed in isopropyl alcohol for 24 hours to remove any water and then allowed to air dry in a dessicator. Immediately after removal from the dessicator, the dry membrane weight measurement was made. The porosity of each membrane was obtained using equation 1.
ɛ ( % ) = m 1 - m 2 ρ w V m · 100 ( 1 )
[0175]Where m1 and m2 are membrane wet and dry weights, respectively, ρw is the specific density of water, Vm is the membrane volume, and ε is the membrane porosity. The membrane volume, Vm, was determined by measuring sample thickness and diameter. The average membrane thickness was obtained through five measurements at different points on each membrane sample using a digital micrometer (Fowler Tools and Instruments; 0.00005″ to 1.0″).
[0176]Membrane cross sections and surfaces were imaged at Harvard University's Center for Nanoscale Systems using a Field Emission Scanning Electron Microscope Ultra 55 (FESEM Ultra 55). For cross-sectional images, the membrane samples were immersed in liquid nitrogen for at least 60 s and then immediately snapped in two after removal to achieve a clean cut. All membrane samples were fixed to SEM stubs using double-sided conductive carbon tape. For membrane surface images, the samples were coated with a ˜4 nm layer of a conductive metal (Pt or Pd/Pt), while samples for cross-sectional images were imaged uncoated (Nermen Maximous, G. Nakhla, W. Wan, K. Wong, Preparation, characterization and performance of Al2O3/PES membrane for wastewater filtration, Journal of Membrane Science, 34 (2009) 67-75). SEM membrane images were analyzed with ImageJ software (NIH). Methods developed by Nakao et al. (Determination of pore size and pore size distribution 3. Filtration membranes, Journal of Membrane Sciences, 96 (1994) 131-165) and Fratila-Apachitei et al. (Influence of membrane morphology on the flux decline during dead-end ultrafiltration of refinery and petrochemical waste water, Journal of Membrane Sciences, 182 (2001) 151-159) were utilized to determine membranes pore size distribution, and surface porosity.
[0177]Contact angle measurements: Membrane water contact angle measurements were made using a goniometer (Ramé-Hart Instrument Co.; Model 190 CA). Membranes used for contact angle evaluation were removed from water and immersed in isopropyl alcohol for 24 hours and then allowed to naturally dry to prevent pore collapse (Mark C. Porter, Ultrafiltration, Chapter 3—Handbook of industrial membrane technology. Edited by Mark C. Porter, Noyes Publications, 1990). Specimen preparation and contact angle measurement were carried out according to the ISO-15989 standard method (International Standard, Plastics—Film and sheeting—Measurement of water-contact angle of corona-treated films, ISO-15989, first edition (2004) 1-12).
[0178]Molecular weight cut-off evaluation—Cross-flow: Membrane molecular weight cut-off was evaluated using the cross-flow filtration setup depicted in FIG. 2. The membrane was held in an acrylic flow cell with an active filtration area of 34 cm2. The thinner membranes were used for these experiments. Each membrane was challenged once with PEG solutions of molecular weights of 10, 20, 50, 90, and 203 kg mol−1. The feed solutions were 4.0 mg L−1 PEG in ultrapure water. All tests were run for one hour. Permeate samples were collected at 30, 45, and 60 minutes after steady state operation was achieved and feed samples were collected at the end of each experiment. The feed and permeate PEG concentration was measured using the non-purgeable organic carbon (NPOC) analysis on a total organic carbon (TOC) analyzer (Shimadzu TOC-VWS). The membrane molecular weight cut-off was determined using the method described by Porter (Mark C. Porter, Ultrafiltration, Chapter 3—Handbook of industrial membrane technology. Edited by Mark C. Porter, Noyes Publications, 1990).
[0179]Membrane performance evaluation—Cross-flow rejection and fouling: For the control membrane and the membranes with highest permeate flow in dead-end tests; 1% (NaPO3)6, 1% Na2SO4, and 1% NaCl, fouling experiments with natural surface waters and aqueous sodium alginate were performed using the cross-flow filtration setup depicted in FIG. 2. The experiments were run for two hours. For sodium alginate fouling and rejection, a thinner membrane in an acrylic flow cell with an active filtration area of 34 cm2 was challenged with a 15 mg L−1 sodium alginate solution. For fouling tests with natural waters, a thicker membrane in an acrylic flow cell with an active filtration area of 94 cm2 was challenged with both ultrapure water and natural water. The operational pressure ranged from 1.5 to 5.0 bar. Permeate sodium alginate concentration was determined using the same NPOC analysis as described in the previous section using a conversion factor of 0.364 (NPOC/Sodium alginate) to calculate the sodium alginate concentration. Three permeate samples were collected at 60, 90, and 120 minutes of operation and one feed sample was collected at the end of each experiment to determine the sodium alginate rejection.
Results and Discussion
[0180]Dead-end permeate evaluation: Results from the ultrapure water dead-end flux experiments are displayed in FIG. 3. The addition of inorganic salts to the casting solution is observed to significantly affect the membrane permeability (FIG. 3A). As inorganic salts with a similar cation were used, it is evident that the specific anion plays an important role in the phase inversion process and subsequent membrane permeability. The magnitude of the affect is salt dependent with hexametaphosphate>sulfate>chloride and all three membranes showing a >2-fold increase in permeability as compared to the control. Since the hexametaphosphate results were so promising, a range of SHMP % weight to polymer concentrations was also examined (FIG. 3B) in regards to permeability. However, at the two higher weight percentages evaluated, the permeability was lower than observed at one-percent hexametaphosphate. Similar observations of optimal inorganic or organic additive concentration effects on membrane performance have been previously reported. See for example, [22, 23, 26, 27, 31, 32] Ani Idris, Iqbal Ahmed, Misni Misran, Novel high performance hollow fiber ultrafiltration membranes spun from LiBr dopes solution, Desalination, 249 (2009) 541-548; Iqbal Ahmed, Ani Idris, Narsul Fikry Che Pa, Novel method of synthesizing Poly(ether sulfone) membranes containing two solvents and a lithium chloride additive and their performance, Journal of Applied Polymer Science, 115 (2010) 1428-1437; Nermen Maximous, G. Nakhla, W. Wan, K. Wong, Preparation, characterization and performance of Al2O3/PES membrane for wastewater filtration, Journal of Membrane Science, 34 (2009) 67-75; E. Yuliwati, A. F. Ismail, Effect of additive concentration on the surface properties and performance of PVDF ultrafiltration membranes for refinery produced wastewater treatment, Desalination, 273 (2011) 226-234; A. Rahimpour, S. S. Madaeni, Y. Mansourpanah, The effect of anionic, non-ionic and cationic surfactants on morphology and performance of polyethersulfone ultrafiltration membranes for milk concentration, Journal of Membrane Sciences, 296 (2007) 110-121; and G. Arthanareeswaran, T. K. Sriyamuna Devi, D. Mohan, Development, characterization and separation performance of organic—inorganic membranes Part II. Effect of additives, Separation and Purification Technology 67 (2009) 271-281. It is also important to note, that not all the inorganic salt dopants, sodium carbonate and fluoride for example, improve membrane permeability. In the case of sodium carbonate, this is due to the low salt solubility in the NMP i.e., the majority of the sodium carbonate added did not dissolve, resulting in a membrane permeability that was statistically the same at a 95% confidence level (P-value −0.058) to the control membrane. Thus, one explanation for the observed anion effects on membrane performance is related to salt solubility in the casting solvent. Another hypothesis for the observed differences in membranes permeability with specific anion casting solution dopant may be related to the specific anion hydration energy since the two most permeable membranes were produced using multivalent anions. If the anion has greater hydration energy, then the non-solvent water may diffuse more quickly into NMP solvent during phase inversion resulting in a change in membrane structure. The hydration energies for each anion additive (Derek W. Smith, Ionic hydration enthalpies, Journal of Chemical Education, volume 54, n° 9 (1977) 540-542 and Michael E. Colvin, Earl Evleth, Yamina Akacems, Quantum chemical studies of pyrophosphate hydrolysis, Journal of American Chemical Society, 117 (1995) 4357-4362) and the average membrane permeate flux are presented in Table 1. There is no obvious correlation between anion hydration energy and permeate flux. Thus, rather than attempting to determine the specific anion mechanistic effect on the phase inversion process, correlations between the resulting membrane morphology and performance will be made in the following sections.
TABLE 1 Anions hydration energy and membrane permeate flux for different anions used as additive in dope casting solutions. Hydration Average permeate Anion energy(−kJ · mol−1) flux (L · h−1 · m−2 · bar−1) Chloride 381 391 Fluoride 515 159 Sulfate 1059 455 Carbonate1 1314 221 Phosphate 2282 490 1Salt has not been dissolved
[0181]Membranes morphology: It is well known in the literature that addition of a casting solution dopant or coagulation bath dopant will result in changes to membrane properties and structure (Mark C. Porter, Ultrafiltration, Chapter 3—Handbook of industrial membrane technology. Edited by Mark C. Porter, Noyes Publications, 1990). Thus, for all membranes, the membrane thickness, porosity, and contact angle were measured. This data is presented in Table 2 along with their corresponding membrane permeabilities for membranes spread with the 100 μm bar coater. The porosity of the membrane with 2% SHMP was not calculated as it was not weighed before immersing in isopropyl alcohol. Analyzing the data in Table 2, it is observed that the specific type and concentration of the anion casting solution dopant did affect these membrane properties. However, the changes to the thickness, porosity, and contact angle did not correlate well to the changes in membrane permeability. One observed trend is that with increasing concentration of the hexametaphosphate dopant, the membrane contact angle is observed to decrease. A decrease in contact angle and thus increase in membrane hydrophilicity would be expected to result in increased pure water flux, in contrast to observed results. In regards to all the 1% anions, the contact angle has been increased as compared to the control in all cases except for fluoride, which resulted in the membrane with the lowest contact angle. The decreased contact angle with the higher hexametaphosphate and fluoride dopants suggests these anions may be incorporated into the membrane. Another exception is observed in the membrane thickness, since none of the dopants resulted in a change of membrane thickness except chloride, which had a 10-20% reduction in thickness suggesting chloride affects the casting solution viscosity. No definitive conclusions can be drawn about anions influence on membrane porosity due to the imprecision of the method and lack of any observable trend. Finally, the major point from this data is there is no observable correlation between membrane thickness, porosity, and contact angle and the membrane permeability. Thus, an attempt was made to correlate pore size and structure to performance.
TABLE 2 Effect of anions additions on membrane thickness, porosity, contact angle, and average permeate flux. Contact Permeate Thickness Porosity Angle Flux (L h−1 Membrane (μm) (%) (Degrees) m−2 bar−1) Control 57.0 ± 0.8 68.0 ± 1.2 62.7 ± 2.9 174.6 SHMP - 1% 58.0 ± 1.4 63.9 ± 1.7 65.7 ± 3.9 489.8 SHMP - 2% 57.6 ± 4.3 nc 60.3 ± 3.7 293.1 SHMP - 4% 57.8 ± 0.9 68.2 ± 2.6 51.7 ± 3.1 200.3 Na2SO4 - 1% 57.1 ± 0.8 62.4 ± 7.2 67.7 ± 3.4 454.8 NaCl - 1% 51.6 ± 0.5 69.7 ± 2.7 72.4 ± 4.5 390.5 Na2CO3 - 1%a 58.5 ± 1.2 65.9 ± 2.1 68.0 ± 2.8 220.6 NaF - 1% 57.4 ± 0.7 65.6 ± 2.4 49.7 ± 2.0 158.8 asalt did not dissolved, nc—not calculated
[0182]Membrane pore structure is a relevant morphological characteristic that can be used in association with others membrane properties to predict performance. Here, the influence of the specific type and concentration of the anion casting solution additives on membrane morphology is obtained by an in-depth analysis of both membrane surface and cross-sectional SEM images. A cross-sectional SEM image for every membrane cast with the 100-μm bar coater is presented in FIG. 4. It is obvious that the type and concentration of anion casting solution dopant significantly affected the membrane pore structure. Therefore, altering the specific anion casting solution dopant may be a strategy to rationally design membrane structure and performance.
[0183]Visual analysis of the SEM images of the membranes with increasing SHMP concentration (FIGS. 4A-4D) shows the effect of salt concentration on membrane structure. The membrane with 1% SHMP (FIG. 4B) has a well-defined finger-like pore structure with straighter and more continuous pores as compared to the control membrane (FIG. 4A). This structure should result in a lower membrane resistance for water flux and is confirmed by the results obtained in the dead-end permeation tests (Table 2). As the SHMP dopant concentration is increased, the finger-like structure is retained, but the pore continuity decreases and enclosed pores (FIGS. 4C and 4D), large macro voids, and sponge-like structures are formed at the bottom of the membrane (FIG. 4D). The loss of continuous finger-like pores across the membrane and the formation of enclosed pores and macrovoids at the bottom of the membrane will increase resistance for water flow, in agreement with dead-end flux measurements (Table 2). The formation of these structures may also result in a higher propensity for internal membrane fouling and subsequent loss of flow, as will be discussed later in the text.
[0184]For the membrane cast with the sodium sulfate dopant, there is a noticeable change in membrane pore structure as compared to control membrane. The sulfate dopant results in a periodic pore profile with a small sponge-like layer at the surface, then large finger-like pores for the next ⅔ of the membrane thickness, and large voids at the bottom ⅓ thickness (FIG. 4E). This larger upper pore structure profile and open bottom structure results in a membrane with lower resistance to water flow as compared to the control. However, the resistance is expected to be a bit greater in comparison to the membranes with no such a bottom void structure (1% SHMP; FIG. 4B), as confirmed by the results obtained in the dead-end permeate flow evaluation.
[0185]The polyethersulfone membrane cast with the 1% NaCl dopant resulted in the most unique structure of all the cast membranes (FIG. 4F). Instead of the upper finger-like pore structure observed in all the other membranes, chloride addition resulted in a sponge-like structure for the upper 50% of the membrane thickness and a mixed finger-like macro-void structure for the remaining 50% of the membrane. This structure configuration resulted in a lower membrane resistance for dead-end permeate flux. Although the pure water flux has increased as compared to the control, the sponge-like pore structure may result in increased fouling as there is a large amount of internal surface area to collect foulants. One possible explanation for the formation of the sponge-like structure could be strong propagation of the typically thin asymmetric membrane skin layer due to very fast water diffusion into the casting solution as a result of the chloride dopant. This increases the polymer concentration in the non-solvent propagation wave very rapidly resulting in an extended sponge like structure, in agreement with previous literature (Strathmann, Heiner, Synthetic membranes and their preparation, Chapter 1—Handbook of industrial membrane technology. Edited by Mark C. Porter, Noyes Publications, 1990). The sponge-like structures are denser than the finger-like structures, in agreement with the lesser thickness of the membrane casted with NaCl addition (Table 2).
[0186]Finally, for the membranes casted with Na2CO3 and NaF dopants (FIGS. 4G and 4H), it is not possible to identify any significant change in membrane structure as compared to the control membrane. This would indicate that there should be minimal difference in the membrane resistance to water flow, in agreement with the dead-end permeate flow evaluation tests.
[0187]Along with cross-sectional SEM images, top surface membrane SEM images of 500 kX magnification were also taken to examine any specific anion effects on pore size distribution and surface porosity. To determine membrane surface porosity and pore size distribution, surface SEM images were quantitatively analyzed using the “Analyze Particles” function of the ImageJ software. A SEM image of control membrane before and after manipulation is presented in FIG. 5. Pore size distributions and surface porosity were then calculated using automated measurements of the manipulated image, as presented in FIG. 6. The lines in FIG. 6 are fits to the experimental data using the log normal model. For membranes with 1% and 2% of SHMP (FIG. 6B), 1% of Na2CO3, and 1% NaF (FIG. 6C), there is no significant difference in the pore size distribution profile as compared to the control membrane (FIG. 6A). A broadened and greater pore size distribution and a larger surface porosity are observed for the sulfate and chloride doped membranes (FIG. 6) with a significant sponge-like layer at the surface. These membranes were among the three with the greatest dead-end flux indicating surface pore size and porosity greatly affect water flux. However, even though the surface porosity of the sulfate and chloride membranes was 2-fold greater than the 1% SHMP membrane, their permeabilities were slightly lesser than the 1% SHMP membrane indicating that internal finger-like pore structure is more important to membrane permeability.
[0188]A negative implication related to a broadened pore size distribution and large surface porosity is the potential for internal fouling, as larger foulants and a greater number of foulants can enter the membrane and can subsequently obstruct the internal pores. Based on the SEM images presented in FIG. 4 and the pore size distribution profiles and surface porosities presented in FIG. 6, it is expected that membranes cast with Na2SO4, NaCl, and 4% SHMP dopants will have the highest potential for fouling due to their broadened pore size distribution. The fouling potential of the membrane cast with NaCl is expected to be the highest due to the presence of broad pore size distribution, high surface porosity, and a thick, sponge-like upper layer that can act as a depth filter.
[0189]Based on the analysis of membranes pore structure and size distribution, it is clear that specific anions can significantly affect these morphological characteristics. Remarkably, hexametaphosphate anions at the optimal concentration can extend the finger-like pore structure across the whole membrane cross-section without significantly affecting the pore size distribution or surface porosity. This extended finger-like morphology of similar pore size improves membranes permeability without reduction of rejection capacity. Membranes that presented finger-like pore structure, but with large enclosed pores or voids near the bottom of the membrane e.g., the 2% and 4% hexametaphosphate and 1% fluoride, displayed a lower permeability, indicating the voids act as resistance toward water flow. The use of sulfate anions resulted in a membrane with a three-layer configuration; a small sponge-like layer at the top, a very wide and straight finger-like structure beneath for ⅔ of membrane thickness, and then large voids at the bottom of the membrane. Even though this structure results in a high permeability, the sponge layer at the top and voids at the bottom will significantly increase the membrane fouling potential, which will be amplified by the broad pore size distribution and increased surface porosity. Membranes cast with chloride anions resulted in a predominantly sponge-like structure at the membrane top, over a layer with a combination of large finger-like pores and voids, with a broad pore size distribution, and the highest surface porosity. This kind of structure resulted in a membrane with high permeability, but also with a high fouling potential. The sponge-like structure will function as a depth filter and entrap contaminants (Perry van der Marel, Arie Zwijnenburg, Antoine Kemperman, Matthias Wessling, Hardy Temmink, Walter van der Meer, Journal of Membrane Science 348 (2010) 66-74). Based on these observations, it is possible to conclude that the best morphology for drinking water treatment membranes is one that presents a narrow surface pore size distribution and straight finger-like pores that extend all the way through the membrane. This optimal structure was obtained here by use of sodium hexametaphosphate as a casting solution dopant.
[0190]Molecular weight cut-off evaluation: For the membranes that presented the highest dead-end water fluxes as compared to the control membrane (Na2SO4; (NaPO3)6; NaCl) and the control membrane itself, a molecular weight cut-off (MWCO) evaluation was carried out using five different molecular weight PEGs ranging from 10 to 203 kg mol−1, as described above. The percent retention versus PEG molecular weight for the four membranes is presented in FIG. 7. The lines are fits to the experimental data using the Hill model.
[0191]As used herein, a membrane's molecular weight cut-off is defined as the molecular weight of a compound, in this case a PEG polymer, that is ≧90% retained by the membrane [14]. From the results displayed in FIG. 7, the MWCO can be determined for all membranes except the one cast with Na2SO4 dopant, since 90% retention was never attained. In agreement with this membrane's wide pore size distribution (FIG. 6c). The NaCl membrane also had a wide pore size distribution, but achieved 90% retention around 60 kg mol−1. Among all membranes tested, the 1% SHMP was the most restrictive having a MWCO around 43 kg mol−1. The MWCO of the control membrane was around 53 kg mol−1. These results are in agreement with the results for average membrane pore sizes (FIG. 7) as a correlation between membrane pore size and molecular weight cut-off is expected (Mark C. Porter, Ultrafiltration, Chapter 3—Handbook of industrial membrane technology. Edited by Mark C. Porter, Noyes Publications, 1990). The exception here is the membrane cast with 1% NaCl and the unexpected retention capacity can be explained by the sponge-like structure of the upper 50% of the membrane. The dense sponge may have internal pores of lesser diameter than the surface pores resulting in a lower MWCO than expected from mean surface pore size. This behavior is in agreement with the hypothesis that membranes with this dense sponge-like structure can operate as a depth filter and thus have more potential for internal fouling (Perry van der Marel, Arie Zwijnenburg, Antoine Kemperman, Matthias Wessling, Hardy Temmink, Walter van der Meer, Journal of Membrane Science 348 (2010) 66-74).
[0192]Membrane performance evaluation—Alginate retention and fouling susceptibility: The performance evaluation experiments were completed in the cross-flow configuration for the membranes that presented the highest dead-end water fluxes as compared to the control membrane (Na2SO4; (NaPO3)6; NaCl) and the control membrane itself. These four membranes were challenged with a 15 mg L−1 sodium alginate solution as an extreme case to evaluate membrane fouling potential and retention capacity for colloidal natural organic matter removal. The relative flux of the alginate containing solution to the ultrapure water or JSAS/JUPW for steady-state conditions i.e., the final hour of a two hour experiment, is plotted against the membrane sample in FIG. 8 with the UPW flux, sodium alginate removal efficiencies, and membrane thicknesses. It is of note that the UPW flux is lower for the cross-flow configuration, FIG. 8, as compared to the dead-end configuration, FIG. 3. This difference is associated with variation in membrane sample size e.g., 17 cm2 in dead-end and 34 cm2 in cross-flow, and with uncontrolled variations during the membrane casting process. This is supported by the flux results obtained for cross-flow MWCO evaluations, where the UPW flux for the Control, 1% SHMP, 1% Na2SO4, and 1% NaCl membranes were 162, 387, 268, and 235 LHM-bar, respectively. In all cases, the UPW flux for the doped membranes is always significantly greater than the control membrane.
[0193]Results depicted in FIG. 8 clearly show the higher alginate fouling potential of the membranes cast with Na2SO4 and NaCl with JSAS/JUPW˜0.35. The control membrane and the membrane cast with SHMP presented less susceptibility for alginate fouling at JSAS/JUPW˜0.53. The alginate removal results, also presented in FIG. 7, indicate that all four membranes have high a potential, >88.4% in all cases, for colloidal natural organic matter removal. The membrane cast with SHMP had the highest alginate retention at 96.5%, in agreement with its small pore size distribution and lowest MWCO. These results are in agreement with what was predicted based on the analysis of membranes structures as discussed above. Membranes with a predominantly finger-like pore structure and narrow pore size distribution at the surface will present higher retentivity capacity and lower potential for fouling, compared with the membranes with sponge-like and void pore structure and broader pore size distribution. Marel et al. (Journal of Membrane Science 348 (2010) 66-74)] and Hashino et al. (Effect of membrane surface morphology on membrane fouling with sodium alginate, Journal of Membrane Science 366 (2011) 258-265) have reported similar results.
[0194]In order to evaluate membrane susceptibility to fouling in regards to drinking water treatment, experiments were completed with natural surface waters from a local reservoir. Natural water samples were collected from Fresh Pond, the holding pond for Cambridge's Walter J. Sullivan Water Treatment Facility. The characteristics of the natural water are presented in Table 3 (Dowling, Edward, Monthly water quality and quality report, City of Cambridge, Water Department, June 2011) and the results of the Fresh Pond natural water (NTW) relative to ultrapure water flux (UPW) or JNTW/JUPW, together with membranes thicknesses and UPW fluxes, are presented in FIG. 9.
TABLE 3 Fresh Pond water characteristics Quality indicator Results E-coli bacteria (UFC per 100 mL) 5 Total Organic Carbon (mgC L−1) 3.8 UV-254 nm absorption (cm−1) 0.119 Turbidity (NTU) 0.60 Conductivity (μS cm−1) 525
[0195]It is of note that the cross-flow permeate flux is significantly lesser in FIG. 9 than FIG. 8. The drastic reduction in cross-flow permeate flux is primarily due to the use of membranes with increased thickness i.e., a 175-μm bar coater was used to produce membranes for FIG. 9 and a 100-μm bar coater for FIG. 8. The membranes cast with an increased thickness result in obvious changes to the internal pore structure as depicted in FIG. 10. For example, the thicker membranes also have thicker pore walls and a mixed void-sponge-layer at the bottom of the membrane. Both of these new structures are expected to decrease membrane permeability, as observed, due to an increased resistance for water flow. Similar reductions in flow rate with membrane thickness increasing have been previously reported. For example, a 5.5-fold decrease in pure water flux was correlated to a 50% increase in polysulfone membrane thickness (C. Barth, M. C. Gonçalves, A. T. N. Pires, J. Roeder, B. A. Wolf, Asymmetric polysulfone and polyethersulfone membranes: effects of thermodynamic conditions during formation on their performance, Journal of Membrane Science 169 (2000) 287-299). Similar to FIG. 8, the UPW flux in the cross-flow configuration is again observed to be more highly dependent on the pore size distribution as the membrane with the largest pores, NaCl, is observed to have the largest UPW flux. This is in agreement with Poiseuiles's equation that can be used to predict pure water flow through porous media (Mark C. Porter, Ultrafiltration, Chapter 3—Handbook of industrial membrane technology. Edited by Mark C. Porter, Noyes Publications, 1990).
[0196]In regards to natural water fouling, once again the membrane cast with SHMP displayed the lowest susceptibility to fouling at JNTW/JUPW˜0.85. The sulfate and chloride membranes showed the highest potential for natural water fouling confirming that their sponge-like layer at the membrane surface has a high fouling potential. Overall, the membrane cast with 1% SHMP has now shown the best performance in regards to dead-end pure water flux at 490 LMH-bar and lowest susceptibility to both high concentration alginate fouling and natural surface water fouling.
[0197]The observed fouling behavior of the four membranes can be rationalized by considering their differences in contact angle and membrane structure. According to Table 1, the contact angles of the control membrane and the one cast with SHMP were slightly lower at 62.7 and 65.7 degrees, respectively, as compared to the Na2SO4 and the NaCl contact angles at 68 and 72 degrees. The contact angles are seemingly correlated to the susceptibility for fouling i.e., lower contact angle correlates to lower fouling. However, the absolute change in contact angle is relatively minor and many others factors can affect membrane fouling potential (Catharina Jönsson, Ann-Sofi Jönsson, Influence of the membrane material on the adsorptive fouling of ultrafiltration membranes, Journal of Membrane Science 108 (1995) 79-87). Another hypothesis is that differences in membrane structure could be responsible for the observed fouling behavior. Firstly, the membranes cast with Na2SO4 and NaCl displayed a much broader pore size distribution profile with the NaCl membrane displaying the largest pores (FIG. 6) in agreement with their fouling susceptibility. Increasing the size of the surface pores will increase the susceptibility of internal fouling since larger species can enter the internal membrane pores [38, 39]. Secondly, the membranes cast with Na2SO4 and NaCl both had a sponge-like structure at the membrane surface with the NaCl membrane having the upper 50% of its structure as sponge. These higher density sponge structures present a relatively high surface area-to-volume ratio and thus a high potential for fouling as the smaller internal pores are easily clogged and the high surface area allows for natural organic matter deposition. Thus, the presence and size of membrane surface sponge-like structure and membrane water contact angle are good predictors of a membrane's susceptibility to natural water fouling. See for example, Dowling, Edward, Monthly water quality and quality report, City of Cambridge, Water Department, June 2011; C. Barth, M. C. Gonçalves, A. T. N. Pires, J. Roeder, B. A. Wolf, Asymmetric polysulfone and polyethersulfone membranes: effects of thermodynamic conditions during formation on their performance, Journal of Membrane Science 169 (2000) 287-299; and Catharina Jönsson, Ann-Sofi Jönsson, Influence of the membrane material on the adsorptive fouling of ultrafiltration membranes, Journal of Membrane Science 108 (1995) 79-87.
[0198]Polyethersulfone ultrafiltration membranes were cast with the addition of different types and concentrations of inorganic sodium salts with varying anions (SHMP 1%, 2%, and 4% weight, Na2SO4, NaCl, Na2CO3, and NaF 1% weight, based on PES weight). The membranes were prepared, characterized, and tested to evaluate the influence of specific type and concentration of anion casting solution dopants on the morphology and performance of the prepared membranes. Dead-end filtration permeability experiments showed that only the membranes prepared with the addition of 1% SHMP (490), Na2SO4 (450) and NaCl (400) had significantly higher flow rates as compared to the control membrane (190 LMH-bar). Cross-sectional and surface SEM images provided insight into how the specific anion dopant affects the membrane pore size and structure that in turn gave insight into the improved dead-end permeability. The membranes prepared with 1% SHMP had the highest pure water flux as explained by their well-defined finger-like pore structure that extended from the top to the bottom of membrane. The structures associated with lower membrane permeabilities were non-straight, non-continuous fingers, large macro-voids and dense sponge-like structures. Pore size distribution for all of the membranes was obtained from membrane surface SEM. The control membrane and for the membranes prepared with SHMP, Na2CO3, and NaF additions had a tighter pore size distribution (5-20 nm) as compared to the broader pore size distribution (5-40 nm) for the Na2SO4 membrane and (5 to 50 nm) for the NaCl membrane. The broad pore size distribution is associated with a sponge-like structure being present at the surface, as seen with Na2SO4 and NaCl membranes. The SEM-determined membrane pore size distribution is well correlated with the experimentally-determined PEG molecular weight cut-off. The NaCl was the only exception retaining smaller PEG than expected indicating the dense, thick sponge-like region of the membrane has smaller internal pores as compared to its surface pores. This sponge-like structure is also observed to be correlated with an increased potential for internal fouling. Fouling evaluation using a sodium alginate solution and natural surface waters confirmed that not only is the membrane surface pore size distribution, but the membrane internal structure also plays an important role on potential for fouling. It is concluded that the specific type and concentration of the casting solution anion dopant can significantly change membrane morphology and in turn affect its performance for water treatment in regards to water flux and fouling potential. It has also been verified that membrane thickness is a critical factor to be considered for membrane design, since thicker membranes will present reduced flux, because of changes in internal pore structure. Among the anions evaluated, the membrane cast with 1% sodium hexametaphosphate displayed the highest flux and lowest potential for fouling and thus the greatest potential for improving ultrafiltration membrane morphology and performance.
[0199]In the work described herein, the effect of various casting solution salt dopants with similar cations, but different anions; (NaPO3)6, Na2SO4, Na2CO3, NaCl, and NaF, on the morphology and performance of polyethersulfone ultrafiltration membranes was evaluated. The phase inversion process was used to produce all membranes using an 18% polyethersulfone in n-methylpyrrolidone casting solution and water as the non-solvent. Scanning electron microscopy (SEM) images of the membrane cross-section and surface pores were used to determine the specific anion effects on membrane morphology. The SEM images depicted significant changes to the membrane internal structure and pore size with respect to the type and concentration of the casting solution anion dopant. Membrane permeability, molecular weight cut-off, alginate retention, and susceptibility to fouling were evaluated using ultrapure water dead-end and ultrapure water, aqueous polyethylene glycol, aqueous sodium alginate, and natural surface reservoir water cross-flow filtration tests. Among the anions evaluated, phosphate doped at 1% w/w to the polymer resulted in the membrane with highest dead-end permeability at 490 LMH-bar (2- to 3-fold greater than the control), greatest alginate retention at 96.5%, and lowest susceptibility fouling. The significant increase in membrane performance indicates that the phosphate anion has great potential to be used as a membrane casting solution dopant. It was also clearly demonstrated that membrane morphological characteristics can be effectively used to predict membrane drinking water treatment performance.
Example
Example 2
Effect of Clay Nanoparticles on the Structure and Performance of Polyethersulfone Ultrafiltration Membranes
[0200]Considering the limited set of data about the use of clay nanoparticles for membrane casting, in this work it was evaluated the use of different concentrations of unmodified clay nanoparticles on the morphology and performance of composite PES membranes, through Scanning Electron Microscopy (SEM) and dead-end and cross flow permeation tests, using ultrapure water, natural water, and polyethylene glycol solutions for Molecular Weight Cut-off (MWCO) determination. Phase inversion process was used for membrane casting and no other additive has been used in the dope casting solution or in the coagulation bath.
Experimental
[0201]Materials: For membrane casting polyethersulfone (PES) VERADEL 3000P with an average molecular weight of 63,000 g.mol−1 and number average molecular weight of 19,000 g.mol−1 was kindly donated by SolveyAdvanced Polymer and was used as it was received. Product technical specification could be obtained elsewhere (Solvay Advanced Polymers, Solution processing guide for polymer membranes, Technical Bulletin, (2010) 1-11). 1-Methyl-2-pirrolidinone 99+% (NMP) was acquired from Alfa Aesar, and was used as it was received. Sodium hexametaphosphate (SHMP), was acquired from Sigma Aldrich, and clay nanoparticles (Montmorillonite—PGV®) was kindly donated by Nanocor Company, and was used as it was received. Product technical specification is available elsewhere (Nanocor, Polymer grade montmorillonites, Technical data, Lit. G-105, revised 05/05/06.2p., available at www.nanocor.com/tech_sheets/G105.pdf). For ultrafiltration experiments polyethylene Glycol (PEG) 10 kg.mol−1, 20 kg.mol−150 kg.mol−1, 90 kg.mol−1, and 203 kg.mol−1, number average molecular weight, were acquired from Polymer Source Inc., and natural water from Fresh Pond Reservoir was obtained at the Cambridge Drinking Water Treatment Plant. For membrane casting and ultrafiltration tests, ultrapure water with a resistivity of 18 Mega Ohms was produced using the Nanopure Infinity Ultrapure Water System from Barnstead/Thermolyne.
[0202]Dope casting solutions preparation and membranes casting: Dope casting solutions were prepared using fixed concentration of PES (18% weight) and NMP (82% weight), based on the results obtained by Maximous et al. (NermenMaximous, G. Nakhla, W. Wan, K. Wong, Preparation, characterization and performance of Al2O3/PES membrane for wastewater filtration, Journal of Membrane Science, 34 (2009) 67-75). Dope casting solutions with and without SHMP as a dispersant were prepared with clay nanoparticles concentrations of 1%, 2.5%, and 5%, and 1%, 2%, 3%, and 5%, respectively (based on the PES mass). A membrane with no clay addition was also prepared to be used as a control.For dope casting solution preparation first, when applicable, SHMP (1% of PES mass) was added to the NMP, and after it was completely mixed, clay nanoparticles were added, and only after its dispersion PES polymer addition started. Dope casting solution was mixed for 24 hours using an overhead mixer (IKA RW 16 basic) with a 45 mm anchor stirrer, then it was put in an ultrasound bath (Branson 2100) for 30 minutes, and left to rest overnight in the dark. The same procedure was used to prepare the control membrane, except the salt addition step.
[0203]All membranes were casted using the phase inversion process, with ultrapure water in the coagulation bath, at room temperature (22° C.). Dope casting solutions were spread in a glass plate (20.5 cm×25.5 cm) using an automatic film applicator (Elcometer 4340 Automatic Film Applicator), and bar coaters with different thickness, 100 μm and 175 μm, from Elcometer Inc. Glass plate was kept in the coagulation bath for 20 minutes, and after that membranes were kept in a water bath at 30° C. for 24 hours, for residual solvent removal. No delays between dope casting solution spreading and coagulation bath immersion were allowed.
[0204]Ultrapure water flow evaluation: Membrane ultrapure water flow tests were conducted in a dead-end setup, depicted in FIG. 1. For each salt composition and for the control, three of the thinnest membranes were tested, using three different circular samples (47 mm diameter) of each membrane. Compressed air was used to pressurize the system and pressure test ranged from 0.7 bar to 1.4 bar. Permeate flow was determined using a graduated cylinder and a stop watch, with measures at each five minutes, for 60 minutes.
[0205]Membrane morphology evaluation: Membrane porosities were estimated based on pores water content and membrane weights (E. Yuliwati, A. F. Ismail, Effect of additive concentration on the surface properties and performance of PVDF ultrafiltration membranes for refinery produced wastewater treatment, Desalination, 273 (2011) 226-234). All membranes samples used in the dead-end permeate flow tests were used for porosity determination. After dead-end experiments each sample was put between two polyester/cellulose wipers (VWR—International) for free water removal and was immediately weighted. After that, membranes samples were immersed in isopropyl alcohol for 24 hours before natural drying, and were weighted again. The porosity of each membrane was obtained using equation 1,
ɛ ( % ) = m 1 - m 2 ρ w V m · 100 ( 1 )
where m1 and m2 are membrane wet and dry weights, respectively, ρw is the specific mass of water, Vm is the membrane volume, and ε is the membrane porosity. Vm was determined based on samples thicknesses and diameters. Average membrane thickness was obtained through five measurements of different points in each membrane sample using a digital micrometer from Fowler Tools and Instruments (0.00005″ to 1.0″).
[0206]Membranes cross sections and surfaces were imaged at the Center for Nanoscale Systems from Harvard University, using the Field Emission Scanning Electron Microscope Ultra 55 (FESEM Ultra 55). For cross section imaging membranes samples were immersed in liquid nitrogen for a clear breaking. All membrane samples were fixed in holders using double sided carbon adhesive tape. Samples for surface images were coated with a 4 nm layer of a conductive metal alloy, while samples for cross section images were not coated (NermenMaximous, G. Nakhla, W. Wan, K. Wong, Preparation, characterization and performance of Al2O3/PES membrane for wastewater filtration, Journal of Membrane Science, 34 (2009) 67-75). Membranes pore size distributions were obtained using the software ImageJ 1.44p from Wayne Rasband, National Institutes of Health, USA. This procedure was based on the works developed by Shin-ichiNakao (Determination of pore size and pore size distribution3. Filtration membranes, Journal of Membrane Sciences, 96 (1994) 131-165) and Lidy E. Fratila-Apachitei et al. (Influence of membrane morphology on the flux decline during dead-end ultrafiltration of refinery and petrochemical waste water, Journal of Membrane Sciences, 182 (2001) 151-159).
[0207]Contact angle measurements: Membranes contact angle were measured using a goniometer from Ramé-hart Instrument Co. (Model 190 CA). Membranes used for contact angle evaluation were removed from water and immersed in isopropyl alcohol for 24 hours before natural drying. This procedure was used to prevent pores collapse (Mark C. Porter, Ultrafiltration, Chapter 3—Handbook of industrial membrane technology. Edited by Mark C. Porter, Noyes Publications, 1990). Specimens' preparation and contact angle measurement were carried out according to the ISO-15989 standard (International Standard, Plastics—Film and sheeting—Measurement of water-contact angle of corona-treated films, ISO-15989, first edition (2004) 1-12). Two samples of each membrane type were evaluated with 20 measurements for each sample.
[0208]Molecular weight cut-off evaluation: Membranes molecular weight cut-off were evaluated in the cross flow filtration setup depicted in FIG. 2, using an acrylic flow cell with an active filtration area of 34 cm2, and thinnest membranes. One of each membrane with higher permeate flow and control membrane were challenge with PEG solutions of 10, 20, 50, 90, and 203 kg.mol−1, one each time. PEG concentration was evaluated using NPOC analysis, using a TOC analyzer from Shimadzu Scientific Instruments (TOC-VWS). Feed solutions with approximately 4.0 mg.L−1 of PEG (NPOC equivalent) were prepared with ultrapure water. All tests had been run for one hour. Permeate samples were collect at 30, 45 and 60 minutes after steady state operation was reached, and feed samples were collected at the end of each test for determining PEG rejection. Membrane molecular weight cut-off was determined as described by Porter (Ultrafiltration, Chapter 3—Handbook of industrial membrane technology. Edited by Mark C. Porter, Noyes Publications, 1990).
[0209]Membranes performance evaluation: For membranes with higher permeate flow in dead-end tests, compared to the control membrane, fouling tests with sodium alginate solution (SAS) were performed using a cross flow filtration setup, depicted in FIG. 2. Fouling tests with SAS(10 mg.L−1) were run for one hour and sodium alginate concentration was evaluated through Non-purgeable Organic Carbon (NPOC) measurements. One sample of each thinnest membrane was tested in the acrylic flow test cell. Before fouling tests were carried out, ultrapure water (UPW) permeate flux was obtained for each membrane. Operation pressure ranged from 1.5 bar to 5.0 bar.
[0210]Comparison of the results of this study with similar ones: In order to obtain a better understanding about the influence of clay and clay nanoparticles on membrane performance, a synthesis of the results obtained by the studies developed so far are tabulated together the ones obtained in this study.
Results and Discussion
[0211]Dead-end permeate flow evaluation: Membrane permeability tests using ultrapure water through a dead-end filtration setup is a straight forward and easy approach for a preliminary evaluation of the effect of clay nanoparticles additions on membranes characteristics. As one can see in FIGS. 11 and 12 additions of different concentrations of clay nanoparticles, with or without SHMP, affects membrane permeability, reaching a maximum for total additive concentration of 2%, only for clay nanoparticles or for clay nanoparticles and SHMP. Nevertheless, maximum permeate flux for each membrane type is different, with the best results for the membrane with only clay nanoparticles addition. This profile for membrane permeability variation with additive concentration increasing was also reported by others researchers (OriettaMonticelli, Aldo Bottino, Ivan Scandale, Gustavo Capanelli, Saverio Russo, Preparation and properties of polysulfone-clay composite membranes, Journal of Applied Polymer Science 103 (2007) 3637-3644 and NeginGhaemi et al., Preparation, characterization and performance of polyethersulfone/organically modified montmorillonite nanocomposite membranes in removal of pesticides, Journal of Membrane Science 382 (2011) 135-147), even though the additive concentrations used in this work were quite smalls. Without wishing to be bound by a theory, these changes in membrane permeability can be related only to changes in membrane morphology, what is evaluated in the specific section.
[0212]Membranes morphology: Results for membranes thickness and porosity are presented in Table 4, and results for contact angle variation are presented in FIG. 13.
TABLE 4 Effect of claynanoparticles additions on membrane thickness and porosity. Membrane Thickness (μm) Porosity (%) Control 57.0 ± 0.8 68.0 ± 1.2 1% Clay + SHMP 57.8 ± 1.1 65.7 ± 2.2 2.5% Clay + SHMP 58.3 ± 0.8 66.1 ± 1.9 5% Clay + SHMP 56.2 ± 0.9 65.0 ± 2.1 1% Clay 56.8 ± 2.0 67.8 ± 3.1 2% Clay 57.8 ± 0.8 69.5 ± 1.9 3% Clay 58.9 ± 1.0 72.7 ± 3.6 5% Clay 56.7 ± 1.7 66.9 ± 3.8
[0213]It is well known from the classical literature that any additive in the dope casting solution or in the coagulation bath can change membrane properties and structure [1]. Analyzing data presented in Table 4 it is not possible to correlate the changes in membranes permeability for ultrapure (FIGS. 11 and 12) with the variation of clay nanoparticles concentrations, with or without SHMP. That is because there are no significative changes in membranes thickness and porosity to justify the observed variation in permeation fluxes.
[0214]Results from contact angle measurements showed an exponential increasing in its value according to clay nanoparticle concentration increasing, with or without SHMP, reaching a plateau close to 70° (FIG. 13). This behavior was not expected since hydrophilic clay was used in the experiments. A possible explanation for this result might be associated to the absorption of NMP by clay nanoparticles during dope casting solution preparation, being kept in the membrane even after phase inversion and washing processes. The base for this hypothesis is the studies developed by Jankzuk and Biakopiotrowicz (Components of surface free energy of some clay minerals, Clay and Clay Minerals vol. 36, n° 3 (1988) 243-248) and by Jouany (Surface free energy components of clay-synthetic humic acids complexes from contact-angle measurements, Clay and Clay Minerals vol. 39, n° 1 (1991) 43-49), who studied the influence of organic solvents on clay surface free energy, indicating that water contact angle over clays are increased as clay is mixed with specific amounts of solvents. However, based on available data it is not possible to draw a definitive conclusion about observed changes in PES/Clay nanoparticles contact angles, as it is not possible to correlate these changes with ultrapure water flux.
[0215]Membrane pore structure and surface pore distribution are relevant morphological characteristics that can be used in association with other membrane properties for predicting its performance for water treatment. A better knowledge about the influence of clay nanoparticles on membranes morphology and pore distribution can be obtained by the analysis of SEM images, what will help to understand how membrane performance is affected. Cross-sectional SEM images for all membranes casted are presented in FIG. 14.
[0216]Through the analysis of FIG. 14 it can be seen that membrane internal pore structure changed as clay nanoparticle concentration was increased. For the membranes prepared with SHMP as a dispersant in dope casting solution (FIGS. 14B-14D) increasing the dosage of clay nanoparticles resulted in a more straighten pore profile, compared to the one from control membrane (FIG. 14A). With these changes in pore profile it would be expected a reduction on membrane internal resistance for water flow as clay nanoparticles concentration increased, what not happened. A closer look over internal pore structure at membranes top reveals slight changes on pore configurations, as can be seen in FIG. 15.
[0217]The first change that is worth to highlight is the increasing of sponge-like pore structure thickness at membrane surface with clay nanoparticles additions, what is better seen in FIGS. 15B and 15D. However observed changes in membranes permeate flux cannot be explained by these changes. Another change observed in membrane pore structure is the variation in the number and sizes of enclosed pores close to membranes surface. For control membrane, and membrane with 2.5% of clay nanoparticles addition (FIGS. 15A and 15C), it is possible to observe a more complex structure at the membrane top, with a higher number of small enclosed pores compared to other membranes (FIGS. 15D and 15E). Even for the membrane with 5% of clay nanoparticles (FIG. 15E), compared to the membrane with 1% of clay nanoparticles (FIG. 15B) additions, it is possible to notice a slight difference between the pore configuration of both membranes. Pores of membrane with 1% of clay nanoparticle seem to be more interconnected than the pores in membrane with 5% of clay nanoparticles addition. Since in the membrane with 1% of clay nanoparticles addition the number and size of enclosed pores are small compared to the membranes with 2.5% and no clay nanoparticles additions, and because of higher pore interconnectivity, compared to the membrane with 5% of clay nanoparticles addition, the resistance for water flow might be lower, what can help to explain the results obtained in the dead-end filtration tests. However other changes in membrane structure and properties, which cannot be identified through the analysis of SEM images, might also had been affected membranes permeability.
[0218]For membranes with clay nanoparticles without SHMP as dispersant agent (FIGS. 14E-14H), changes in internal pore structure are much more evident. Membrane with 2% of clay nanoparticle addition (FIG. 14F) presents a well-defined finger-like pore structure, with almost no small enclosed pores, compared with control and other membranes with only clay nanoparticle addition, what explain why the permeate flux for this membrane was the highest among all tested membranes in the dead-end filtration tests.
[0219]It is also important to mention that not only membrane internal pore structure is responsible for membrane performance, but also the surface pore size distribution. FIG. 16 presents the results obtained throughout the analysis of membranes SEM surface images using the ImageJ software.
[0220]As it can be seen in FIG. 16, for most casted membrane, compared to the control membrane (FIG. 16A), there was a reduction on the median pore size diameter of all membranes, from approximately 6 nm to 5 nm, but not for the membrane with only 2% of clay nanoparticle addition (FIG. 16C), which increased to 7 nm, while for all membranes with clay nanoparticles pore size distribution was broaden. Since changes in membranes pore size were not so significative, it can be concluded that differences observed in dead-end membrane flux is mainly related to the internal pore structure. However, differences in pore size distribution profile can have influence on membrane rejection capacity and fouling behavior, being expected a lower rejection capacity and higher fouling potential for membranes with broaden pore size distribution.
[0221]Molecular weight cut-off evaluation: For the membranes that presented higher fluxes compared to control membrane, a molecular weight cut-off evaluation was carried out using different molecular weight PEG polymer, as described above. FIG. 17 presents the results obtained in evaluation tests.
[0222]Since membrane MWCO is defined by the molecular weight of a compound which the retentivity was 90% (Mark C. Porter, Ultrafiltration, Chapter 3—Handbook of industrial membrane technology. Edited by Mark C. Porter, Noyes Publications, 1990), the MWCO of control membrane and the membrane with 1% clay nanoparticles and 1% of SHMP additions range from 50 to 60 kg.mol−1, and for the membrane with 2% of clay nanoparticle addition from 90 to 100 kg.mol−1. These results are in agreement with the results for pore size distribution in FIG. 16, when one considers the correlation between membrane pore size and molecular weight cut-off presented in the literature (Mark C. Porter, Ultrafiltration, Chapter 3—Handbook of industrial membrane technology. Edited by Mark C. Porter, Noyes Publications, 1990). As it was predicted after the analysis of membranes pore size distribution profile, the membrane with broader pore size distribution presented the lowest rejection capacity, but all prepared membranes can be classified as ultrafiltration.
[0223]Membranes performance evaluation: Tests with SAS were carried out to evaluate membranes fouling potential and capacity for natural organic matter removal. FIG. 18 presents the results for relative flux and sodium alginate rejection obtained in the tests.
[0224]Results depicted in FIG. 18, show that control membrane presented the lowest fouling potential for sodium alginate, with a relative flux of 0.85, and the membrane with 1% of clay nanoparticles and 1% of SHMP presented the highest fouling potential, with a relative flux of 0.70, and the membrane with 2% of clay presented an intermediate fouling potential, relative flux of 0.75. These results are somewhat in accordance with the expected behavior for the membranes, based on the values of contact angle presented in FIG. 13, because contact angle for control membrane was smaller the ones for membranes with clay additions. However, there was an inversion on fouling potential for the membranes with clay nanoparticles additions, since difference between relative fluxes for both membranes is statistically significative at a 95% confidence level (p-value of 5.71×10⁻⁶). This difference might be associated to the differences in membranes internal pore structures, because the membrane with 1% clay nanoparticle and 1% of SHMP presents a higher frequency of enclosed pores close to the membrane surface. This hypothesis can be supported by the results obtained for sodium alginate rejection, which was slight higher for the membrane with 1% of clay nanoparticles addition, as can be seen in FIG. 18. Slightly higher fouling potential for the membranes with clay nanoparticles is offset by higher permeate flux compared to the control membrane, 1.8 and 2.2 times for the membrane with 1% of clay nanoparticles and 1% of SHMP, and the membrane with 2% of clay nanoparticles, respectively. Specifically about sodium alginate removal, three tested membranes were very efficient, with removals close to 97% (FIG. 18).
[0225]Comparison of the results of this study with similar ones: The number of studies about the use of clay nanoparticles as an additive for polymeric membrane casting, specifically for water treatment, is limited, and few works had been published so far. This fact makes appropriated a comparison among the works available in order to obtain a better understanding about the influence of this material on morphology and performance of casted membrane, and also to identify possible aspects where additional research will be necessary. As it was presented in the introduction section, available works in which clay was used for casting were developed by OriettaMonticelli et al. (Journal of Applied Polymer Science 103 (2007) 3637-3644), PriscilaAnadão et al. (Applied Clay Science 48 (2010) 127-132), and NeginGhaemi et al. (Journal of Membrane Science 382 (2011) 135-147). Table 5 presents main conditions used for membrane casting and the characteristics of obtained membranes, in the available studies and in this study.
[0226]The data set presented in Table 5 clearly shows that the use of clay as an additive in dope casting solution has some effect on membrane performance. However, it is not possible to drawn a general conclusion about the mechanisms that had led to these changes, because of large variation in conditions used among previous studies, and because in none of them fouling evaluation tests were carried out. For example, concentrations of clay nanoparticles used in all previous studies were much higher compared with this one, as membrane thicknesses were. In the work developed by Kim and Van der Bruggen (The use of nanoparticles in polymeric and ceramic membrane structures: Review of manufacturing procedures and performance improvement for water treatment, Environmental Pollution, 158 (2010) 2335-2349), it is reported a large variation on the concentration of different nanoparticles additives used in reviewed studies, but in many of them nanoparticles concentration are in the same range used in this study.
[0227]About the possible influence of clay dosage or membrane thickness on its performance, it is worth to comment the results obtained by Ghaemi et al. (Journal of Membrane Science 382 (2011) 135-147), related to the membrane separation capacity. Even though no specific test to determine membrane MWCO was performed, some tests about the removal of two selected nitrophenol compounds, with a molecular weight of 184 and 228 g.mol−1, were carried out. According to this study removal of such compounds were close to 60% for the membrane with no clay addition, reaching values above 90% for clay concentration of 4%, for an average membrane pore size, as reported, close to 10 nm, what would result in a membrane with a MWCO of 60 kg.mol−1 (Mark C. Porter, Ultrafiltration, Chapter 3—Handbook of industrial membrane technology. Edited by Mark C. Porter, Noyes Publications, 1990). So observed nitrophenol compounds concentrations reduction might be related to some adsorption mechanism into the membrane structure, probably associated with membrane thickness and clay dosage.
[0228]Another example of the possible influence of membrane thickness on membrane performance is related to pure water flux. Comparing only the results for control membranes obtained by OriettaMonticelli et al. (Applied Clay Science 48 (2010) 127-132), and by Ghaemi et al. (Journal of Membrane Science 382 (2011) 135-147), it is possible to verify that they are of the same order of magnitude, but they differ significantly from the results obtained in this study, of course polymer type and concentration can also affect membrane permeability. In a work developed by C. Barth et al. (Asymmetric polysulfone and polyethersulfone membranes: effects of thermodynamic conditions during formation on their performance, Journal of Membrane Science 169 (2000) 287-299), the influence of polymer type (PSf and PES) and concentration, and membrane thickness on permeate flow has been evaluated. Considering the same type of polymer, water permeate flux was reduced as polymer concentration or membrane thickness were increased, and that permeate flow for membranes casted with PSf was always lower than the one obtained for PES membranes, for the same polymer concentration and membrane thickness.
TABLE 5 Membrane casting conditions used in the available studies about the use of clay or clay nanoparticles as additive, and main characteristics of obtained membranes. Casting conditions and membranes OriettaMonticelli PriscilaAnadão Ghaemi characteristics et al. [22] et al. [23] et al. [24] This study Polymer PSf PSf PES PES Polymer 25 25 20 18 Concentration (% weight) Solvent NMP NMP DMF(1) NMP Clay type Neat and organically Neat MMT MMT organically Neat MMT modified MMT(2) (Wyoming) modified (Nanoclay) Clay dosage 2, 3, and 5 (based on 0.5 and 3 (based on 0.5 to 10 at 1% 1, 2, 2.5, 3, and 5 (% weight) olymer/solvent final solution weight) steps above 2% (based on PES mass) solution weight) (based on final solution weight) Pore former none none PVP(3) 25 kg · mol−1 none Pore former — — 2 (based on final — dosage (% weight) solution weight) Casting knife (μm) 350 Not specified 250 100 Coagulation bath Water Water Water (90%) and Water 2-propanol (10%) Coagulation bath 20 25 Room temperature Room temperature temperature (° C.) Post treatment Running water Dried at 80° C. in a Water for 24 h Water bath for overnight vacuum oven 24 h at 30° C. Membrane pore Finger-like Sponge-like Finger-like Finger-like structure Contact angle Control = 80 Control = 74.5 Control = 57 Control = 59.5 (Degrees) 1% Clay = 79 0.5% Clay = 72.2 2% Clay = 51 1% Clay SHMP = 64.3 2% Clay = 80 3% Clay = 71.5 4% Clay = 40 2.5% Clay SHMP = 67.2 3% Clay = 78 10% Clay = 34 5% Clay SHMP = 68.7 5% Clay = 80 1% Clay = 66.7 2% Clay-93A = 79 2% Clay = 67.2 2% Clay-30B = 70 3% Clay = 68.4 3% Clay-30B = 61 5% Clay = 69.8 5% Clay-30B = 64 Mean surface pore size Not reported Not reported Control = 11.7 Control = 6.6 (nm) 4% Clay = 9.59 1% Clay + SHMP = 5.2 10% Clay = 9.19(4) 2% Clay = 7.4 5% Clay + SHMP = 5.3 5% Clay = 5.7(5) Mean surface pore size Not reported Not reported Control = 11.7 Control = 6.6 (nm) 4% Clay = 9.59 1% Clay + SHMP = 5.2 10% Clay = 9.19(4) 2% Clay = 7.4 5% Clay + SHMP = 5.3 5% Clay = 5.7(5) Membrane MWCO 2% of neat clay = 40 Not reported Not reported Control = 55 (kg · mol−1) (Dextran) (6) 1% Clay + SHMP = 55 2% Clay = 95 (PEG) Pure water flux Control = 0.29 Not evaluated Control = 1.13 Control = 176.4 (L · h−1 · m−2 · bar) 2% of neat clay = 0.54 4% Clay = 4.67 1% Clay + SHMP = 312.5 5% of neat clay = 0.25 10% Clay = 2.22 (7) 2.5% Clay + SHMP = 222.7 2% of MMT-93A = 7.42 5% Clay + SHMP = 63.3 2% of MMT-30B = 96.01 1% Clay = 185.0 5% of MMT-30B = 113.36 (7) 2% Clay = 389.3 3% Clay = 227.1 5% Clay = 102.1 (1)DMF—N,N-Dimethylformamide; (2)MMT—Montmorillonite Clay; (3)PVP—Polyvinylpirrolidone; (4)Obtained through Atomic Force Microscopy; (5)Obtained through SEM image analysis using ImageJ software; (6) For all other casted membrane retentivity of Dextran (40 kg · mol−1) was below 90%; (7) These values were obtained based on the results for permeate flow and operation pressure used in the experiments.
[0229]It is also possible to verify, based on the data presented in table 2 that changes in contact angle are quite diverse. In the work developed by OriettaMonticelli et al. (Journal of Applied Polymer Science 103 (2007) 3637-3644), there was no significative changes in the contact angle for membranes casted with unmodified and 93-A clays, compared to the control membranes, but contact angle had been reduced for membranes casted with 30-B clay. Observed results for unmodified clay are close to ones obtained by PriscilaAnadão et al. (Applied Clay Science 48 (2010) 127-132), because changes in contact angle were not so significative. Since in both work PSf has been used and clay concentration are in the same range, it can be concluded that neat clay has little effect on membrane contact angle. Considering the work developed by Ghaemi et al. (Journal of Membrane Science 382 (2011) 135-147), it can be seem a significative change in the contact angle when modified clay has been used, but it should be noticed that a hydrophilic agent has been used as pore former, and that base polymer was also different. These results are somewhat in agreement with the ones in the work of OriettaMonticelli et al. (Journal of Applied Polymer Science 103 (2007) 3637-3644), for modified clay-30B. However it should be pointed out that there is a significative difference in the contact angle changing trend of both works, while in the work of Ghaemi et al. (Journal of Membrane Science 382 (2011) 135-147) there is a continuous reduction in the contact angle whit the increasing of clay concentration, in the OriettaMonticelli et al. (Journal of Applied Polymer Science 103 (2007) 3637-3644) membranes contact angles decreased to a minimum and then increased. It is not possible, based on available data, to infer if contact angle would increase or stabilize for higher concentrations of modified clay. Comparing all these results for contact angle measurement the ones obtained in this work it can be seem a quite different behavior, because membranes contact angle had been increased as clay nanoparticles concentration was increased, reaching a plateau close to 70 degrees. The trend in contact angle variation with clay nanoparticles obtained in this study is contrary the one observed in the work of Ghaemi et al. (Journal of Membrane Science 382 (2011) 135-147). As shown in Table 5, differences in contact angles values and trends presented are significative.
[0230]In this study the influence of clay nanoparticles, with and without the use of SHMP, on the morphology and performance of PES membranes has been evaluated. Phase inversion process was used for membrane casting and no different additive was used in dope casting solution or in coagulation bath. Dope casting solutions of 18% weight PES and 82% weight of NMP were prepared as base solution for clay nanoparticles dispersion. Through dead-end and cross-flow filtration tests, SEM images, contact angle and thickness measurements, and porosity determinations, it was possible to conclude: [0231] (i) Clay nanoparticles in concentration ranging from 1% to 5% weight (based on the PES mass), with or without 1% weight of SHMP as a dispersant agent, can significantly change membranes structure and performance; [0232] (ii) Based on the results of dead-end filtration tests,membrane with 1% clay nanoparticles and 1% SHMP and membrane with 2% clay nanoparticles presented the highest flux for ultrapure water, 312.5 L.h−1.m−2.bar−1 and 389.3 L.h−1.m−2.bar−1, respectively, compared to a membrane with no clay nanoparticles addition, 176.4 L.h−1.m−2.bar−1; [0233] (iii) Increasing in clay nanoparticles concentrations resulted in an increase in the contact angle, making the membranes more hydrophobic; [0234] (iv) No significative changes in membranes porosity and thickness were observed; [0235] (v) Cross-sectional SEM images revealed significative changes in membranes internal pore structure, which are directly associated with membrane permeability; [0236] (vi) As the concentration of clay nanoparticles increases up to the best dosages, membrane internal finger-like pore structure was straightened and the frequency of enclosed pores was reduced, at higher clay nanoparticle concentrations this structure was changed, increasing pore tortuosity an frequency of enclosed pores; [0237] (vii) Membranes with clay nanoparticles additions presented a slight broader pore size distribution curve, and all membranes with clay nanoparticles, but the one with 2% addition, had presented a reduction on the median pore size; [0238] (viii) Membranes MWCO were determined using PEG solutions with different molecular weight in the cross-flow filtration setup. MWCO of control membrane and membrane with 1% clay nanoparticles and 1% of SHMP were 55 kg.mol−1, and MWCO of membrane with 2% of clay nanoparticles was 95 55 kg.mol−1; [0239] (ix) Results of tests with SAS showed that membranes with clay nanoparticles additions, with or without SHMP, were more prone to fouling than control membrane, what was expected, based on the results of contact angle; [0240] (x) Sodium alginate rejection for all membranes was close to 97%; and [0241] (xi) Changes observed in membrane permeate flux according to clay dosage in this study were also reported by other researchers in previous studies, however, it was not possible to draw any conclusion about the mechanisms associated to the observed changes, and none of the previous studies had attempted to correlate changes in membranes morphology with its performance.
Example
Example 3
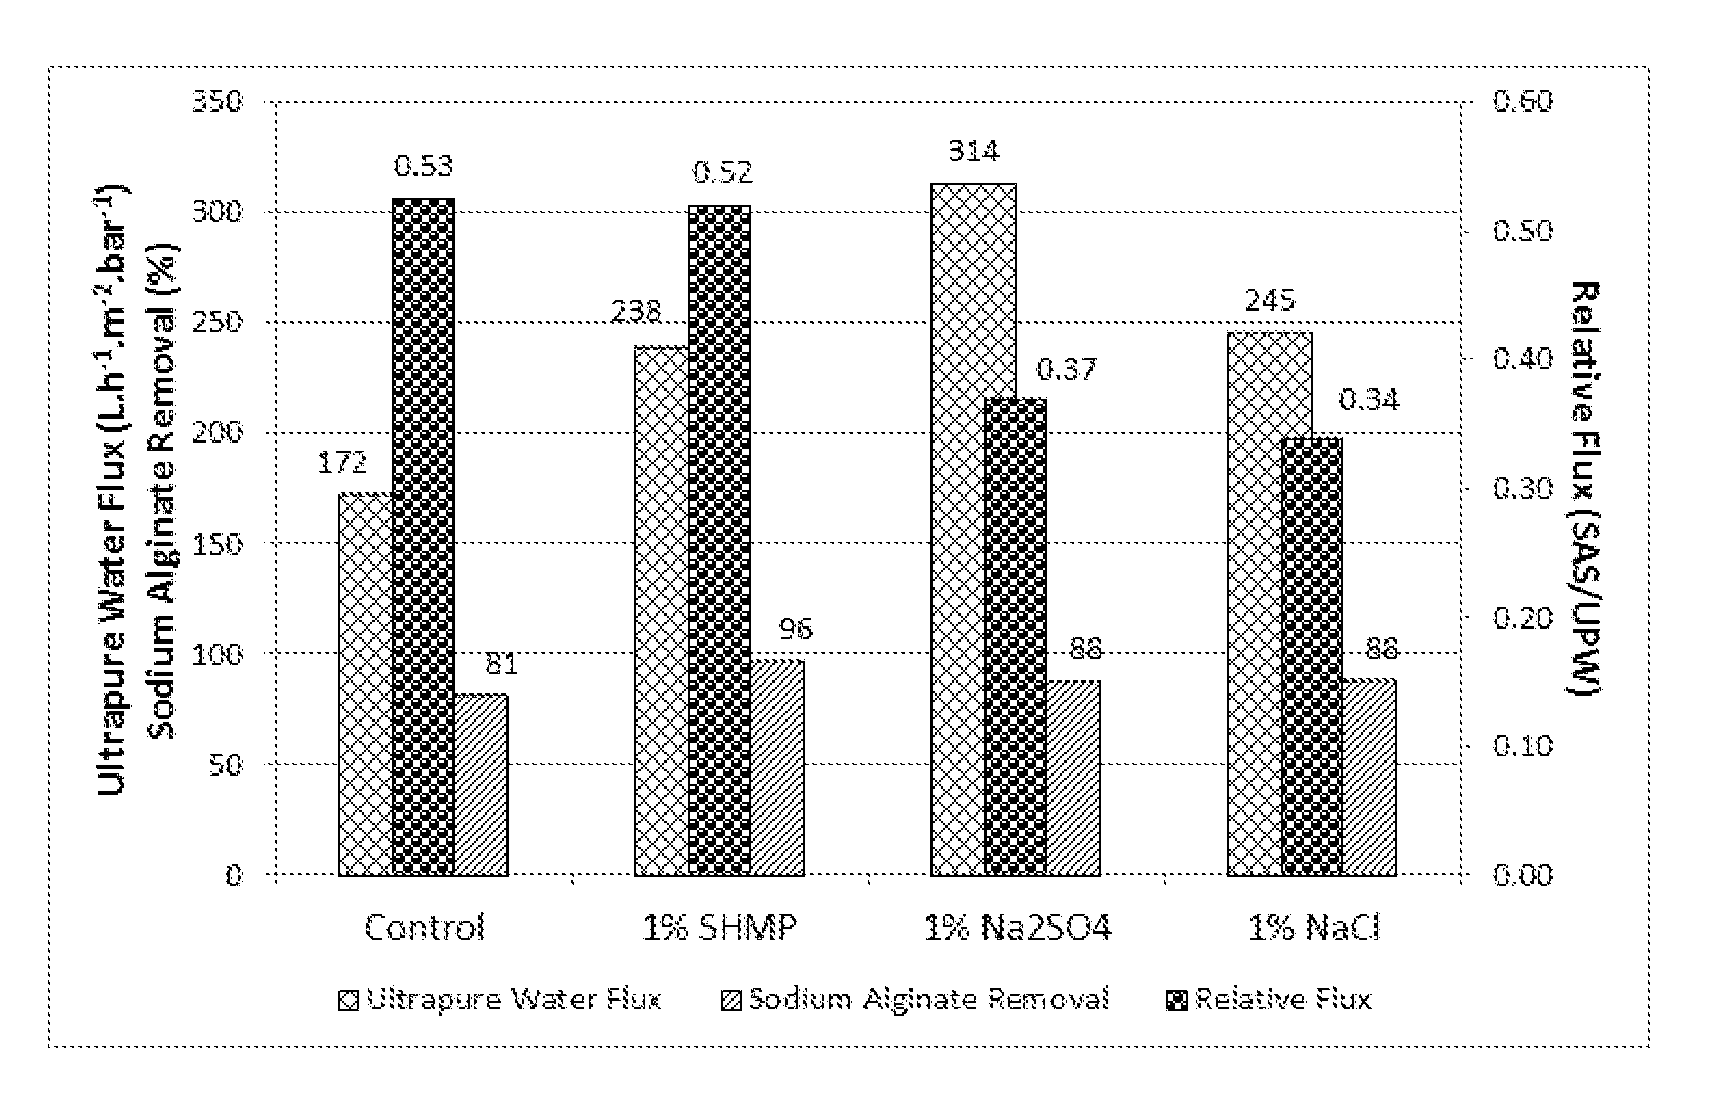
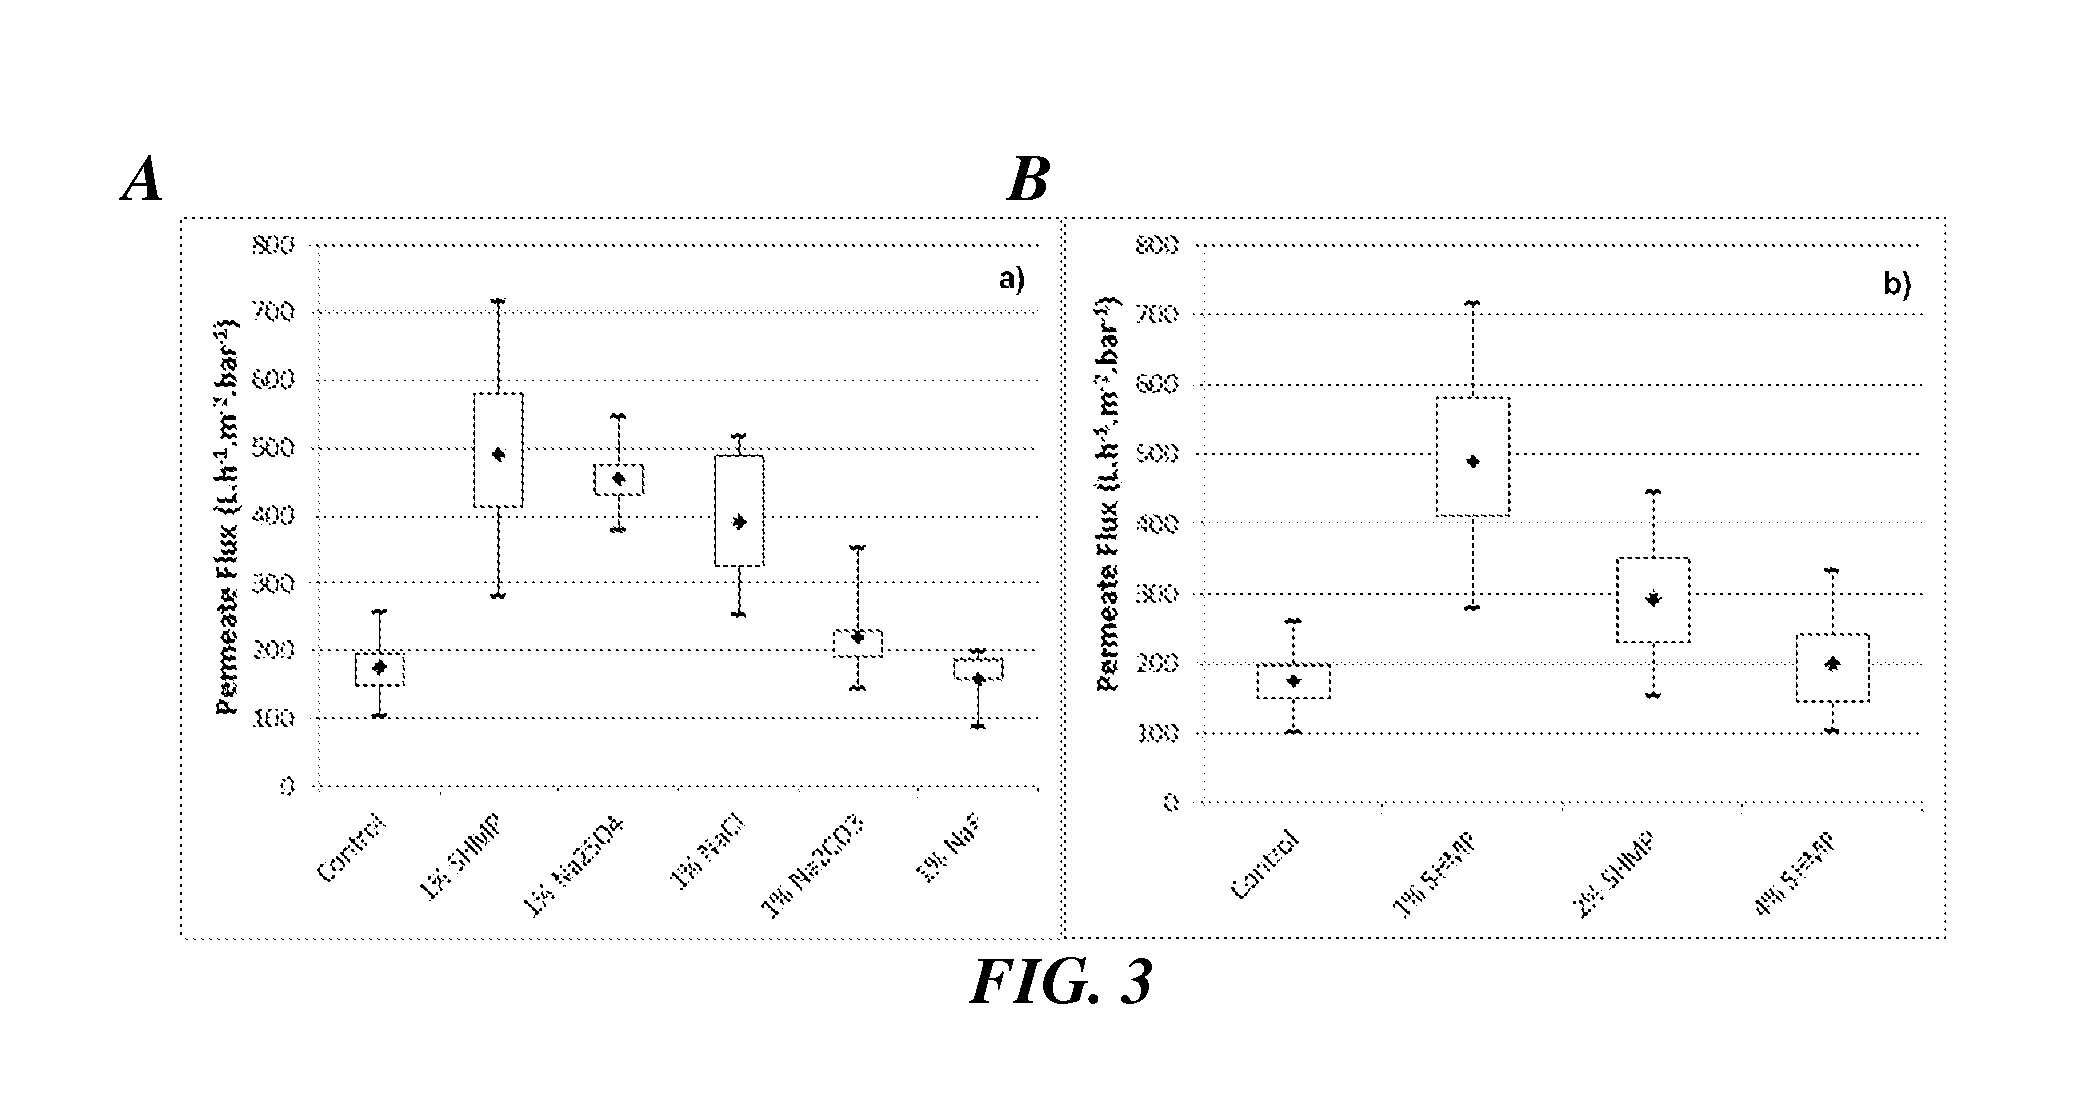
Specific Phosphate Salt Effects on Structure & Performance of Polyethersulfone Ultrafiltration Membranes
[0242]Membrane filtration is a widely used separation technology for aqueous mixtures. The application of membrane in water treatment has dramatically increased in the past decade due to the improved membrane quality and reduced cost. Ultra-filtration (UF) membranes have pores of 1 to 100 nm, and they are efficient in removing large organic molecules and bacteria. Therefore, UF serves as an important technique for drinking water purification as well as pretreatment of reverse osmosis.
[0243]Inorganic salts are widely used as additives to alter the polymeric membrane morphology and filtration performance when asymmetric UF membranes are prepared by phase inversion process. Lithium halides are the most commonly used salts. There are generally two pathways to consider the effects of the added salts: (i) the salts will interact with the solvent or the polymer molecules and change the casting solution properties; (ii) the salts will serve as hydration media during phase inversion and affect the resulting morphology.
[0244]HMP (sodium hexametaphosphate, (NaPO3)6) is a well-known additive for polymers. Previous paper published by our group suggested that HMP can increase the flux of PES (polyethersulfone) membranes by 2 folds when it is added as a dopant to the casting solution in NMP (1-Methyl-2-pyrrolidinone). However the underlying mechanism is still unknown. According to literature report, sodium ions hardly involve in the interactions with NMP. Therefore, studying the effect of the phosphate salts may help reveal the interaction mechanism.
[0245]In this study, we use different sodium phosphate salts and study in series about the addition of salts, the solution properties, the resulting PES membrane morphology and permeation properties.
Material and Methods
[0246]Materials: PES with an average molecular weight of 63,000 g mol−1 and a number molecular weight of 19,000 g mol−1 was from Solvay Advanced Polymer. NMP (>99%) was acquired from Alfa Aesar. HMP, TMP (sodium trimetaphosphate, (NaPO3)3), TP (sodium triphosphate, Na5P3O10), Na3P (sodium phosphate, Na3PO4) and Na2HP (sodium phosphate dibasic, Na2HPO4) were purchased from Sigma-Aldrich. All chemicals were used as received. All the experiments were conducted with ultrapure water with the resistivity of 18 MΩ.
[0247]Membrane preparation: Control membrane casting solution was prepared using 18% weight concentration of PES dissolved in NMP. After mixing for 24 hours using an overhead mixer, the solution was placed in an ultrasonic bath for 30 min to remove dissolved gas and bubbles. Finally, the solution was left overnight in the dark until the membrane production.
[0248]To remain consistent with our previous study, the doped membranes with HMP were prepared by adding 1% w:w HMP:PES into the casting solution before mixing. The weight ratio of other phosphate salts was calculated to keep at the same molar concentration with HMP.
[0249]The phase inversion was conducted in ultrapure water coagulation bath at room temperature. Bar coater of thickness 100 nm was used to spread the solution into thin films on a glass plate with an automatic film applicator (Elcometer 4340 Automatic Film Applicator). The glass with film was immersed into ultrapure water bath as soon as possible and kept there for 20 min. In the end, membranes were collected and stored in ultrapure water at room temperature to remove residual solvent.
[0250]Flux tests: The prepared membranes were tested using ultrapure water for cross-flow flux. The cross-flow flux was evaluated using the cross-flow filtration setup described in a previous paper. Operation pressure was controlled from 0.15 to 1.2 bar, so that the permeate flow rate fell into the range of 50 to 200 mL h−1, suitable for flow meter reading and calibration. Temperature, permeate flow and differential pressure were recorded each 5 min in the 30 min test. 7 samples from different membrane sheets were tested for each casting solution doped with a specific sodium phosphate salt.
[0251]Casting solution characterization: The casting solution used for membrane spreading was characterized for viscosity and turbidity. Cannon-Ubbelohde viscometer was used to test the viscosity of different solutions at 30° C. The turbidity test of PES solution of different weight percentages was carried out with the Hach 2100Q Portable Turbidimeter.
[0252]Membrane characterization: Dry membranes samples were prepared before any flux experiments, and then used for thickness, contact angle measurement and SEM (scanning electron microscope) characterization. To avoid pore structure change during the drying of the samples, the wet membranes were immersed in isopropyl alcohol for 24 h to remove water and then air dried. The thickness of membranes was measured using a digital micrometer. For each type of doped membranes, 9 measurements were carried out on 3 random pieces. Membrane water contact angle measurements were conducted using a goniometer (Ramé-Hart Instrument Co.) with the sessile drop technique, and 30 measurements were conducted on 3 membrane sheets for different membrane types. Both the surface and the cross-sections were imaged at Harvard University's Center for Nanoscale Systems using University's Center for Nanoscale Systems using the Field Emission Scanning Electron Microscope Ultra 55.
[0253]Hygroscopic property of the salts: The hygroscopic property of sodium phosphate salts were analyzed by weighing the salts weight change after 24 h drying in 60° C. oven and after short moisture absorption.
Results and Discussion
[0254]Cross-flow flux test: A general decline trend in the flux was observed on all the membranes in the first 30 min tests, and the average decrease was 16%. The flux values after 30 min stabilization were used as an evaluation of the membrane filtration performance. The flux decline and stable flux of the control membranes and doped membranes with HMP, TMP, TP, Na3P and Na2HP were plotted as follows.
[0255]From FIG. 19A, we can tell the effects of different sodium phosphate salts, even though there are large variations for the cross-flow flux of all the six types of membranes. HMP roughly doubled the pure water flux, consistent with the published results. TMP, TP and Na3P resulted in a slower permeation process, while Na2HP had similar effect to HMP. In FIG. 19B, the average fluxes of different membranes are compared with the flux change during the first 30 min membrane operation. Except for the control membranes, there is a negative correlation between the flux decrease and the stable flux for doped membranes. This is due to that higher operation pressure was required for the less permeable membranes in order to get satisfactory permeate flow rate, and thus these membranes tended to compress more in the first 30 min test.
[0256]Membrane morphology: The flux of membranes is closely related to the porous structure formed during the phase inversion process. Representative cross-section SEM images of different membranes synthesized are shown below.
[0257]The effect of variant phosphate salts on the membrane cross-section morphology can be summarized from FIG. 20. Visual examination of the thickness indicates no significant change after doping with phosphates. This is verified through thickness measurement, shown in FIG. 21. The addition of HMP, TMP, TP and Na3P helps form straighter channels and compress the macrovoids on the bottom of control membranes. Combining with the cross-flow test results, it indicates that the membranes with HMP and Na2HP have fewer barriers along the long channels, which reduce resistance against water flow in the pores, and thus the resulting membranes have higher flux.
[0258]In addition to the cross-section structure, top porosity of membranes is another important characterization parameter. By analysis of representative membrane surface SEM images, we found that all the membranes have surface pores ranging from 1 to 20 nm. The porous area is around 5% of the total surface area. More than 50% of the porous area is attributed to pores within the diameter of 5 to 12 nm. The addition of dopants didn't change the surface porosity or the pore size distribution significantly.
[0259]The contact angle of the membrane surface is also an important factor affecting the filtration performance, including the flux values and antifouling properties. In this study, the contact angle measurements show that the hydrophilic property of the membrane is not changed by phosphate doping. Most of the contact angles of the tested membranes are within 60 to 70°, and the slight variation in the mean contact angles provides no reference for the flux change (FIG. 22).
[0260]Properties of the casting solutions: So far, the filtration performance and the morphology of different phosphates doped membranes have been analyzed. However, the reason for these changes is still not clear and requires careful examination of the casting solution properties, which are the main variable of the phase inversion processes. Viscosity and turbidity of the casting solutions are measured as follows.
[0261]Viscosity is a widely studied property of the casting solution in membrane synthesis via phase inversion technique. Higher viscosity generally results in more porous structure. However, in this study, all the viscosities are between 1000 to 1250 cSt (FIG. 23). We can hardly tell any trend in viscosity change with the salts added or any correlation between the viscosity and average membrane flux.
[0262]From FIG. 24, rough linear correlation can be found on the turbidity and the PES concentration no matter HMP is added to the solution or not, indicating no qualitative change in the casting solution with the increasing polymer concentration. The HMP dopant increased the turbidity slightly. This phenomenon can be explained by the fact that HMP is quite insoluble in NMP solution and large amounts of particles exist in the solutions. During stir mixing, some particles might break down to small pieces, which fall into the range of few hundred nm, increasing the turbidity of the resulting solution. In fact, all the phosphate salts used in this project didn't dissolve well in the NMP solvent. No measurable evidence could be found showing the really small amount of dissolved salts. This also partly explained why the phosphate dopants hardly changed the casting solution viscosity, membrane contact angles or thickness.
[0263]It becomes quite intriguing now how the small amount of dissolved phosphate salts or the not dissolved particles changed the membrane morphology and flux without affecting other properties of the casting solutions or the membranes. One hypothesis is that both the dissolved salts and the small particles dispersed in casting solution are affecting the phase inversion by attracting water molecules locally. As shown in Table 6, all the phosphate salts here have obvious hygroscopic properties. HMP, Na3P and Na2HP have high water absorption capacity while TP and Na3P are quite fast in water absorption. The salts in the casting solution have different dispersion conditions, and this is even further complicated by the varied water absorption speeds and capacities. As a result, some of the phosphate salts finally facilitate the long connected channel formation and increase the membrane flux. It takes future efforts to verify this hypothesis and finally make the mechanism of different sodium phosphates doping clear.
TABLE 6 Hygroscopic properties of sodium phosphate salts Weight decrease percentage Weight increase percentage Salts after 24 h in the oven (%) after 1 min from the oven (%) HMP 3.50 0.06 TMP 0.10 0.05 TP 0.77 0.09 Na3P 18.20 0.09 Na2HP 5.21 0.07
Conclusions
[0264]Different sodium phosphate salts were added to PES-NMP casting solutions and the doped membranes were synthesized through phase inversion process respectively. Because most of the salts didn't dissolve in the organic solution, there was no special solution property change after the doping, including solution turbidity and viscosity. The doped membranes had quite different permeate fluxes compared to the control membrane; HMP and Na2HP roughly doubled the fluxes while TMP, TP and Na3P doping decreased the fluxes. Membrane characterization proved that the flux change was mainly due to the inner structure instead of surface or thickness change. The different hygroscopic properties of the salts and the existence of undissolved particles make the mechanism study quite complicated. Efforts were made to relate dopant effects on casting solution properties to effects on membrane structure; however, to date no correlations have been observed
[0265]All patents and other publications identified in the specification and examples are expressly incorporated herein by reference for all purposes. These publications are provided solely for their disclosure prior to the filing date of the present application. Nothing in this regard should be construed as an admission that the inventors are not entitled to antedate such disclosure by virtue of prior invention or for any other reason. All statements as to the date or representation as to the contents of these documents is based on the information available to the applicants and does not constitute any admission as to the correctness of the dates or contents of these documents.
[0266]Although preferred embodiments have been depicted and described in detail herein, it will be apparent to those skilled in the relevant art that various modifications, additions, substitutions, and the like can be made without departing from the spirit of the invention and these are therefore considered to be within the scope of the invention as defined in the claims which follow.
Login to view more PUM


Description & Claims & Application Information
We can also present the details of the Description, Claims and Application information to help users get a comprehensive understanding of the technical details of the patent, such as background art, summary of invention, brief description of drawings, description of embodiments, and other original content. On the other hand, users can also determine the specific scope of protection of the technology through the list of claims; as well as understand the changes in the life cycle of the technology with the presentation of the patent timeline. Login to view more.
Login to view more Similar technology patents
Dispatchable renewable power supply
ActiveUS20210339646A1Reduction in susceptibilityReduce potentialBatteries circuit arrangementsCharging stationsAutomotive engineeringRenewable energy
Owner:AQUANOVIS HLDG
Dynamic electroacoustic transducer
Owner:SENNHEISER ELECTRONICS GMBH & CO KG
Electrocardiographic aspects of chf treatment
InactiveUS20050244298A1Reduction in susceptibilityOther blood circulation devicesEnergy modified materialsCardiac sudden deathSudden cardiac death
Owner:VASOGEN IRELAND LTD
Silo guard
ActiveUS20210362943A1Reduction in susceptibilityExtend life of filterAgriculture tools and machinesLarge containersAgricultural engineeringAgricultural science
Owner:ADAMS SILO SAFE & WELDING PTY LTD
Cables with intertwined strain relief and bifurcation structures
InactiveUS8893603B2Reduce tensionReduction in susceptibilityEarpiece/earphone cablesYarnLoudspeakerStrain relief
Owner:APPLE INC
Classification and recommendation of technical efficacy words
- Reduction in susceptibility
- Stabilize performance
Apparatus for improved pulse oximetry measurement
ActiveUS20060129039A1Increase light level receptionReduction in susceptibilityCatheterDiagnostic recording/measuringReflectivityLight source
Owner:ENVITEC WISMAR
Method and system for providing a magnetic element including passivation structures
InactiveUS20050048674A1Improve performanceReduction in susceptibilityNanoinformaticsMagnetic-field-controlled resistorsMagnetic layerMagnetic components
Owner:APPLIED SPINE TECH +1
Integrated electronic disconnecting circuits, methods, and systems
ActiveUS20050152080A1Good process integration capabilityReduction in susceptibilityTransistorEmergency protective arrangements for limiting excess voltage/currentJFETHigh potential
Owner:BOURNS INC
Non-nucleoside reverse transcriptase inhibitors
InactiveUS20070088053A1Reduction in susceptibilityInhibitor usedBiocideOrganic chemistryCompound (substance)Human immunodeficiency virus (HIV)
Owner:ROCHE PALO ALTO LLC
Preventing and Curing Beneficial Insect Diseases Via Plant Transcribed Molecules
InactiveUS20120157512A1Reduction in susceptibilityAntibacterial agentsOrganic active ingredientsTransgeneGMO Plants
Owner:MONSANTO TECH LLC
Pneumatic tire
ActiveUS20120285592A1Stabilize performanceTyre tread bands/patternsNon-skid devicesEngineeringGround contact
Owner:YOKOHAMA RUBBER CO LTD
Clamping device for rotary index device for machine tool
ActiveUS20100175505A1Simplify structureStabilize performanceMechanical apparatusPrecision positioning equipmentEngineeringMachine tool
Owner:TSUDAKOMA KOGYO KK
Air-cooling heat dissipation device and system
ActiveUS20180146573A1Increase heat dissipation efficiencyStabilize performanceDigital data processing detailsFlexible member pumpsAirflowEngineering
Owner:MICROJET TECH
Air-cooling heat dissipation device
ActiveUS20180240733A1Increase heat dissipation efficiencyStabilize performanceDigital data processing detailsSemiconductor/solid-state device detailsEngineeringAir cooling
Owner:MICROJET TECH
Capacitance type measuring device
InactiveUS20130162270A1High measurement accuracyStabilize performanceCapacitance measurementsFluid pressure measurement by electric/magnetic elementsPhysicsMeasurement device
Owner:HORIBA STEC CO LTD