Detection of target analytes at picomolar concentrations

a target analyte and concentration technology, applied in the field of detection of target analytes at picomolar concentrations, can solve the problems of long incubation time, complicated experimental operation procedures, and impede detection and monitoring of disease progression or recurrence,

Pending Publication Date: 2019-11-14
RGT UNIV OF CALIFORNIA
View PDF0 Cites 1 Cited by
  • Summary
  • Abstract
  • Description
  • Claims
  • Application Information

AI Technical Summary

Benefits of technology

The patent text describes the limitations of current methods for detecting molecular markers of disease using small samples of clinical materials. These methods require expensive and specialized instruments, and have a high limit of detection, making them unattractive for resource-limited countries. Additionally, they struggle to detect low concentrations of biomolecular species, which can be required for early diagnosis or disease monitoring. The patent proposes a solution that integrates microfluidic technology, electronics, and nanomaterials to overcome these limitations and provide real-time monitoring of molecular signatures of disease using small samples.

Problems solved by technology

Detection and monitoring of disease progression or recurrence is impeded by a dependence on specialized labs and highly skilled personnel to perform the requisite assays used in a clinical setting for the effective diagnosis and treatment of diseases.
However, these techniques require sophisticated experimental operating procedures, long incubation times, labeling of molecular species, and expensive and bulky instruments.
Despite all these, the limit of detection of the target molecules is unacceptably high.
As a result, the applicability and adaptability of medical diagnostic systems are restrained—most particularly in resource limited countries.
Sensitivity and specificity of detection can be compromised by background noise resulting from factors such as the intrinsic heterogeneity of proteins and other chemical species in complex clinical samples such as blood or urine.
Although ex situ sample processing can improve sensitivity and specificity, such processing involves time consuming filtering, centrifugation, and desalting and buffer exchange steps that slow down the turnaround time of diagnosis.
Such a system would require an impractically long incubation time (hours to days) to detect such molecular species.
Meanwhile, the broad dynamic range of detection diminishes the sensitivity and therefore the reliability of the assay.

Method used


Image

  • Detection of target analytes at picomolar concentrations
  • Detection of target analytes at picomolar concentrations
  • Detection of target analytes at picomolar concentrations

Examples


example 1

n of Nanofluidic Enrichment and Conventional Microfluidics

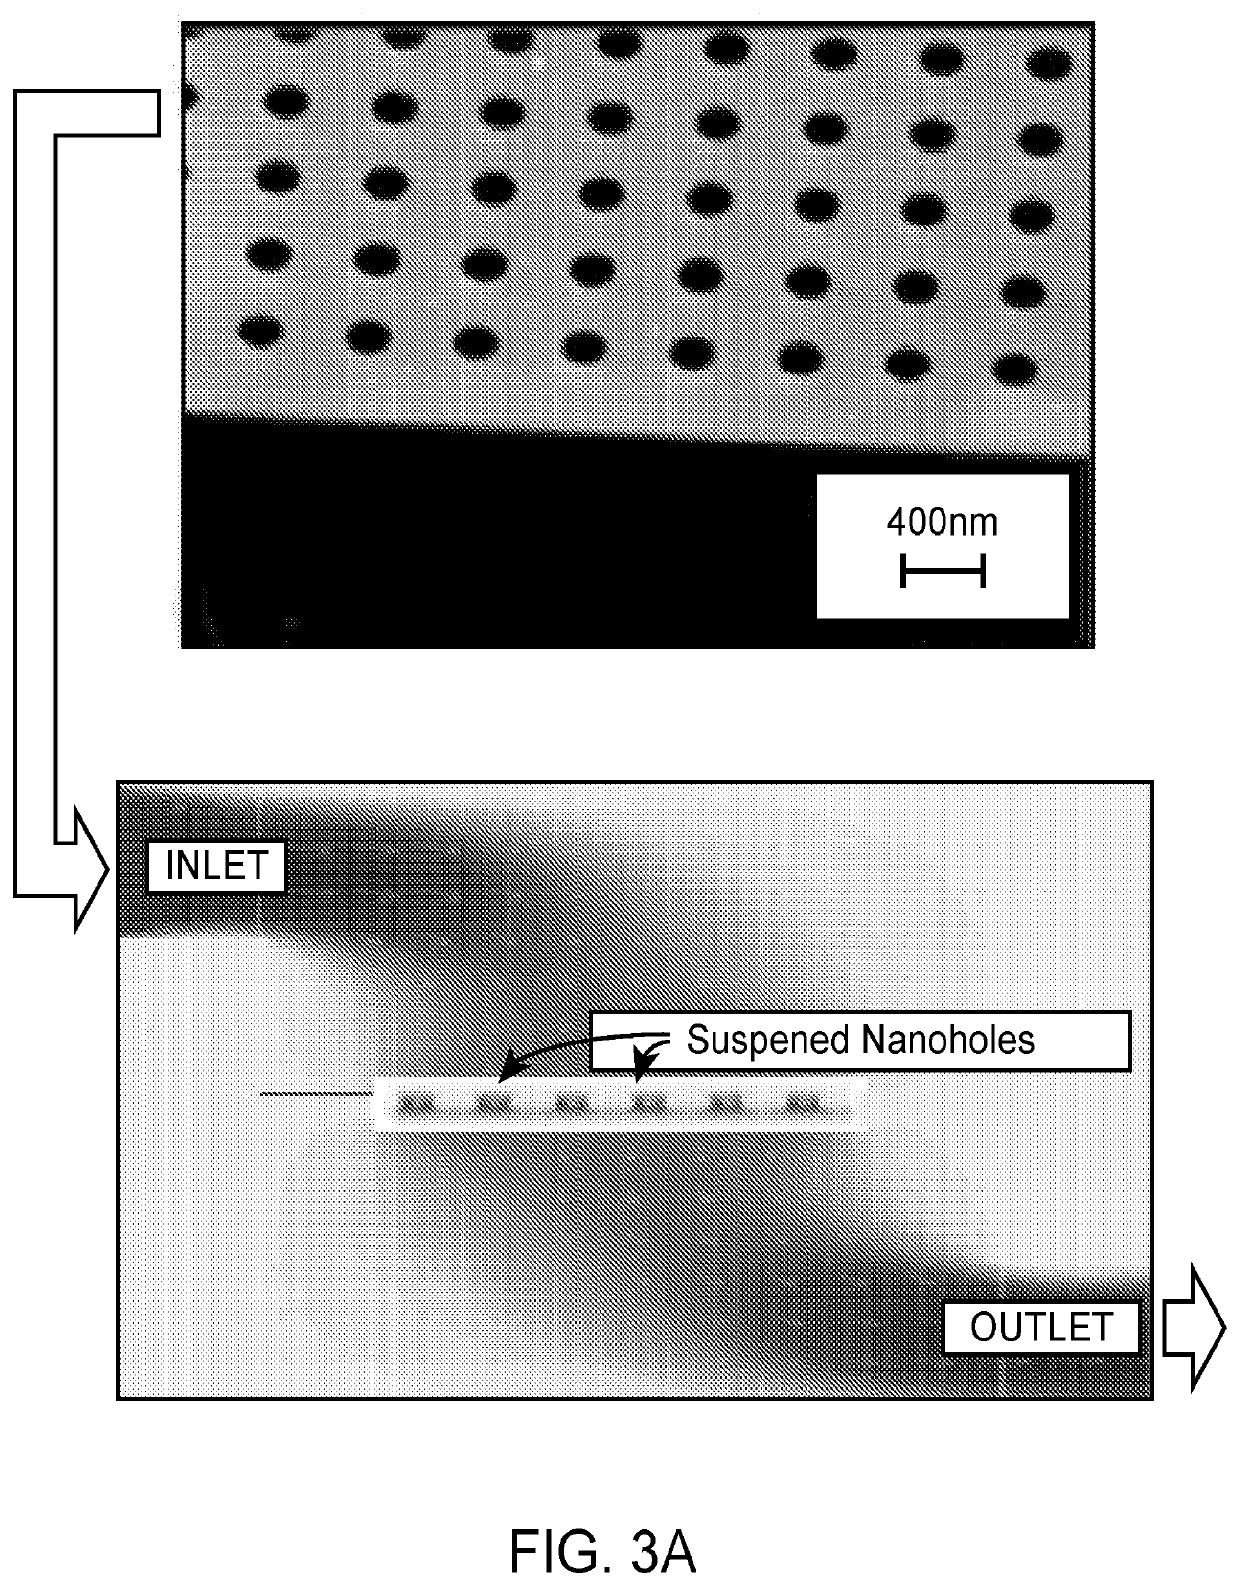
[0132]An elution solution comprising 200 nm dielectric beads at a concentration of 108 beads / ml was run through the nanohole array at a rate of 10 μl / min (FIG. 3B). Optimal accumulation of the dielectric beads was observed using a vertical flow scheme involving nanohole openings projecting through suspended membranes. When the same solution was allowed to run through the channel using a conventional flow scheme (flow over)—where the elution solution follows parallel to the surface—less accumulation of the nanoparticles was observed. These results indicate that it is easier to capture the beads at high efficiencies on channel walls using vertical flow.

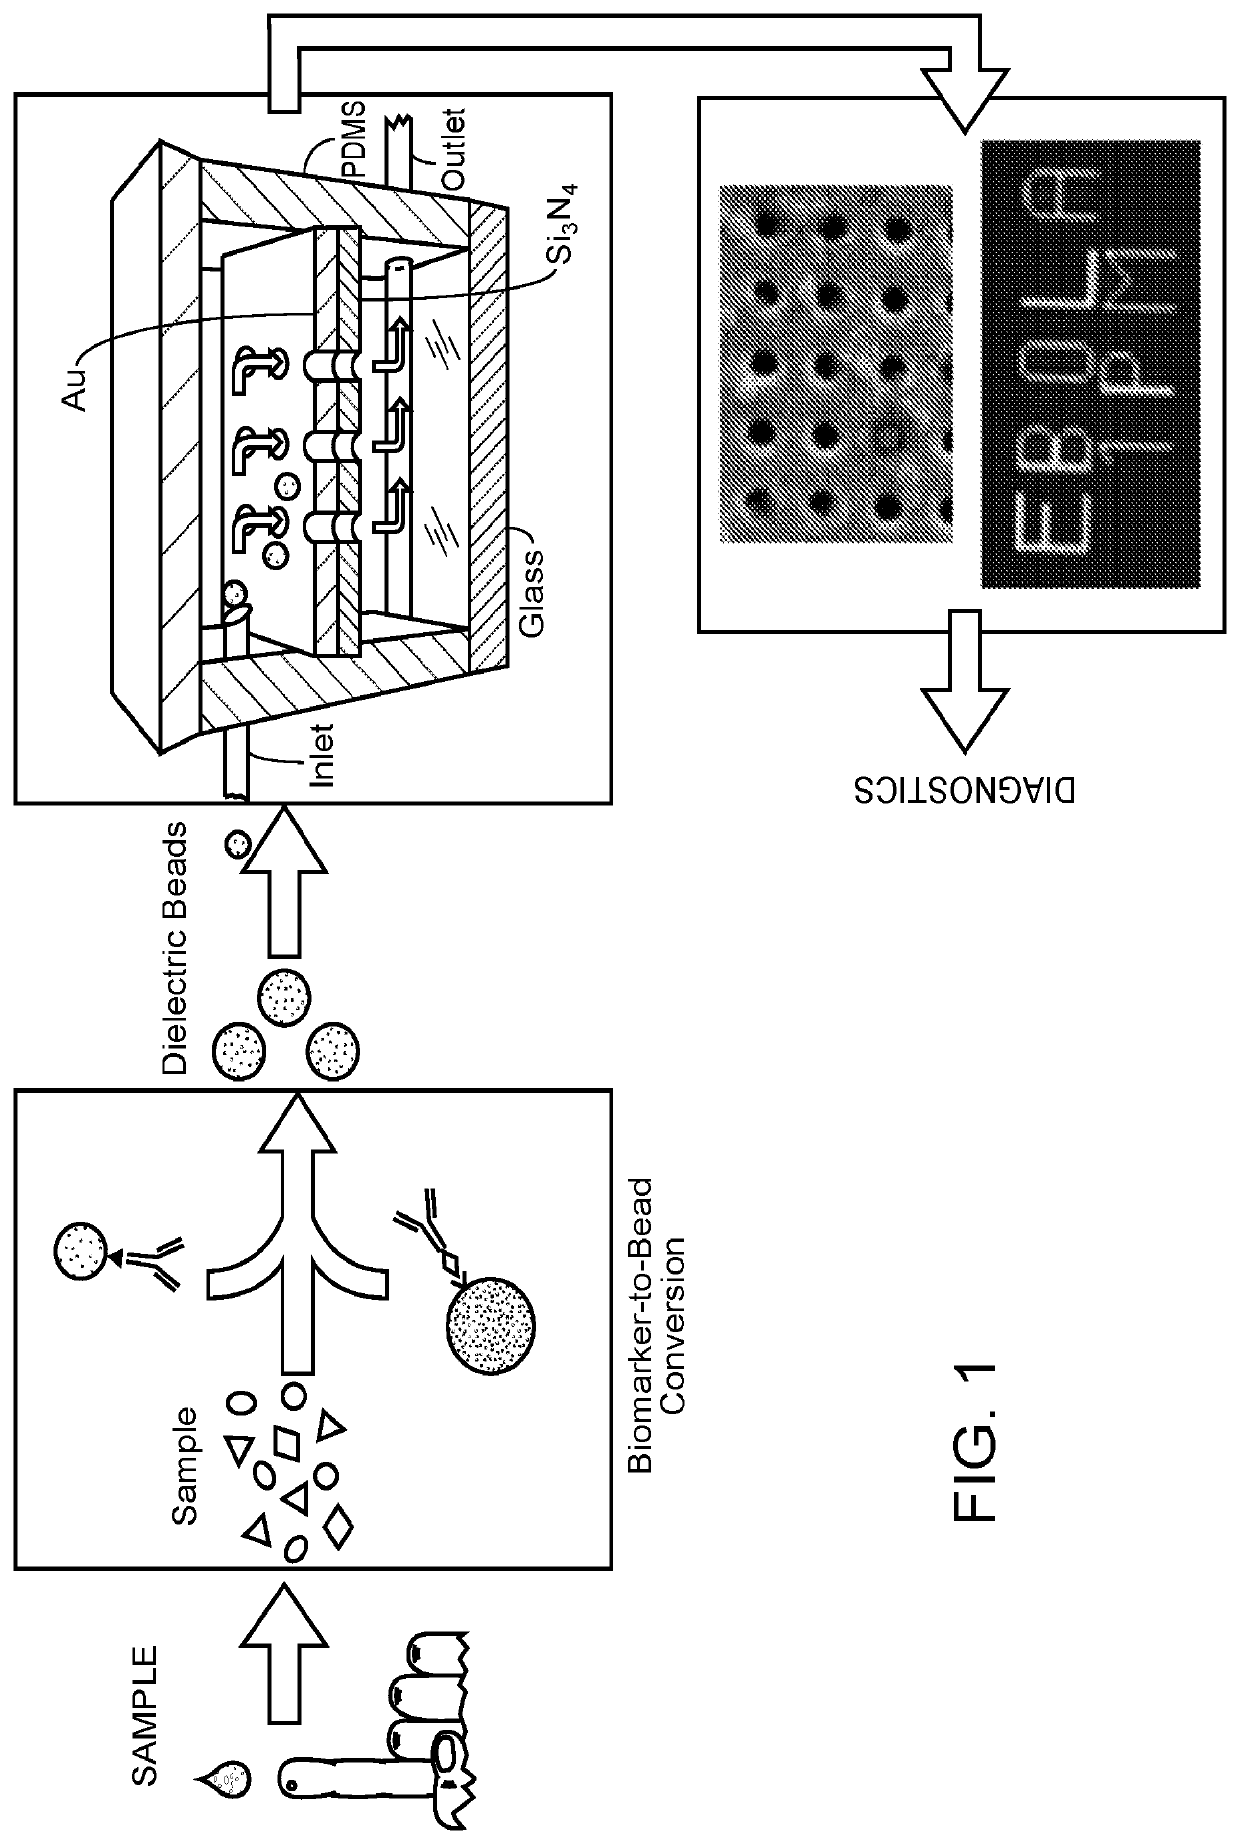
[0133]In another experiment, the biomarker (target analyte) detected was prostate specific antigen (PSA).” In addition, “biomarker-to-bead conversion” is interchangeable with “biomarker-to-bead transformation” or “B2B conversion” or “B2B transformation.”) FIGS. 9A-9C illustrates ...

example 2

tection of Biomarkers Due to Resonance Shift

[0138]A metal (Au) film of about 120 nm in thickness with a pitch length of about 500-700 nm was used. The film also included nanohole array (NHA) sensors—a periodic array of suspended sub-wavelength nanoapertures (holes with diameters of about 150-250 nm). Spectral responses upon accumulation of dielectric beads could be observed using three-dimensional (3-D) Finite Difference Time Domain (FDTD) electromagnetic simulations. The film was designed to be optically thick and the nanoapertures of such a diameter that they were too small to transmit light. Thus, incident light could then only be transmitted at specific resonant wavelengths via an optical process incorporating surface plasmon polaritons (SPPs). Biomolecules / pathogens binding to the metallic nanohole surfaces increased the effective refractive index of the medium around the nanoholes, which led to red shifting of the plasmonic resonances. Furthermore, measurement of the Fano reso...

example 3

-to-Bead (B2B) Conversion

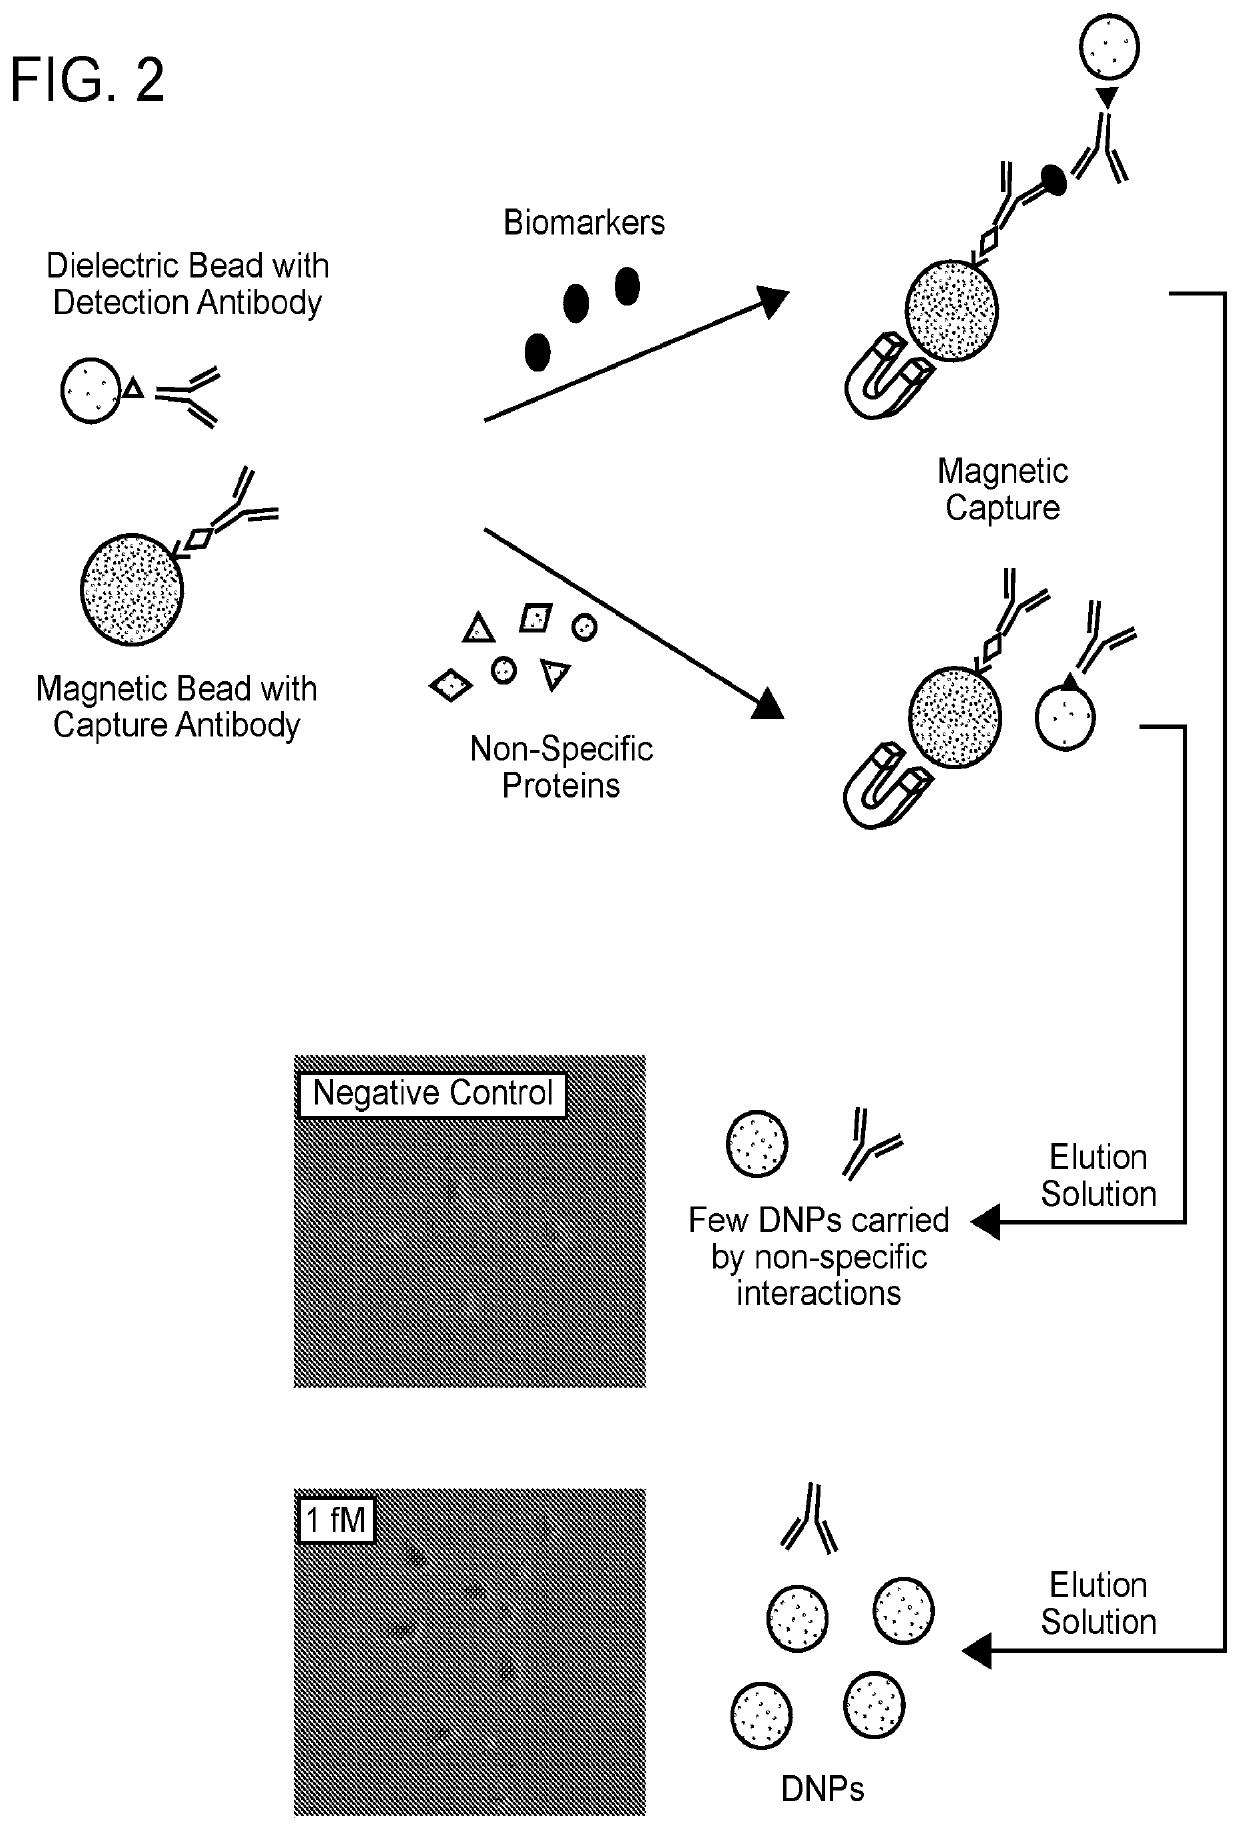
[0144]B2B conversions were performed as outlined in FIGS. 1 and 2.

[0145]Visual detection was demonstrated for target analyte concentration of 15 pM. A commercial ELISA kit (CMC4033, Thermo Fisher Scientific) was used for comparison. Initially, a mouse anti-IFN-γ antibody (6 μg / ml) was incubated with Superparamagnetic Dynabeads (2.8 μm diameter, 0.75 mg / ml concentration-Thermo Fisher Scientific) for surface conjugation. After a magnetic wash and resuspension, the antibody-conjugated magnetic bead solution was mixed with 10 μL stock solution containing mouse IFN-γ at 250 pg / ml. After 20 mins, a biotinylated anti-mouse IFN-γ secondary-antibody was added. Subsequently, NeutrAvidin coated silica beads (200 nm diameter) were added and incubated for an hour at room temperature using a Hulamixer (following the ELISA kit protocol optimized for titter plates). A magnetic separator was used to pellet the magnetic beads, the supernatant was removed, an elution buffer ad...


PUM

PropertyMeasurementUnit
diameteraaaaaaaaaa
diameteraaaaaaaaaa
diameteraaaaaaaaaa

Abstract

Methods for detecting submolar concentrations of a target analyte in a sample are disclosed. These methods combine a process of biomarker to bead conversion with bead enrichment and simple visual, optical, or electrochemical detection of the presence of enriched beads to provide sensitive and inexpensive assay for detecting analytes in a sample. Devices for performing these methods are also disclosed.

Description

CROSS-REFERENCE[0001]This application claims the benefit of U.S. Provisional Patent Application No. 62 / 400,307, filed Sep. 27, 2016, which application is incorporated herein by reference in its entirety.INTRODUCTION[0002]Detection and monitoring of disease progression or recurrence is impeded by a dependence on specialized labs and highly skilled personnel to perform the requisite assays used in a clinical setting for the effective diagnosis and treatment of diseases.[0003]Integration of microfluidic technology, electronics, and nano- and microscale materials can provide real-time monitoring of molecular signatures of disease using small volumes of clinical samples that include proteins, nucleic acids and other chemical species. Quantitative polymerase chain reaction (qPCR) and enzyme-linked immunosorbent assay (ELISA) have proven to be effective non-invasive screening methods for detecting and quantitating nucleic acids and protein targets of interest from clinical samples.[0004]Ho...

Claims


Application Information

Patent Timeline
Patent Type & Authority Applications(United States)
IPC IPC(8): G01N33/543B01L3/00B03C1/01B03C1/28B03C1/30G01N27/48G01N27/74
CPCB01L2200/0668B03C1/288G01N27/745G01N27/48B03C2201/26B01L2400/043G01N33/54333B03C1/01B03C1/30G01N33/5438B01L3/502761B01L2300/0896
Inventor YANIK, AHMET ALIZHU, XIANGCHAO
Owner RGT UNIV OF CALIFORNIA
Why Eureka
Try Eureka