Calibration standard for evanescence microscopy

a technology of evanescence microscopy and calibration standard, which is applied in the field of fluorescence microscopy, can solve the problems of large inaccuracy of light confinement statements at the reflecting interface, difficult measurement of exact thickness of this light sheet, and increased fluorescence intensities, so as to achieve high quantum yield, reduce photobleaching, and increase particle size

Active Publication Date: 2022-06-09
UNIVERSITÉ PARIS CITÉ +2
View PDF0 Cites 0 Cited by
  • Summary
  • Abstract
  • Description
  • Claims
  • Application Information

AI Technical Summary

Benefits of technology

[0079]Fluorescent nanocrystals are larger, solid state nano-particles generally characterized by low photobleaching and high quantum yields. For example, Quantum dots (QDs) are nanoscale semiconductor particles that generally exhibit a size-tunable, narrow emission spectrum (the emission peak shifts towards to the red with increasing particle size), a brighter emission than organic dyes, ...

Problems solved by technology

The technique of fluorescence microscopy has become an essential tool in biology and the biomedical sciences, as well as in materials science due to its specificity and background rejection that are not readily available with other contrast modes of traditional optical microscopy.
However, the exact thickness of this light sheet is difficult to measure and large deviations from the calculated exponential intensity decay of the evanescent wave have been reported.
This leads to large inaccuracies in statements of light confinement at the reflecting interface, and conseq...

Method used


Image

  • Calibration standard for evanescence microscopy
  • Calibration standard for evanescence microscopy
  • Calibration standard for evanescence microscopy

Examples


preparation examples

Calibration Standard Preparation Examples

[0144]The chemicals used in the Examples were purchased from SIGMA-ALDRICH.

[0145]The following substrate has been used:[0146]borosilicate (BK-7) substrate with refractive index, n3=1.514 at 488 nm.

[0147]The following polymers have been used:[0148]Poly(2,2,3,3,3-pentafluoropropyl methacrylate)—(PFA);[0149]Polydiallyldimethylammonium—(PDDA)[0150]Polystyrene sulfonate (PSS)[0151]Poly venyl alcohol (PVA)

[0152]The following fluorescent emitters have been used:[0153]J-aggregate of meso-tetra(4-sulfonatophenyl)porphine (TPPS4);[0154]Tetraphenylporphinetetrasulfonate (TPPS4−, or “Base TPPS”);[0155]CAS No 1461-15-0 (calcein)

[0156]Unless stated otherwise, all the materials were used as received from the manufacturers.

[0157]The calibration samples were characterized by:[0158]Ellipsometry, to measure layer thicknesses

Example 1: Preparation of a Single-Fluorescent Emitter Layer Calibration Sample 1 (Sample 1) According to the Invention

1.1 Material and Met...

example 1

of Typical Measurement with Type-1 Sample (Single Homogenous Dye Layer)

[0224]1. Material and methods

1.1 Control in epifluorescence (EPI)

1.1.1 mount sample on microscope;

1.1.2 chose laser wavelength or white light source with matching excitation filter overlapping with fluorophore excitation spectrum;

1.1.3 chose matching dichroic mirror and emission filter;

1.1.4 focus at interface layer;

1.1.5 take in-focus plane image of the calibration sample (see FIG. 7).

1.2 Variable-angle TIRF image acquisition

1.2.1 switch to evanescent-wave (TIRF) excitation;

1.2.2 refocus (note focus w / respect to EPI);

1.2.3. starting with theta=0° (which should be identical to EPI), take TIRF images at different polar beam angles (the setup must be calibrated so that the angle of the incoming beam with respect to the optical axis is known to 0.5° max);

1.2.4 acquire variable-angle TIRF image series;

1.2.5. repeat step (1.2.4) at 5-10 different locations on the sample;

1.2.6 chose regions of interest (ROIs) on sample...

example 2

rotocol for «Semi-Infinite» Dye Layer

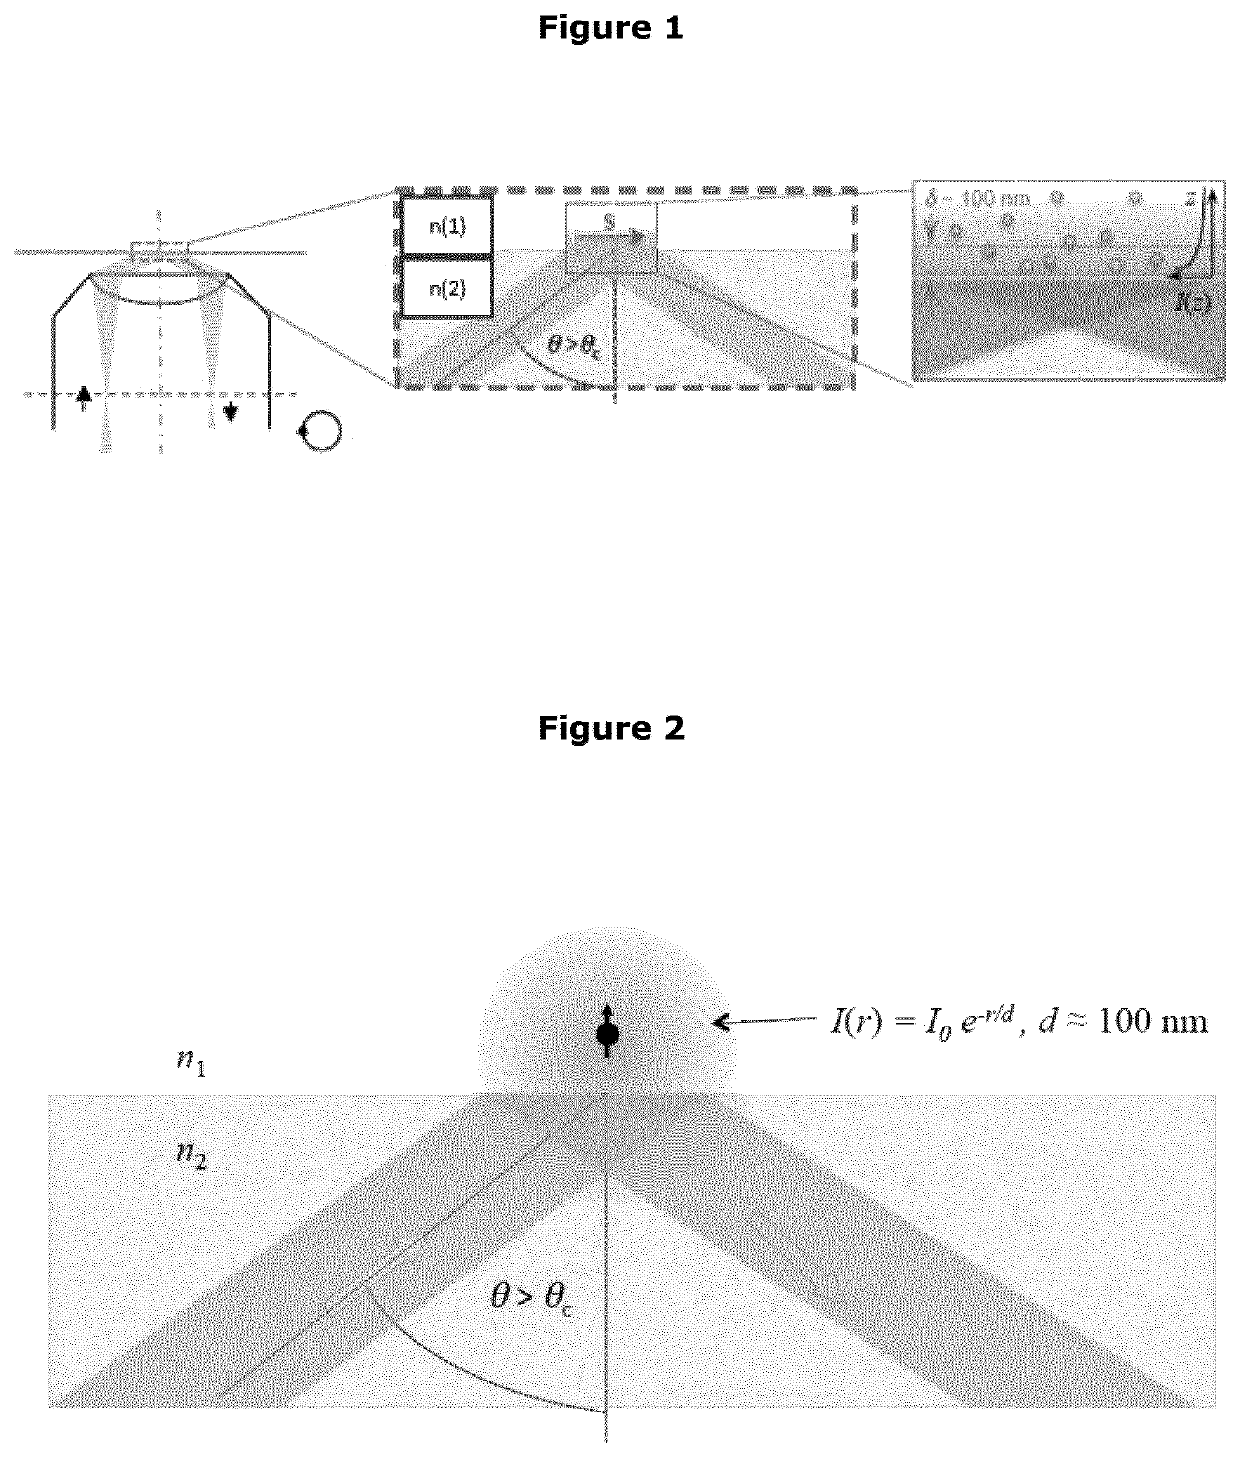
[0228]Simpler than the above 3-D samples, topping a coverslip with a dilute fluorophore solution and thus generating a layer of ‘infinite’ thickness (d>>δ) creates a homogenous sea of fluorescence that can be used in conjunction with VA-TIRF to estimate the effective penetration depth from the variation of the cumulative fluorescence. Assuming a mono-exponentially decaying EW with a decay length δ(θ) and a long-range component with D>>δ the superposition of two exponentials,

F(z)=A·e−z / δ(θ)+B·e−z / D  (Eq. 1)

describes the axial intensity decay. Here, we assumed that D is only slowly varying with θ, if at all. After integration over z in the bounds [0, ∞], eq.3 yields a linear dependence of the measured fluorescence on δ(θ),

Ftot=A×δ⁡(θ)·(1-e-zδ⁡(θ))+B·D·(1-e-zD)≈A·δ⁡(θ)+B,(Eq.⁢2)

[0229]because the second term is an angle-independent offset. If eq.4 is normalized for the θ-dependence of the incident intensity at the interface, I0(z=0), e.g., by recordi...


PUM


Abstract

A calibration standard for determining an intensity decay related to an evanescent field generated close to the interface between a sample to be tested and a substrate on which the sample is to be deposited, preparation and analysis methods and use thereof.

Description

TECHNICAL DOMAIN AND PRIOR ART[0001]The technique of fluorescence microscopy has become an essential tool in biology and the biomedical sciences, as well as in materials science due to its specificity and background rejection that are not readily available with other contrast modes of traditional optical microscopy. The application of an array of fluorochromes has made it possible to identify cells and sub-microscopic cellular components with a high degree of specificity amid non-fluorescing material. In fact, the fluorescence microscope is capable of revealing the presence of a single molecule. Through the use of multiple fluorescence labeling, different probes can simultaneously identify several target molecules and follow them at the same time.[0002]The principle of functioning of a fluorescence microscope is to irradiate the specimen with a desired and specific band of wavelengths, and then to separate the much weaker emitted fluorescence from the excitation light and potential ...

Claims


Application Information

Patent Timeline
IPC IPC(8): G01N21/64G02B21/16
CPCG01N21/6458G01N2021/6439G01N21/648G02B21/16G01N21/278G02B21/34G02B21/361G02B27/56G01N2201/12746
Inventor OHEIM, MARTINSALOMON, ADI
Owner UNIVERSITÉ PARIS CITÉ
Why Eureka
Try Eureka