Distinguishing test types through spectral analysis

a spectral analysis and test type technology, applied in the field of determining test types, can solve the problems of long-term complications, diabetics can have abnormally high blood sugar levels known as hyperglycemia, and impaired ability to regulate glucose levels in their blood

Inactive Publication Date: 2008-06-24
TRIVIDIA HEALTH
View PDF622 Cites 17 Cited by
  • Summary
  • Abstract
  • Description
  • Claims
  • Application Information

AI Technical Summary

Problems solved by technology

Diabetics suffer from an impaired ability to regulate glucose levels in their blood.
As a result, diabetics can have abnormally high blood sugar levels known as hyperglycemia.
Chronic hyperglycemia may lead to long-term complications such as cardiovascular disease and degeneration of the kidneys, retinas, blood vessels and the nervous system.
A problem with prior art devices has been that they have typically not been able to discriminate between the type of test element introduced into the meter, and therefore the type of test to run, without user intervention.
The requirement that a user perform an affirmative act to signal to the monitoring device the type of sample tested allows the possibility for human error that can adversely affect the proper storing and monitoring of measurement results, and possibly the misinterpretation of stored results.
For example, if a user were to fail to perform a required step indicating insertion of a test strip containing glucose control solution, such as failing to push a button or wait a specified time, the measurement results could be incorrectly stored in the memory of the device as an actu

Method used


Image

  • Distinguishing test types through spectral analysis
  • Distinguishing test types through spectral analysis
  • Distinguishing test types through spectral analysis

Examples


example 1

% R Method (Glucose Control Detection Using Reflectance)

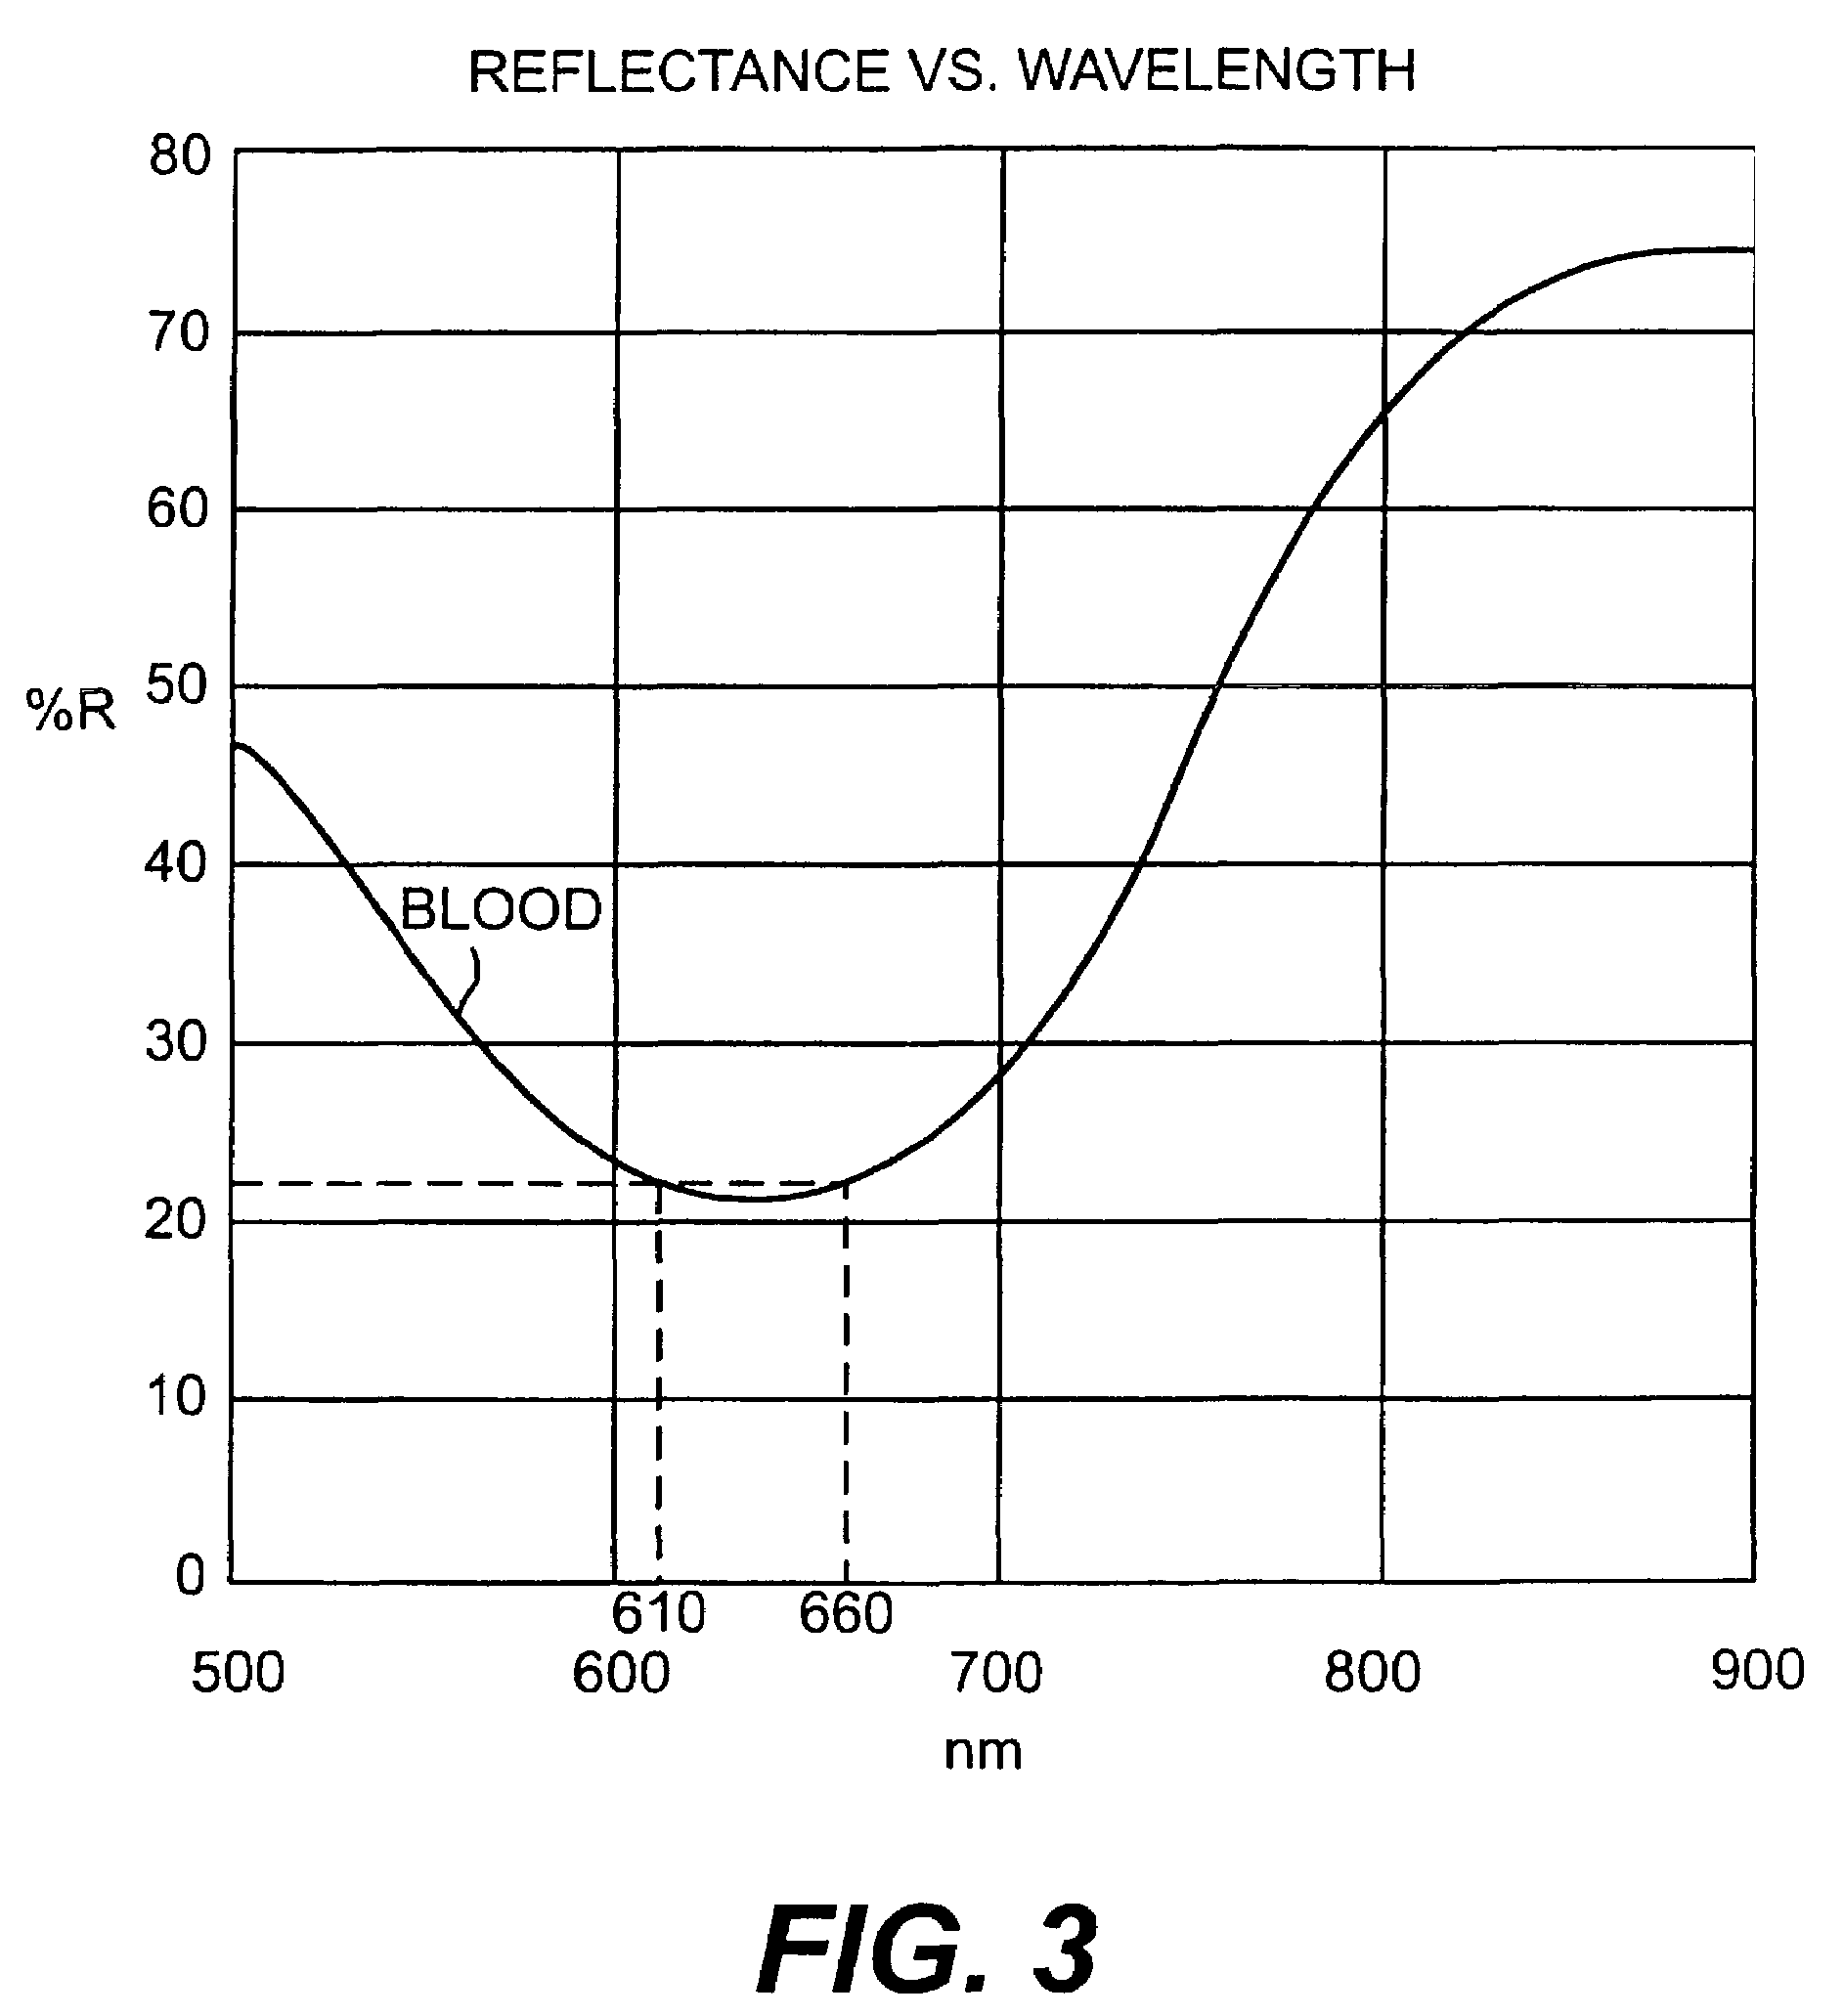
[0075]Glucose Control detected when Ch2 % R is at least 3.5% R less than the Ch1 % R at the conclusion of the test.1 1 Actual % R cutoff value varies with dyes, chromogens and wavelengths used.

Pseudo Code

[0076]If Ch2 % RCh1 % R−3.5% R Then[0077]Glucose Control sample detected[0078]Else[0079]Blood sample detected

example 2

K / S Method (Glucose Control Detection Using K / S)

[0080]Glucose Glucose Control detected when Ch2 K / S is at least 0.3 less than that of Ch1 K / S at the conclusion of the test.2 2 Actual K / S cutoff value varies with dyes, chromogens and wavelengths used.

Pseudo Code

[0081]If Ch2 K / SCh1 K / S−0.3 Then[0082]Glucose Control sample detected[0083]Else[0084]Blood sample detected

example 3

Gatlng (Control Detection with Glucose Level Gating)

[0085]Glucose control solutions are manufactured at known glucose concentrations. Certain glucose concentrations can immediately be excluded from the need for spectral analysis by glucose concentration level alone. For example, blood detection is indicated, but when final glucose value exceeds 400 mg / dL, control solution is identified. In this case, no spectral curve shape analysis would be required.

Pseudo Code

[0086]If Final Glucose>400 mg / dL Then[0087]Blood sample detected[0088]Else[0089]Spectral curve shape must be analyzed to determine sample type

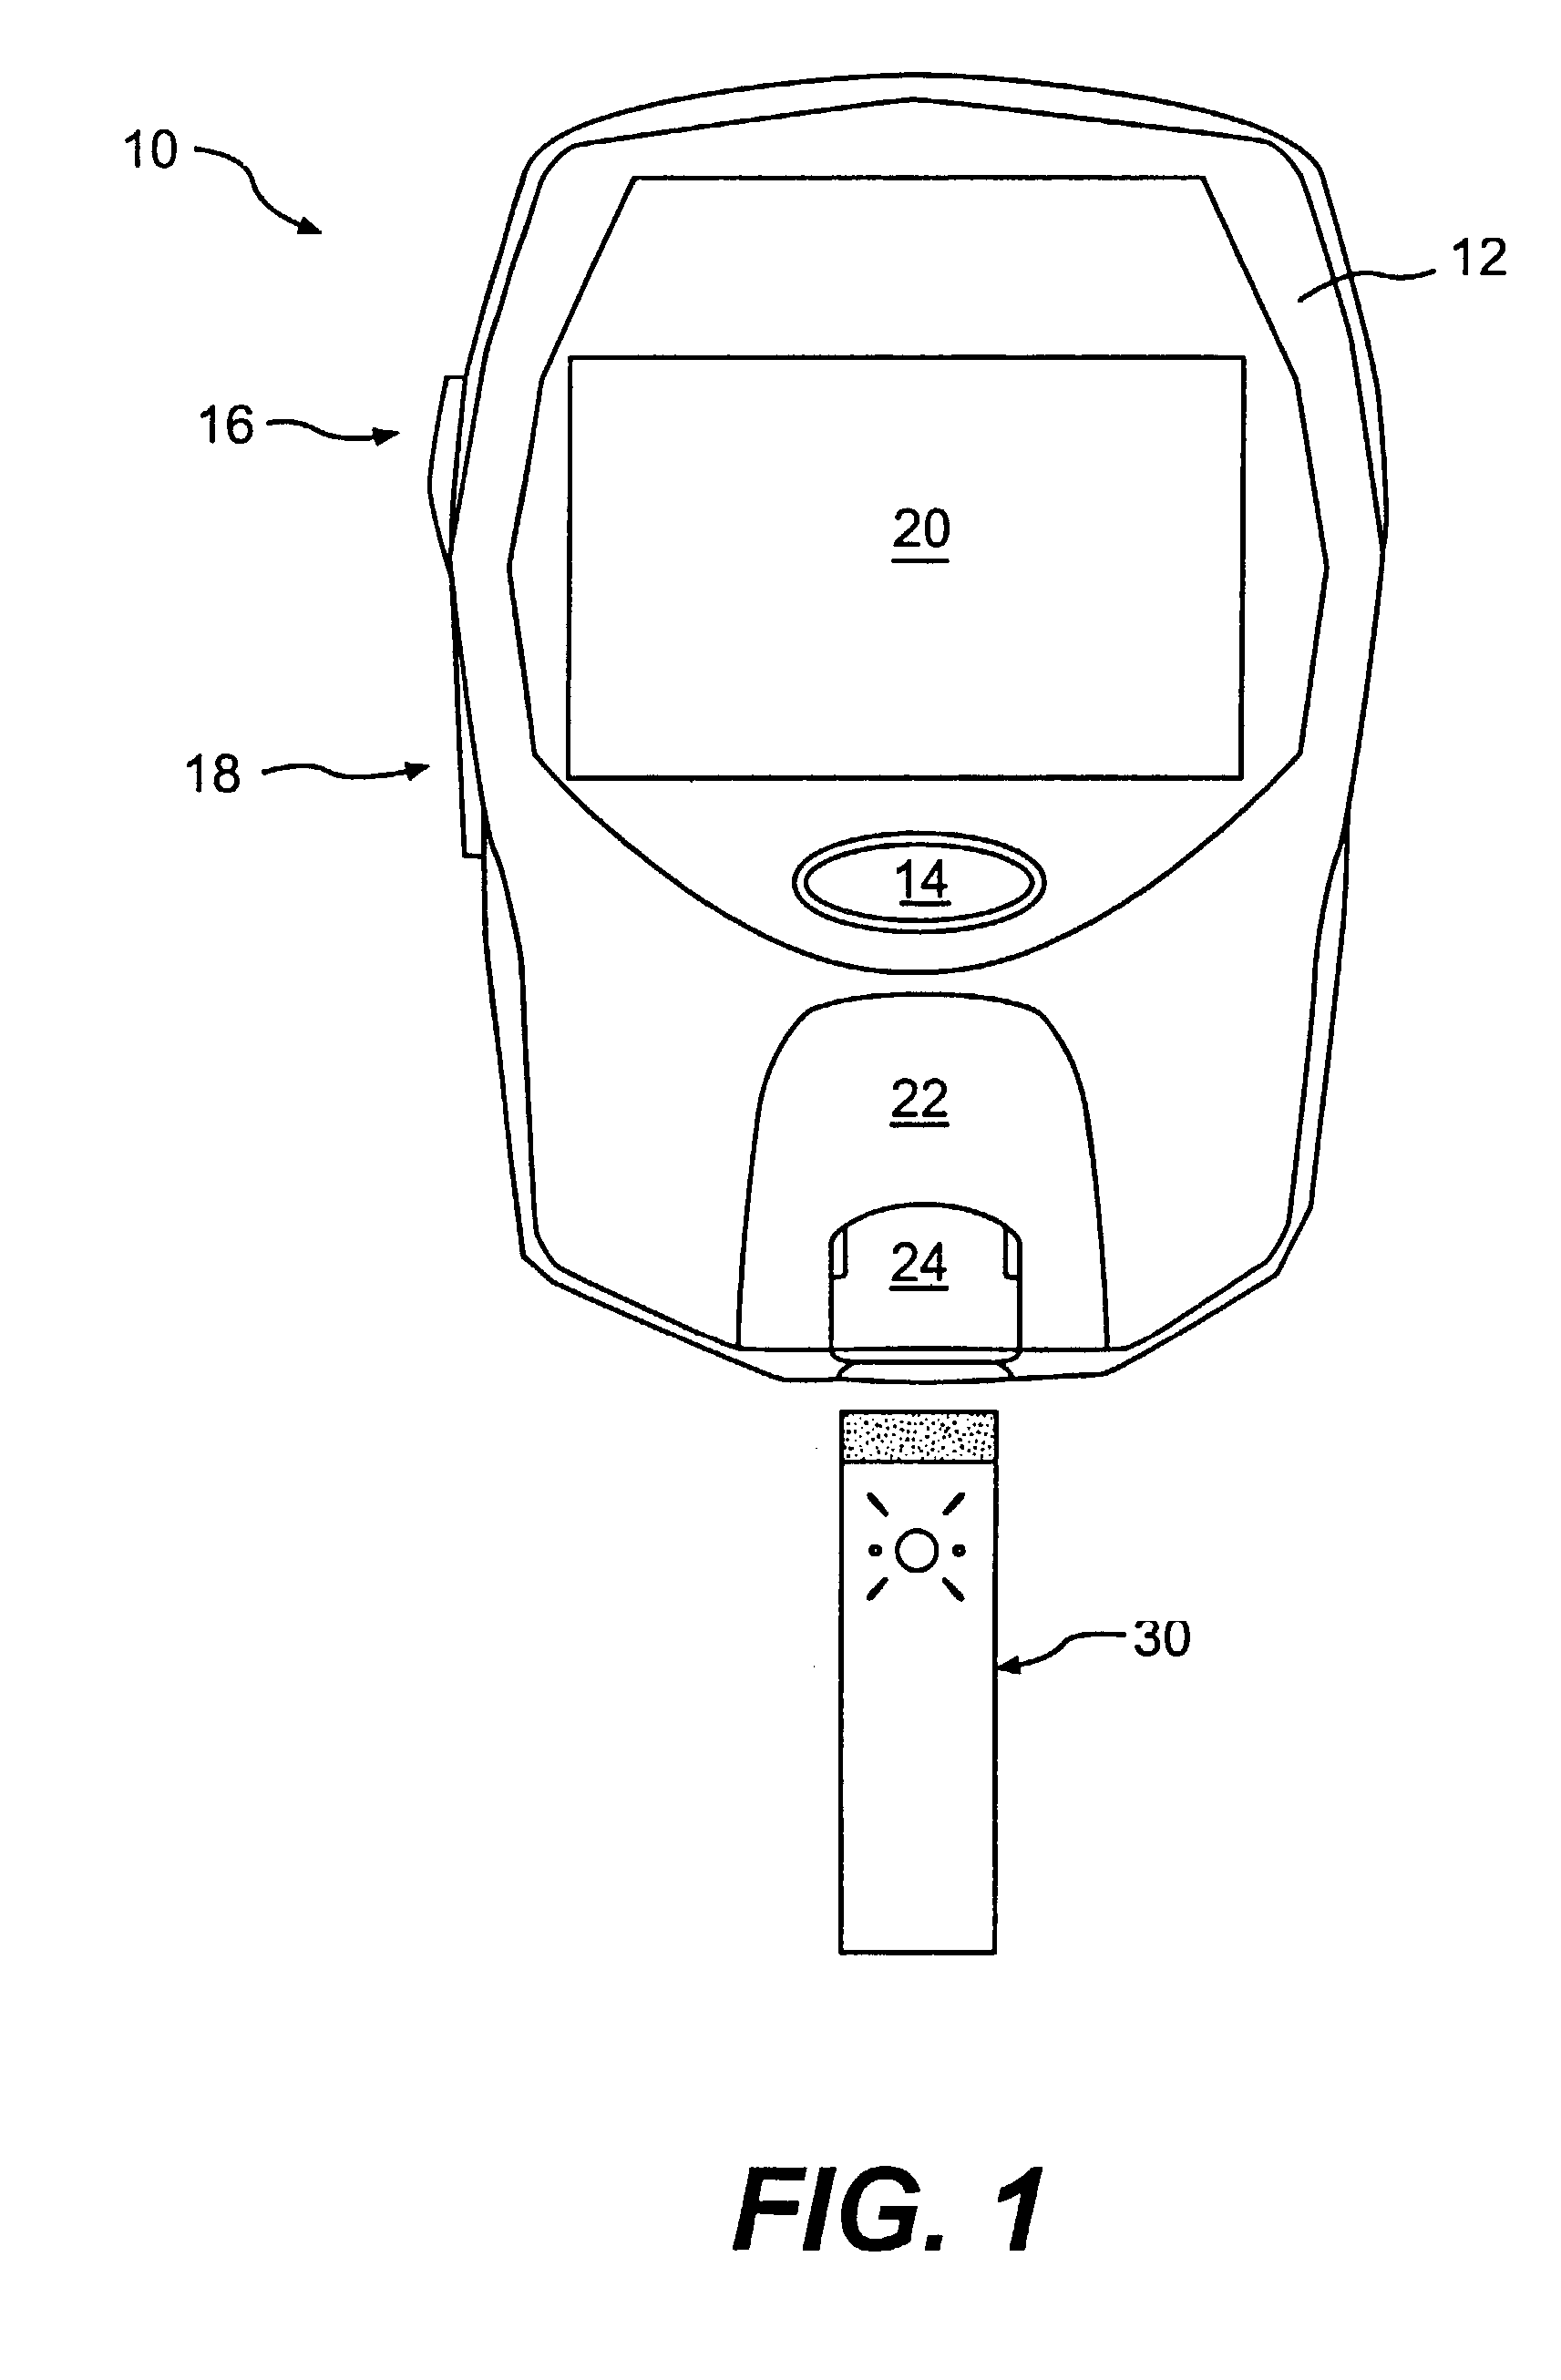
[0090]In accordance with an illustrative embodiment of this invention, and as described above, meter system 10 incorporates a second LED having a wavelength of 610 nm. The second LED operates to measure a second point along the spectral curve of the test element inserted into the meter. It is this second LED, acting in conjunction with the strip sensor, that allows the meter system acco...


PUM

PropertyMeasurementUnit
Wavelengthaaaaaaaaaa
Volumeaaaaaaaaaa

Abstract

A method and apparatus for automatically selecting test types for an analytical meter system based on the insertion into the meter of a test element. The test element can be an analytical element, formed by a test strip with a fluid such as blood applied thereto; a control element, formed by a test strip with control fluid applied thereto; or a standard element, or a standard strip exhibiting known optical properties. By inserting the test element into the analytical meter system, optical properties are measured and the existence of relationships between the measurements are ascertained. Based on the existence or nonexistence of certain relationships, the proper test can be automatically selected by the meter without the need for user interaction. Advantageously, the results of the test can be classified and stored according to test type.

Description

CROSS-REFERENCE TO RELATED APPLICATIONS[0001]This is a continuation of U.S. patent application Ser. No. 09 / 794,044, filed Feb. 28, 2001 now U.S. Pat. No. 6,562,625.DESCRIPTION OF THE INVENTION[0002]1. Field of the Invention[0003]The present invention relates generally to methods and apparatus for determining the test type to be performed on various types of test elements. More particularly, this invention provides methods for distinguishing between different types of test elements, including analytical test strips with fluid samples applied to them, analytical test strips with control solution applied to them, and standard strips as measured by a reflectance-type testing device.[0004]2. Background of the Invention[0005]Monitoring analytes such as glucose, cholesterol, intoxicants, and other constituents is frequently desirable in fluids, such as blood, plasma, blood serum, saliva, urine, and other biological fluids. In healthcare applications, such monitoring affords the opportunity...

Claims


Application Information

Patent Timeline
IPC IPC(8): G01N35/00C12Q1/68G01N15/06G01N33/00G01N33/48C12Q1/54G01N21/78G01N21/86G01N33/52G01N33/543
CPCG01N21/78G01N21/8483G01N33/54386G01N35/00594G01N35/00712G01N35/0092Y10T436/110833G01N2201/062G01N2201/0621G01N2201/0624G01N2201/0625G01N2201/0694Y10T436/10G01N2035/00108
Inventor GILMOUR, STEVEN B.MODZELEWSKI, BRENT E.
Owner TRIVIDIA HEALTH
Why Eureka
Try Eureka