Mass spectrometric differentiation of tissue states

a mass spectrometry and tissue state technology, applied in the field of mass spectrometry differentiation of tissue states, can solve the problems of reducing the efficiency of maldi analysis, evaporating explosively, and absorbing energy of matrix substances, and involving a lot of time in sample preparation

Active Publication Date: 2011-01-18
BRUKER DALTONIK GMBH & CO KG
View PDF10 Cites 22 Cited by
  • Summary
  • Abstract
  • Description
  • Claims
  • Application Information

AI Technical Summary

Benefits of technology

[0020]The invention provides a method which, on the one hand, can provide a visual representation of the mass spectrometric differentiation of tissue states and, on the other, can formulate characteristics which distinguish between healthy and diseased tissue sections using spatially resolved mass spectrometric signals of the analyzed tissue, and can do this more easily than is the case with samples analyzed on a cohort basis.
[0027]It is advisable to carry out the calculation on a computer and the tissue imaging on a screen. This makes it possible to lay a microscopic image of the tissue section (or tissue sections) true to position under the image of the distinguishing characteristics. For this, the microscopic image is represented as a color density image (brightness), for example, and the distinguishing characteristics as shades of false color (example: blue tissue is healthy; red is diseased).

Problems solved by technology

Bombarding the sample obtained in this way with sufficiently energetic short pulses of laser light leads to the matrix substance absorbing energy and evaporating explosively as a result.
For this purpose it is advisable to free the samples from interfering impurities, such as certain buffers, salts or detergents, which reduce the efficiency of the MALDI analyses.
The analysis of biological samples usually involves very time-consuming sample preparation, particularly if, at the same time, information concerning the distribution of a protein in different regions of a tissue is to be obtained.
“Laser capture microdissection”, for example, can achieve this, but the time-consuming processing described above is still necessary; there is also the difficulty of obtaining sufficient material for this type of analysis.
A considerable disadvantage of both methods is the fact that, until now, only individual features in these types of spectra have been utilized analytically, for example a peptide present in a high concentration, which is particularly typical of certain tissue states within a tissue sample.
This procedure has limited the method until now and prevented a broader application for those tissue states which cannot be attributed to the appearance of one single peptide or protein.
However, there is a general opinion that interesting distinguishing features with better statistical evidence can only be discovered when this method is performed on dozens or hundreds of samples from two so-called cohorts of individuals—one cohort serving as a reference and one cohort in which certain peculiarities or deviations in the spectra are expected because a specific clinical picture, such as intestinal cancer or prostate cancer, is present.
In the literature, however, a vehement argument is in progress about whether these markers can be used for diagnosis or not since, as yet, it has not been possible to establish whether these markers might simply be indicative of the patient's type of medication or a general stress situation associated with the illness.
In general, however, the mass spectra of the various cohorts do not contain any simple features such as a few individual signals whose intensities differ significantly in the cohorts.
However, the number of samples required easily runs into thousands.
It is a considerable problem here that the variation in the ion signals in the individual mass spectra, even within one cohort (patient or healthy), is large, and, for example, the age distribution in a group or the gender-specific distribution can have much more influence than the effect which is to be investigated.
But this is not possible when the samples are bodily fluids because of their homogenization in the body, and can, at best, be determined as a temporal variation over relatively long periods of time.

Method used


Image

  • Mass spectrometric differentiation of tissue states

Examples


Embodiment Construction

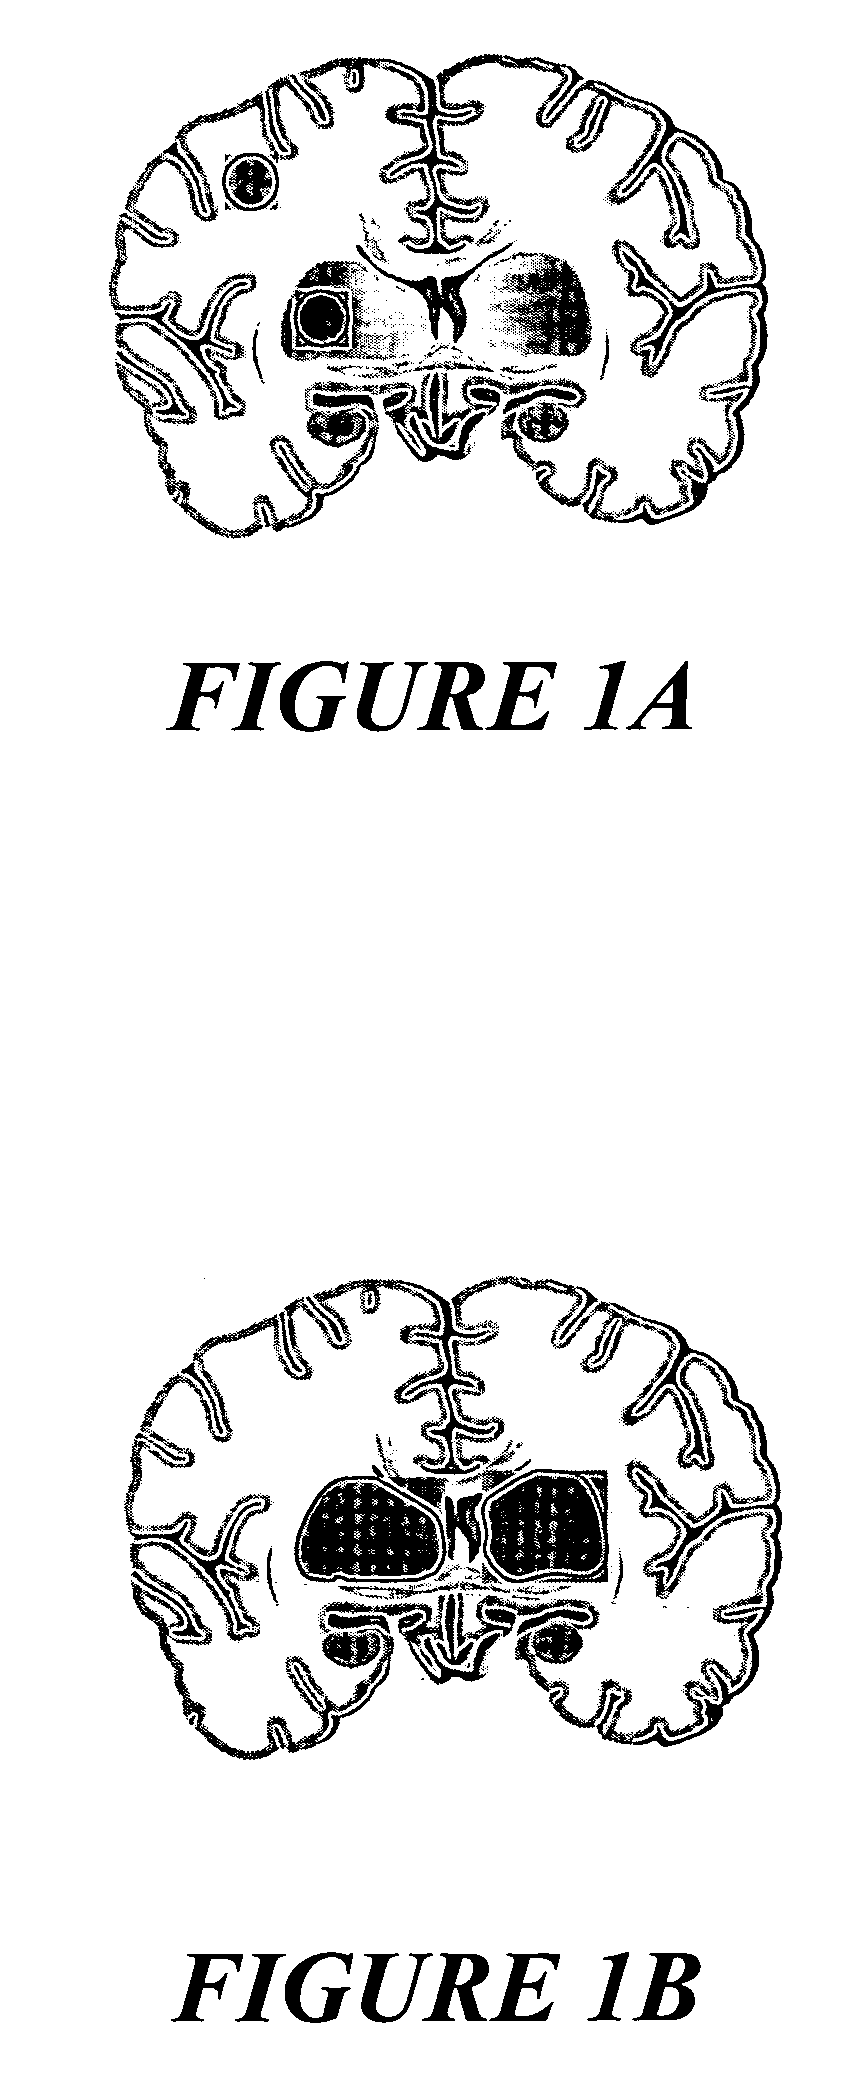
[0034]One preferred embodiment begins with the production of a microscopic tissue section, preferably from a deep-frozen piece of tissue, with a microtome. The microscopic tissue section is applied to a suitable support. This support can be a glass specimen slide, for example, whose surface is equipped with a transparent but conductive surface coating for subsequent use in the mass spectrometer. Other supports, for example metal supports or supports made of electrically conductive plastic, can also be used, however. The microscopic tissue section can then be stained in the usual way, although care has to be taken to use a stain which does not interfere with a subsequent mass spectrometric analysis of the tissue constituents. Fluorescence dyeing methods can also be used if they do not restrict the mass spectrometric analysis.

[0035]After this, a microscopic image is taken, with transmitted or reflected light, from the microscopic tissue section, and is later used to lay under the resu...


PUM

PropertyMeasurementUnit
diametersaaaaaaaaaa
diametersaaaaaaaaaa
diameteraaaaaaaaaa

Abstract

The invention relates to the determination and visualization of the spatial distribution of tissue states in histologic tissue sections on the basis of mass spectrometric signals acquired so as to be spatially resolved. The invention provides a method which determines the tissue state for the tissue spots as a state characteristic, which is calculated as a mathematical or logical expression from at least two mass signals of this tissue spot, and which indicates the tissue state as a gray-level or false-color image in one or two dimensions.

Description

FIELD OF THE INVENTION[0001]The invention relates to the determination and visualization of the spatial distribution of tissue states in histologic tissue sections on the basis of spatially resolved mass spectrometric signals.BACKGROUND OF THE INVENTION[0002]The term “tissue state” here means the state of a small subarea of a tissue section with respect to a stress, a pathological change, an infection or other type of change compared with a normal state of this tissue. The tissue state must therefore be identifiable as a concentration pattern of substances which can be detected in this small subarea by a mass spectrometer. The substances can be peptides or proteins which are under- or overexpressed and hence form a pattern, or they can include positranslational modifications of proteins, their breakdown products (metabolites), or collections of other substances in the tissue.[0003]Mass spectrometry with ionization of the samples by matrix-assisted laser desorption and ionization (MA...

Claims


Application Information

Patent Timeline
Patent Type & Authority Patents(United States)
IPC IPC(8): G06F19/00G01N24/00H01J49/00G01N27/64G01N33/483
CPCG01N33/483Y10T436/24H01J49/0004B01D59/44H01J49/26G01N27/64
Inventor SUCKAU, DETLEVSCHURENBERG, MARTINFRANZEN, JOCHEN
Owner BRUKER DALTONIK GMBH & CO KG
Why Eureka
Try Eureka