Low energy reverse osmosis process

a reverse osmosis and low energy technology, applied in the field of low energy reverse osmosis process, can solve the problems of increasing energy costs, increasing energy costs, and increasing energy costs, so as to reduce biofouling on the membrane, prevent the buildup of residual biofilm, and reduce energy consumption

Active Publication Date: 2015-03-17
AQUATECH INT LLC
View PDF15 Cites 20 Cited by
  • Summary
  • Abstract
  • Description
  • Claims
  • Application Information

AI Technical Summary

Benefits of technology

[0011]We present a novel RO desalination process that focuses on achieving low energy consumption, at least in part by reducing biofouling on the membrane through process design, and integrating a cleaning methodology that prevents buildup of any residual biofilm on the membrane surface. To achieve sustainable lower energy consumption it is important to ensure the membranes do not foul and the differential pressure does not increase. A cleaning methodology should be available to clean membranes in a very initial phase of bio-fouling formation, before it impacts differential pressure, and before any fouling becomes permanent and starts impacting plant performance in terms of water production, power consumption and product quality.
[0012]Our process offers a number of advantages. Where typical processes encounter substantial biofouling when flux is reduced, our combination of ultrafiltration and biofoulant removers at low flux operation reduces both the amount and severity of biofouling and energy consumption. The combination of these features provides a unique low energy and low fouling process. Further, by decreasing the severity of the biofouling, we are able to provide an effective low-pressure differential osmotic cleaning mechanism that is low-cost, low-chemical, and effective, and that makes sure sustained low energy operation can be continued.

Problems solved by technology

This challenge is mostly experienced with seawater plants due to higher energy consumption, but there has been elevated attention on brackish water plants as well, due to significant increases in energy costs.
These energy costs are further exacerbated by escalation of energy costs due to fouling problems during plant operation.
One challenge with plant management is that once the plant has been designed for some energy consumption, the plant's energy consumption does not remain steady and consistent once the water production starts.
This may be due to several reasons, but predominantly it is because of fouling, scaling or membrane compaction.
Out of these three, scaling may be the biggest contributor to energy consumption in brackish water, but fouling is the biggest cause of energy consumption in seawater and surface water-based RO plants.
Moreover, due to heavy emphasis on recycling and reuse of water, it has become typical to design RO brackish water plants at as high as 97-98% recovery, which makes the fouling and scaling problems much more challenging.
Another serious problem that RO plants encounter is bio-fouling, which reduces productivity of water, increases the differential pressure and increases power consumption.
This problem is compounded in plants where there are open intakes and where water temperature increases during summer.
Chlorine treatment makes this worse due to formation of oxidized products, which provide potent feed for the residual bacteria right on the membrane surface where they are rejected along with the bacteria after the de-chlorination process.
Chlorination typically cannot be considered as a sustainable process option to control bio fouling, because the balance bacteria left after chlorination multiply much faster after de-chlorination with the potent nutrients as food for bacteria.
Moreover chlorinated organic products may be undesirable due to formation of carcinogens.
Other chemical approaches like biocide treatment have found limited success and are too expensive.
These approaches have improved productivity and reduced the magnitude of this problem but have not provided a sustainable solution for plant productivity and power consumption efficiency.
Bio-fouling increases the power consumption so a low energy membrane design cannot work alone without a comprehensive approach on bio fouling control.
As the differential pressure increases it becomes difficult to clean the membranes and regain the original performance when the membrane was in its clean condition.
It is also known that with higher differential pressure, permeate quality deteriorates.
Beyond a point, cleaning conditions become much more aggressive and cleaning chemicals must be used for a longer time to reestablish clean membrane performance.
Many chemical cleanings are not practical to perform under aggressive conditions because membranes lose performance.
Moreover disposal of cleaning chemicals need elaborate treatment and neutralization, which consumes additional chemicals.

Method used


Image

  • Low energy reverse osmosis process
  • Low energy reverse osmosis process
  • Low energy reverse osmosis process

Examples


experiment-1

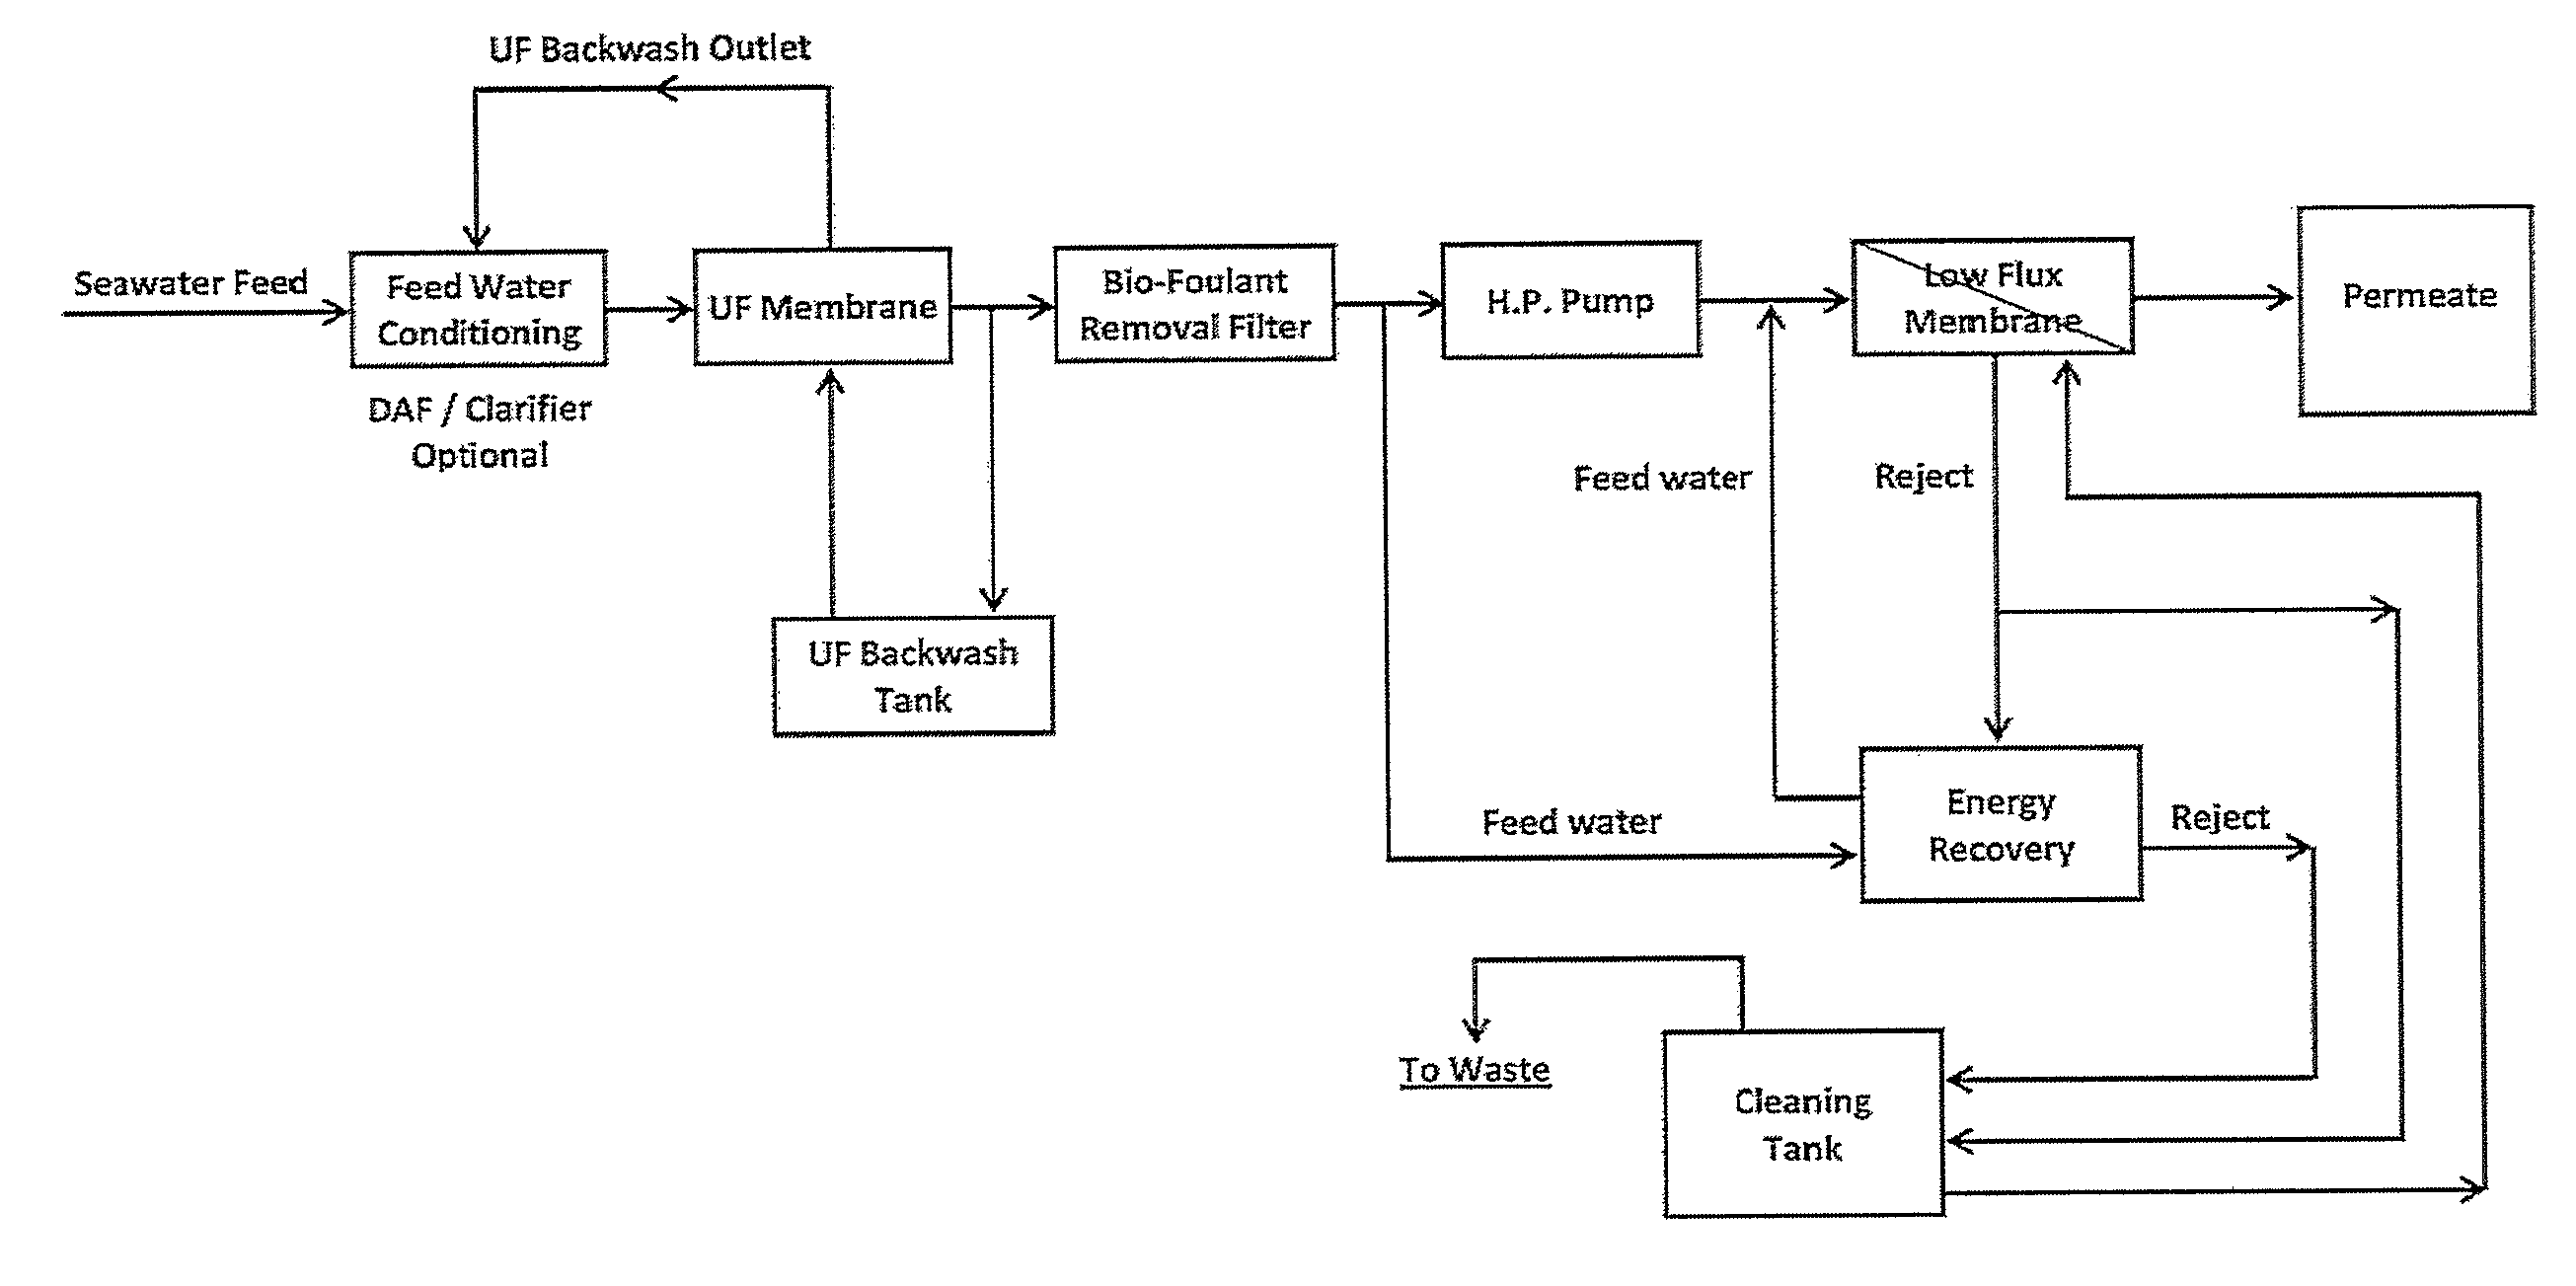
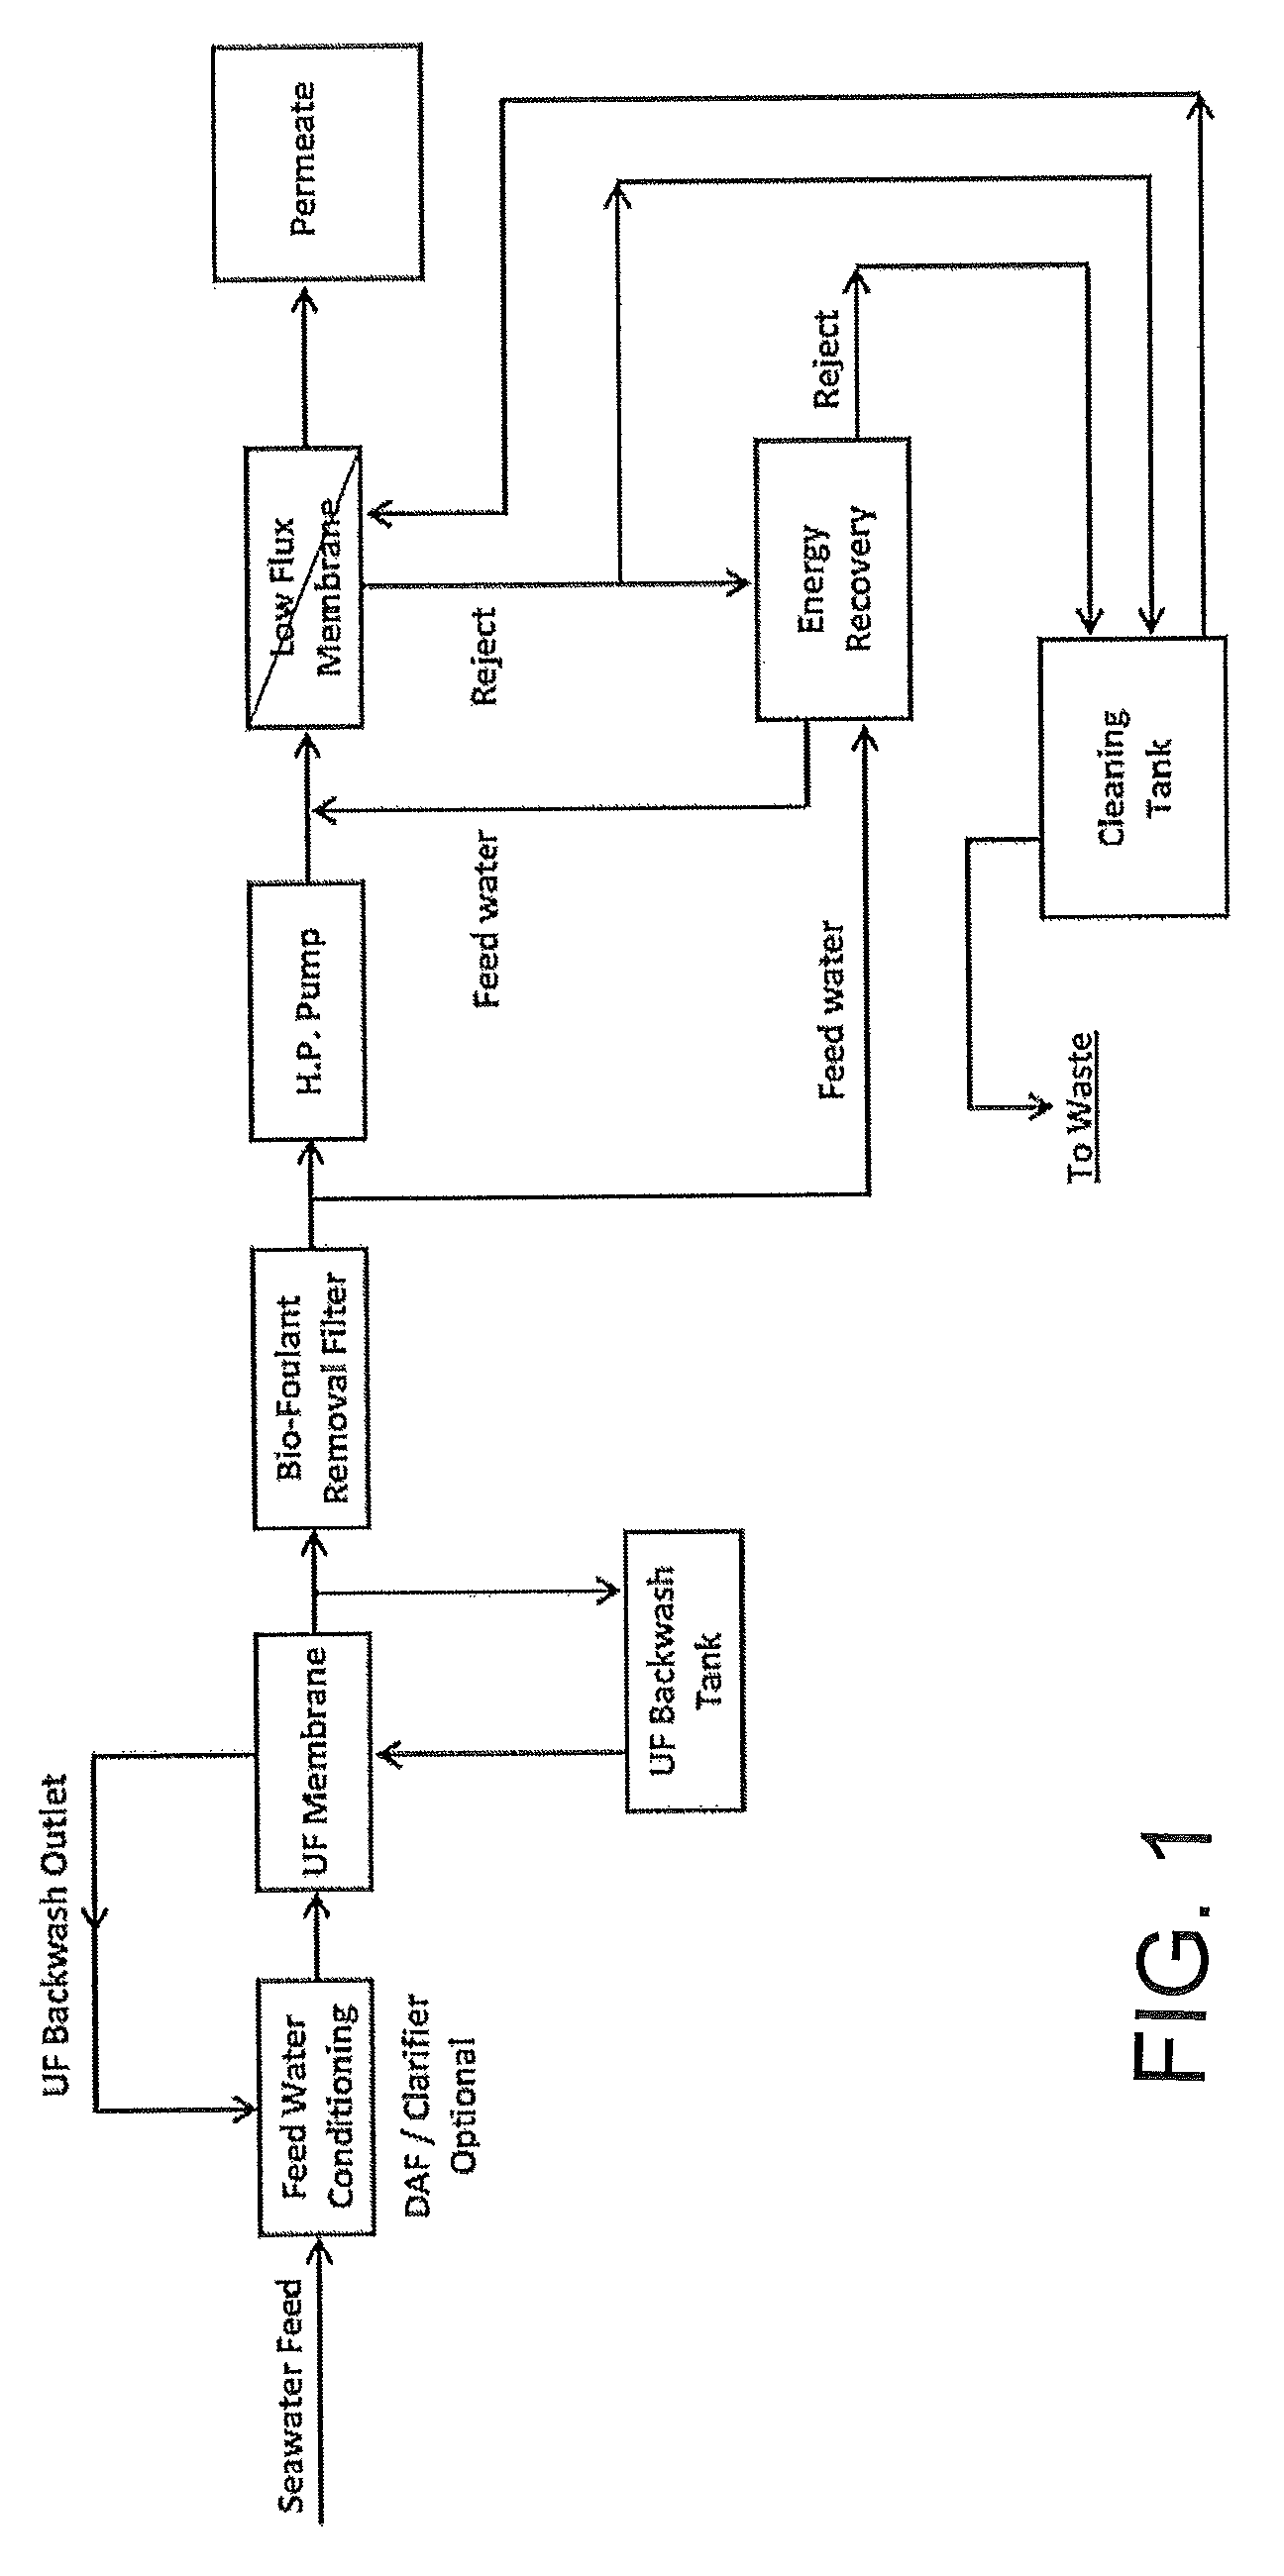
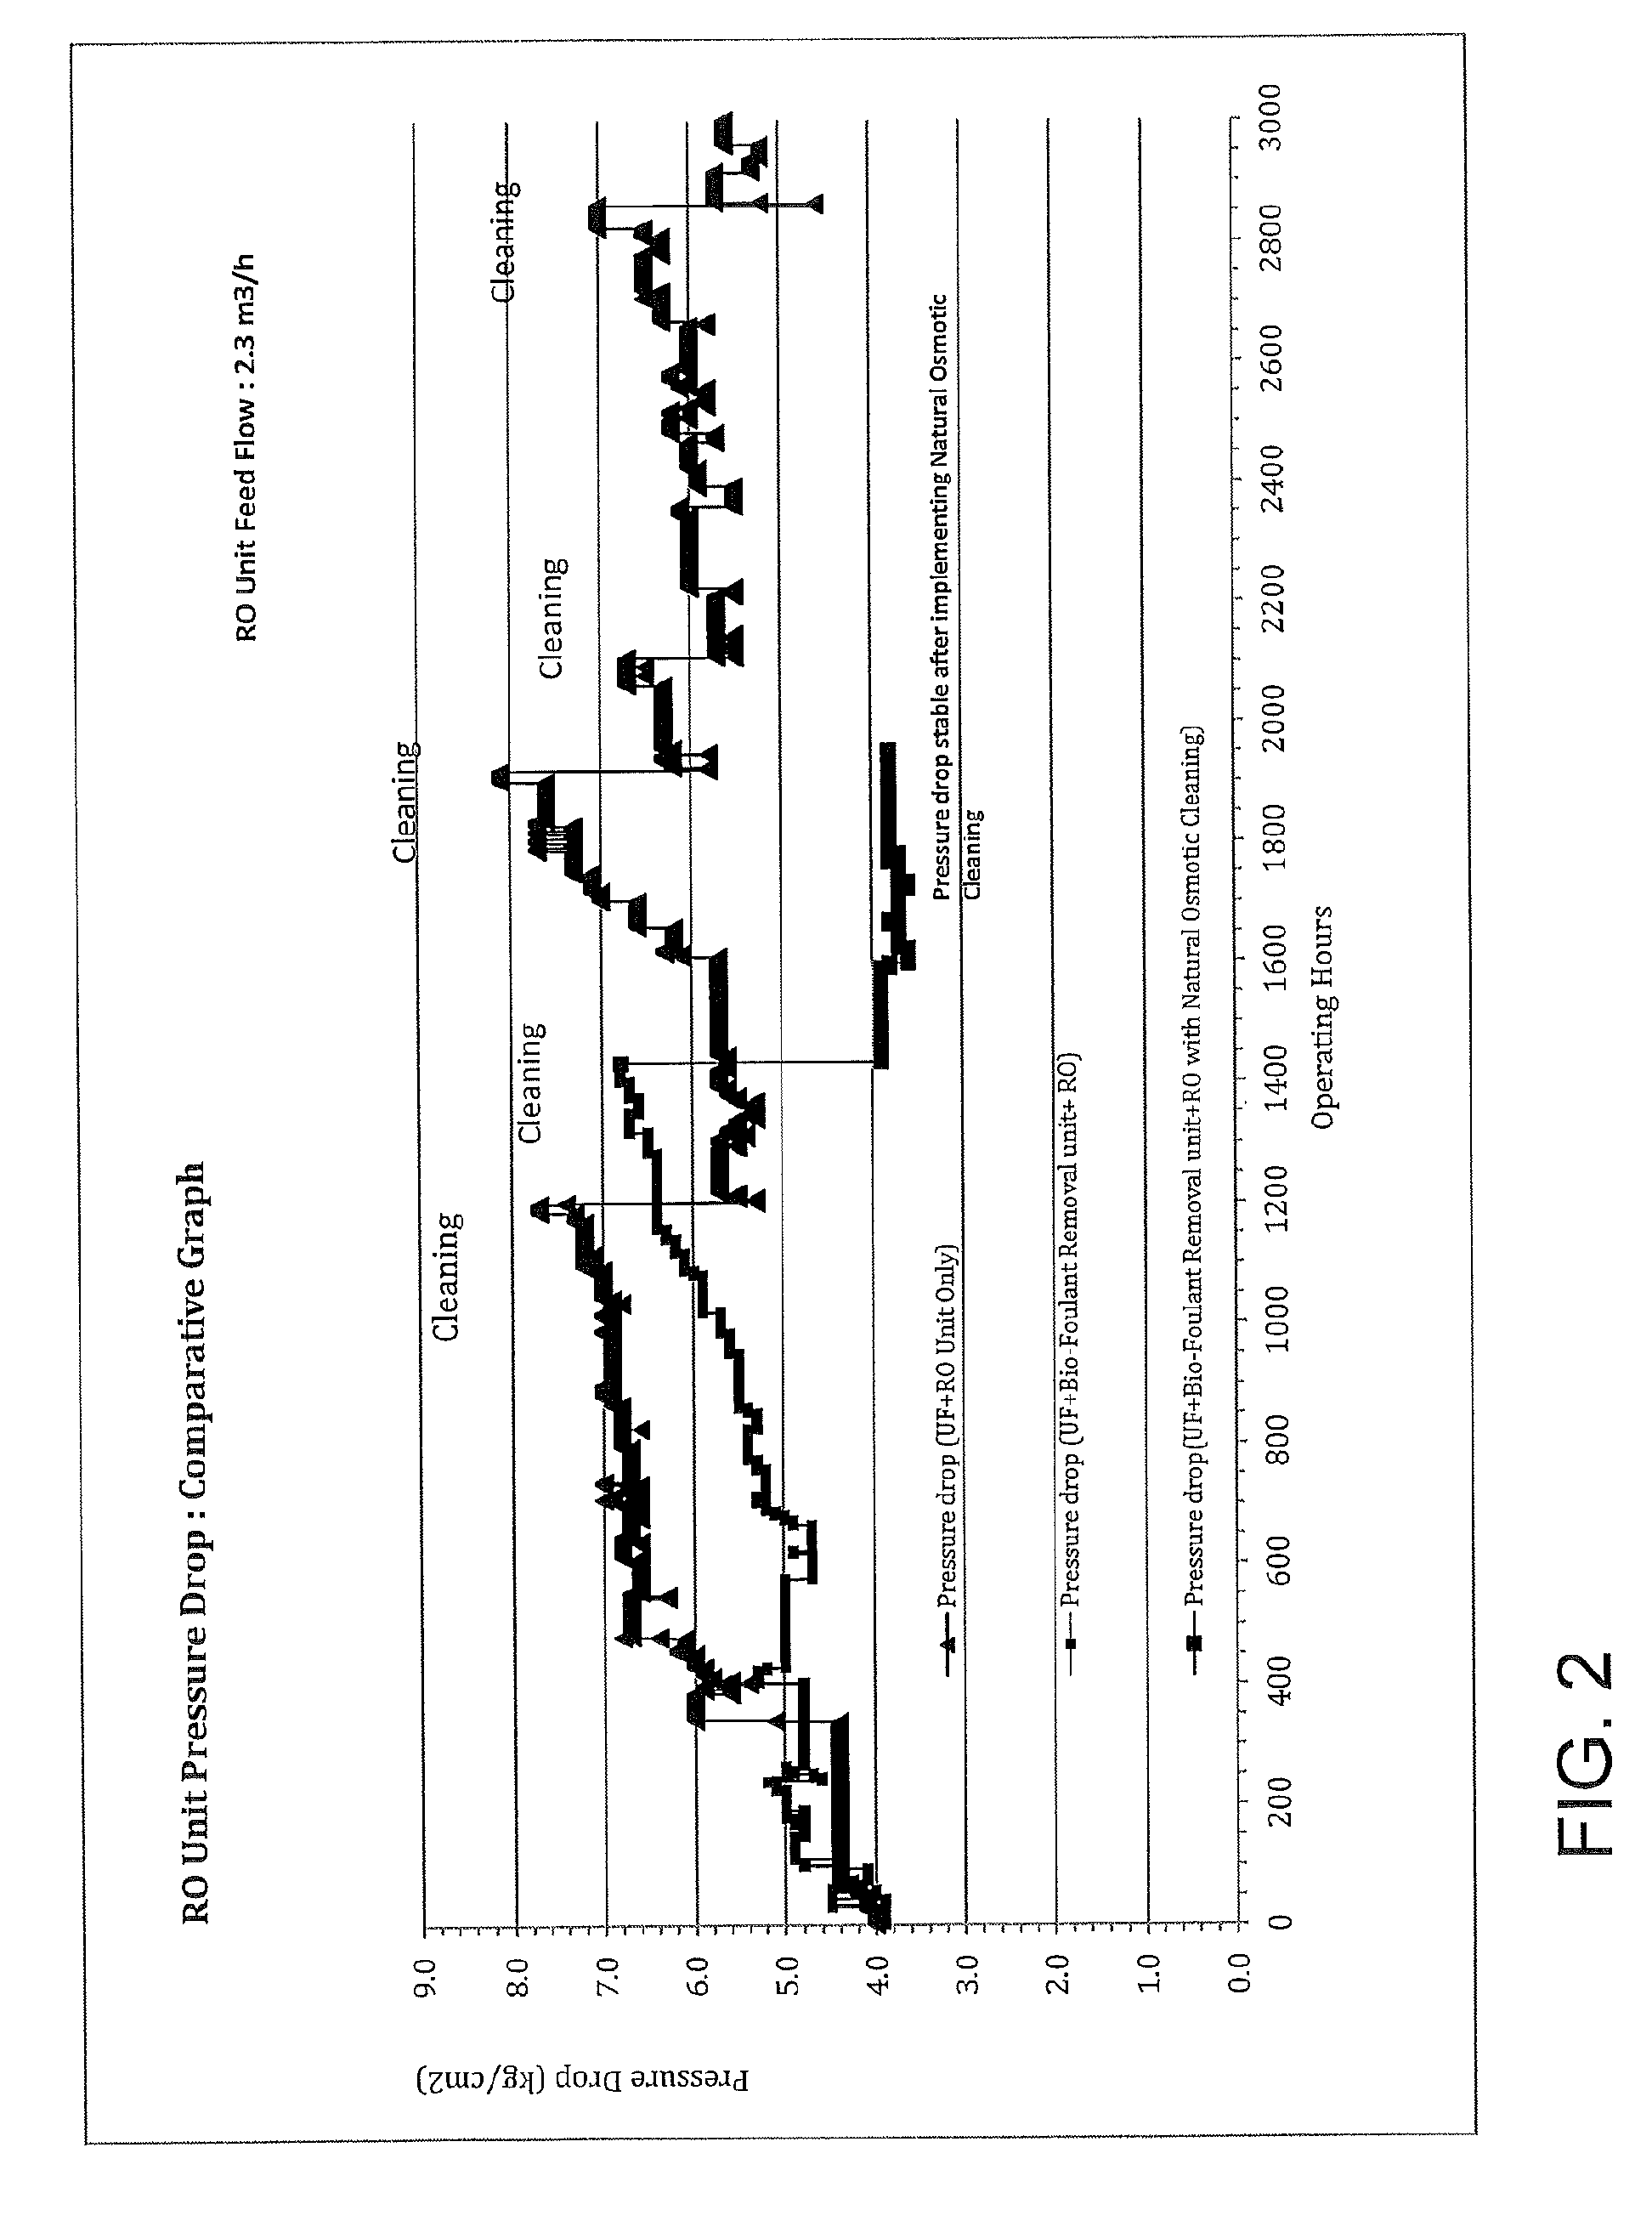
[0054]To benchmark base performance, a reverse osmosis (RO) unit with 2.3 m3 / hr flow rate was operated for 17 months on surface water having TOC level of 5-10 ppm without any biofoulant removal unit at the upstream of RO unit. This source of water was selected due to its history of biofouling for several years. Based on the original plant design, the surface water was passed through an ultrafiltration (UF) unit before feeding into an RO Unit. We maintained the silt density index (SDI) below 5, most of the time below 3. The RO unit pressure drop was monitored and its results are shown in FIG. 3.

[0055]During 17 months of RO unit operation, we cleaned the unit seven times to maintain the pressure drop of the RO Unit. It was observed that the average service cycle length of the RO Unit was around 700 hrs, and it required chemical cleaning for maintaining the pressure drop, product quality and energy consumption. Operating hours of this RO unit in different service cycles are shown in Ta...

experiment-2

[0057]In this experiment, a biofoulant removal unit was installed in the UF product line, and we monitored the TOC and turbidity removal across the biofoulant removal unit. The results of TOC & Turbidity are shown in Table 2. TOC of water was analyzed on Shimadzo-TOC analyzer, and the turbidity was checked by HACH-turbidity analyzer. In this experiment the biofilter was made up of electro positive media material.

[0058]

TABLE 2Bio-FoulantBio-FoulantRemoval unitUF ProductRemoval unitUF ProductOutlet TOCTurbidityOutlet TurbidityTOC (ppm)(ppm)(NTU)(NTU)5.133.830.0690.0545.173.920.0650.0595.163.880.0670.0645.202.840.0690.0615.683.980.0680.0654.381.080.0680.065.163.980.0660.065.163.270.0710.0595.283.310.0730.0635.483.380.0660.0585.133.050.0690.0655.263.590.0650.0585.063.810.0670.064.983.020.0640.0605.133.680.0650.0615.363.820.0660.0595.863.020.0660.0605.023.120.0680.0604.823.300.0700.0605.683.820.0680.0554.581.620.0690.0595.032.910.0680.0634.282.030.0690.0565.212.910.0660.0594.282.060.0650...

experiment-3

[0060]In another set of experiments, the same RO unit of the previous examples was operated for nine months with the inclusion of biofoulant removal unit along with UF at the upstream at the upstream of RO unit and its effect was clearly observed with respect to longer service cycle length. RO unit was operated for around 1425 hours without any cleaning, which is almost twice the previous average service cycles length of Experiment 1. In this experiment the RO unit was cleaned only once after the operation of six months. RO unit performance with bio-foulant removal unit is shown in FIG. 4. During this operation it was observed that for more than 3 months there was very insignificant increase in differential pressure but once it started increasing gradually subsequent fouling rate started accelerating and progressively started increasing.

[0061]Even though the biofoulant removal unit minimized the pressure drop rise & biofouling in RO unit, still the pressure drop gradually increased ...


PUM

PropertyMeasurementUnit
temperatureaaaaaaaaaa
flow rateaaaaaaaaaa
turbidityaaaaaaaaaa

Abstract

We provide a system and method for reverse osmosis treatment of water, including seawater and brackish water. Methods and systems of embodiments of the invention may include, for example, ultrafiltration followed by biofoulant removal, both of which precede reverse osmosis. In preferred embodiments the system is run at a low flux. For example, a flux of 6-8 GFD may be used with seawater. Additional embodiments may provide the above process in conjunction with a reverse-osmosis membrane cleaning system. The membrane cleaning system is a “clean in place” system that includes use of the natural pressure differential in the reverse osmosis system to remove biofoulants and their precursors.

Description

CROSS REFERENCE TO RELATED APPLICATIONS[0001]This application is the United States national phase under 35 U.S.C. §371 of PCT International Patent Application No. PCT / US2013 / 037744, filed on Apr. 23, 2013 and claiming priority to U.S. Provisional Patent Application No. 61 / 636,930, filed on Apr. 23, 2012, and incorporated by reference herein.BACKGROUND OF THE INVENTION[0002]1. Field of the Invention[0003]Embodiments of the invention relate to methods, systems, and processes for desalination using reverse osmosis.[0004]2. Background of the Related Art[0005]Water desalination is growing to meet industrial and drinking water demand worldwide. Although both thermal desalination (multi effect distillation or “MED”, and multi stage flash evaporation or “MSF”) and membrane based seawater reverse osmosis (“SWRO”) processes are used in these plants, SWRO has grown predominantly over the last 15-20 years. SWRO has become very cost effective and efficient in terms of energy consumption as compa...

Claims


Application Information

Patent Timeline
Patent Type & Authority Patents(United States)
IPC IPC(8): B01J49/00C02F9/00C02F1/42B01J39/00B01D61/00B01D15/00C02F1/00B01D37/00A61M1/16B01D1/00B01D36/02B01D33/00B01D29/00B01D25/00B01D24/00C02F1/24B03D1/00B01D27/00B01D61/02B01D61/14B01D61/58B01D65/02B01D65/06C02F1/44C02F1/46C02F1/48C02F103/08
CPCC02F1/444B01D65/02B01D65/06C02F1/48C02F9/00B01D61/58C02F2303/16B01D61/025B01D61/145C02F1/24C02F1/42C02F1/441C02F1/46C02F2103/08C02F2303/10B01D61/04B01D65/08C02F2303/14C02F2303/20C02F2209/20B01D2321/14B01D2321/16B01D2321/22Y02W10/30Y02A20/131B01D2321/04B01D2321/06
Inventor CHIDAMBARAN, RAVI
Owner AQUATECH INT LLC
Why Eureka
Try Eureka